World Maritime University
The Maritime Commons: Digital Repository of the World
Maritime University
World Maritime University Dissertations Dissertations
2015
Managing optimum workload through terminal
appointment system (TAS) : Case of Jakarta
International Container Terminal
Usman Saroni
World Maritime University
Follow this and additional works at:http://commons.wmu.se/all_dissertations
Part of theTransportation Commons
This Dissertation is brought to you courtesy of Maritime Commons. Open Access items may be downloaded for non-commercial, fair use academic purposes. No items may be hosted on another server or web site without express written permission from the World Maritime University. For more information, please [email protected].
Recommended Citation
Saroni, Usman, "Managing optimum workload through terminal appointment system (TAS) : Case of Jakarta International Container Terminal" (2015).World Maritime University Dissertations. 494.
WORLD MARITIME UNIVERSITY
Malmö, Sweden
MANAGING OPTIMUM WORKLOAD THROUGH
TERMINAL APPOINTMENT SYSTEM (TAS)
Case of Jakarta International Container Terminal
By
Usman Saroni
Indonesia
A dissertation submitted to the World Maritime University in partial
fulfillment of the requirements for the award of the degree of
MASTER OF SCIENCE
In
MARITIME AFFAIRS
(SHIPPING MANAGEMENT AND LOGISTIC)
2015
i
Declaration
I certify that all the material in this dissertation that is not my work has been identified and that no material is included for which a degree has previously been conferred on me.
The contents of this dissertation reflect my personal views and are not necessarily endorsed by the University.
(Signature): ... (Date) : ...
Supervised by: *
World Maritime University
Assessor: *
Institution/organization:
Co-assessor: *
ii
Acknowledgement
First, I wish to thank Allah SWT, God Almighty for all bless and chance given to me.
I would like to express my gratitude to my supervisor, Professor Ilias Visvikis, who
granted me with direction, technical support and became more of a mentor and
colleague, than a professor. It was his persistence, understanding and kindness that I
completed my Masters Programme. I doubt that I will ever be able to convey my
appreciation entirely, but I owe him my eternal gratitude.
I must also acknowledge Mr. Kim Chang Su, The Operations and Engineering of Jakarta
International Container Terminal (JICT). I am thankful for his cooperation and support
in granting me the data transaction of his company‟s equipment and allowing me to use
the data for the case study in this dissertation thesis.
I would also like to thank my family for the support they provided me through my entire
life. In particular, I must acknowledge my wife and my children, without whose love and
encouragement, I would not have finished this dissertation thesis.
In conclusion, I recognize that this course and research would not have been possible
without the financial assistance of PT. Pelabuhan Indonesia II (IPC). Special gratitude is
conveyed to Mr. RJ. Lino the CEO of IPC, and Mr. Dana Amin the Operation Director
of IPC, for their commitment to IPC employee education.
Usman Saroni
iii
Abstract
Title of Dissertation: Optimization of Container Terminal through Terminal
Appointment System (TAS): Managing optimum workload of container terminal operation, case of Jakarta International Container Terminal (JICT)
Degree: MSc
The Dissertation is a study of optimizing terminal through Terminal Appointment System (TAS), comparing the impact of unscheduled truck arrival with regulated truck arrival to the optimization process. A brief look is taken at present growth in container business. The rapid growth of world container trade, especially in Asia brings economic potentials for the countries and also challenges for container terminals. Capacity limitation in accommodating the trade growth forces the terminal to optimize their existing equipment and facilities. The evaluation of the existing performance of each component of the terminal operation, covering quay, yard and gate operation, is a starting point to identify the crucial problem in the optimization process. Many terminals implement Terminal Appointment System (TAS) to optimize their operation. This dissertation discuss the benefit and the impact of TAS implementation to the container terminal operation. The concluding chapter examines the impact of TAS solution in optimizing terminal operation. Some recommendations are made concerning the implementation of TAS.
KEYWORDS:
Terminal Appointment System, Container, Optimization, Appointment, Quantitative
iv
Table of Contents
Declaration ... i
Acknowledgement ... ii
Abstract ... iii
Table of Contents ... iv
List of Figures ... vi
List of Tables ... vii
CHAPTER 1. INTRODUCTION ... 1
1.1. Background ... 1
1.2. Objectives ... 5
1.3. Scope of Work and Methodology ... 5
1.4. Structure and organization ... 6
CHAPTER 2. LITERATURE REVIEW ... 8
2.1. Introduction ... 8
2.2. Quay Operation ... 9
2.3. Yard Operation ... 12
2.4. Gate Operation ... 15
2.4. Terminal Appointment System (TAS) ... 17
CHAPTER 3. PROBLEM IDENTIFICATION ... 22
3.1. Introduction ... 22
3.2. Problem Identification by BCG Matrix Model ... 24
3.3. Case Study: Jakarta International Container Terminal (JICT) ... 27
CHAPTER 4. PROBLEM ANALYSIS ... 36
4.1. Yard Operation Productivity ... 36
4.2. Yard Operation Workload ... 40
4.2. Yard Operation Optimum level ... 43
4.3. Managing Yard Workload ... 46
v
CHAPTER 5. PROBLEM SOLVING USING TAS ... 52
CHAPTER 6. CONCLUSION and RECOMMENDATION ... 56
Bibliography ... 58
Appendices ... 65
Appendix-1: Data Daily Equipment Deployment ... 65
Appendix-2: Data Hourly Equipment Deployment ... 66
Appendix-3: Data Hourly Equipment Performance ... 67
Appendix-4: Data Sample Ed and Cm ... 68
vi
List of Figures
Figure 1 Container Terminal Operation Process ... 9
Figure 2 Comparing the Single Cycle and Dual Cycle QC Movement ... 11
Figure 3 General Process of Truck Handling ... 16
Figure 4 Bottleneck Illustration ... 23
Figure 5 BCG Matrix Model ... 27
Figure 6 Industrial Hinterland of Tanjung Priok Port ... 28
Figure 7 Max QC.Deployment: Unit/day ... 30
Figure 8 Avg.QCDeployment: unit/hour ... 30
Figure 9 Avg.QC Performance: Box/hour ... 30
Figure 10 Max.RTG Deployment: Unit/day ... 31
Figure 11 Avg.RTG Deployment: unit/hour ... 31
Figure 12 Avg.RTG Performance: Box/hour ... 31
Figure 13 Max.FL Deployment: Unit/day ... 32
Figure 14 Avg. FL Deployment: unit/hour ... 32
Figure 15 Avg.FL Performance: Box/hour ... 32
Figure 16 Max.Gate Deployment: unit/day ... 32
Figure 17 Avg.Gate Deployment: unit/hour ... 33
Figure 18 Avg.Gate Performance: Box/hour ... 33
Figure 19 BCG Matrix Mapping ... 34
Figure 20 Scatter Graph of Relationship between Cm and Ed ... 37
Figure 21 Histogram-Normality Test ... 38
Figure 22 Unutilized Area at Quay and Gate ... 40
Figure 23 Yard Workload Composition ... 43
Figure 24 Queue Modeling Time Intervals ... 47
Figure 25 Average Backlog Truck/hour ... 49
Figure 26 Average of Backlog + Truck at (t+1) ... 50
Figure 27 Quay Workload versus Gate Quota ... 54
vii
List of Tables
Table 1 List of Some Container Port With TAS ... 17
Table 2 Category of Reserved Value ... 26
Table 3 Infrastructure Capacity Mapping ... 33
Table 4 Equipment Productivity Mapping ... 34
Table 5 Summary Output of Regression ... 37
Table 6 Serial Correlation Test ... 38
Table 7 Heteroskedasticity Test ... 38
Table 8 Solver Linear Programming Result ... 52
1
CHAPTER 1. INTRODUCTION
1.1. Background
World Trade seaborne trade volumes are forecasted grow by 4.2% in 2014. East–West
trade and intra-Asian trade are driver factors of global trade with volumes projected
gains by 6 per cent and 7.7 per cent respectively. China and ASEAN (The Association of
Southeast Asian Nations) countries play as main players in the intra-Asian trade, with
total trade reach $500 billion in 2015 (Review of Maritime Transport, 2014, p. 23).
Even though China is still the biggest economy of emerging market, ASEAN (The
Association of Southeast Asian Nations) countries have an immense potential to be a
new major global hub of manufacturing and trade. ASEAN encompasses Brunei,
Cambodia, Indonesia, Laos, Malaysia, Myanmar, the Philippines, Singapore, Thailand,
and Vietnam. ASEAN countries combined GDP reached $2.4 trillion in 2013, and it is
projected to be the fourth-largest economy by 2050. The GDP was generated mainly by
the service sector and industry sector that accounted for more than 80% of total GDP
(ASEAN, 2014).
Industrialization in ASEAN is growing along with the availability of cheaper labor force
and growing number of consuming class. Inhabited by 630 million populations attract
companies to relocate their business base to ASEAN to get more competitive production
cost and closer to the potential market. Government of ASEAN countries are competing
to provide infrastructures and facilities to invite more industry to invest in their country.
The success of ASEAN countries in gaining the trade growth in the region differs one to
the others. Even though the size of the market and the availability of natural resources
2
facilities is imminent in building trade competitiveness. The key factor of commerce
facilities are infrastructures and business easiness. These are components where World
Bank evaluates the trade competitiveness of a country.
An obvious comparison, between Singapore and Indonesia, reflects how trade
infrastructures influence the quality of trade competitiveness. In 2014, Singapore with
population is only 5.4 million generate 783,265.5 Million USD while Indonesia with 250
million population only reached 369,180.5 million USD (ASEAN, 2014).
Indonesia is a valid case study of how infrastructures become barriers to optimizing
resources and gaining the bigger opportunities in the trade. Even though Indonesia has
the largest market among ASEAN countries and has potential natural resources,
nevertheless it has weak competitiveness in the international trade. World Bank report,
LPI 2014 (Logistic Performance Index), reflects that Indonesia rank for international
shipment and infrastructure are still lower than the average of ASEAN countries.
Port capacity limitation as one of the key components of international trade is still a
significant challenge in Indonesia. Shortness of capacity has decelerated the effort to
draw up and realize the national and regional economic potentials (Bahagia, Sandee, and
Meeuws, 2013, p. 1). Owing to limitation of capacity, some volume of trade should be
diverted to Singapore for transit, before entering Indonesia port. The other cargo that
succeeded in entering Indonesia port may face challenging logistical problems, such as
congestion, longer turn round time, traffic congestion, and delays in delivery and
eventually leads to high cost of logistic.
Many of Indonesia's main ports are already taxed. Technical work undertaken for the
National Ports Master Plan estimated that the ports of Belawan, Tanjung Emas, Tanjung
3
Ports of Pekanbaru and Samarinda, are each operating at around 80% of actual capacity
(Law, 2012, p. 13).
Tanjung Priok is the densest among Indonesia‟s Port. Since the ASEAN-China Free
Trade Agreement came into effect in January 2010, Tanjung Priok, the country‟s main
trade gateway, has seen constant congestion. Tanjung Priok was intended to handle 5m
TEUs, but it managed 5.6m TEUs in 2011 and 6.2m TEUs in 2012 (Oxford, 2014).
As the country's main gateway that is handling approximately 65.5% of the external
trade volumes of Indonesia. Tanjung Priok Port is stressed to serve the growth of
commerce in a limited infrastructure. The traffic jams in Greater Jakarta are happening
and hindering investment. Tanjung Priok – the country‟s main international sea-freight
gateway – is close to full capacity (Henry Sandee, 2011). As the result of under-capacity
and operational inefficiencies, there is high congestion in and around the port, with
frequent queues before the gates of several kilometers long (OECD, 2014).
Container throughput at Tanjung Priok Port is predicted to increase by 65.5% in the next
four years to grasp 10.3m TEUs in 2017. However, without meaningful investments in
port capacity expansion as well as an improvement of its infrastructure, it is tough to see
how Tanjung Priok could manage such an expansion (Oxford Business, 2014).
The Indonesian government does realize this condition and trying to build more port
infrastructures. Through the Master Plan for Acceleration and Expansion of Indonesia's
Economic Development Program, the Government of Indonesia has shown its
appreciation of the need investment in the improvement of the logistics system. The
investment's focus is not just on hard infrastructure, but also the so-called soft
infrastructure; more conducive regulations to expedite trade and transport (Bahagia,
4
Nevertheless, building infrastructure requires enormous investment and lengthy periods
of time. On the other side, problems arise every day, opportunities and competitions are
continuing. Waiting for improvement or development of new infrastructures definitely
will cost more complaints and loss of opportunity. Limitation of capacity is forcing
terminal to optimize their existing resources to dealing with trade growth. Therefore,
some additional initiatives and strategies are formulated to adapt to the challenges.
Planning is the key point in the optimization process. Terminal container manager
should plan the operation thoroughly and prevent any idle on facilities and equipment.
An hourly basis operation planning will help terminal to mitigate a big deviation in
operational level. A Continues monitoring and evaluation are required to make sure the
facilities and equipment are working effectively and efficiently.
Container terminal operation consists of three main components, quay, yard and gate
operation, a good operation planning should integrate all area of operation. To plan quay
operation is relatively easy as quay operation serves the container vessels with fixed and
regular schedules. Nevertheless, to plan yard operation is more complex as yard
operation serves quay and gate operation simultaneously. The complexities of yard
operation even more when the arrivals of external trucks at the gate are unscheduled.
Unscheduled time of arrival of the truck create uncertainty in terminal operation. To
solve the problem some terminals regulate the arrival of the trucks by providing
particular service window time where the number and time of truck arrivals are planned.
Before the truck visit the terminal, truck should book the terminal service through a
system, known as Terminal Appointment System (TAS), by informing their arrival plan
to terminal. By having this information, terminal can plan their equipment and other
5
1.2. Objectives
Following the background information mentioned above, the dissertation seeks to
explain optimization strategies in container terminal dealing with yard capacity
limitation. The discussion is focused to gate operation management in controlling the
truck arrival through the implementation of Terminal Appointment System (TAS).
Therefore, this dissertation will cover the following topics:
• The general concept of operations in a container terminal through a literature
review. The discussion will incorporate the basic concept, challenges, and
operational strategies in the optimization process.
• Introducing TAS by reviewing academic literature and business practices
covering general references to technical aspects of implementing truck arrival
management, covering procedures, equipment, and system requirement
• Problem identification in a container terminal dealing with capacity
limitation.
• Data from Jakarta International Container Terminal (JICT) are used as a
study case.
• Measuring the impact of unscheduled truck arrival to the truck queue.
• Evaluating on a TAS solution in above problem.
The dissertation contributes to the current knowledge base of container terminal
operations management and help container managers in their daily operations in the
planning process.
1.3. Scope of Work and Methodology
Optimization is a daily and continuous objective in container terminal operations.
Managers are required to control and monitor the progress of operations highly
optimized. Therefore, a simple and practical approach to analyzing the situation is
required to formulate an operational decision that is easy to follow and easy to
6
Therefore, this dissertation will use a quantitative method to analyze the data and
identify the operational problems and their impacts, and to provide an optimization
solution. The data derives from historical data equipment transaction of JICT. It
comprises of quay cranes (QC), Rubber Tired Gantry Crane (RTGC), Reach Stacker
(RS), and gate transaction is from January 2013-June 2013. Researcher
Furthermore, the MS Excel will be used, to process the data by implementing the
quantitative methodology. Linear Programing (LP) will help to identify the optimum
capacity of the terminal equipment by involving the linear optimization of a linear
objective function, subject to linear equality and inequality constraints. Fluid
Approximation (FA) model illustrates the situation of the terminal in serving the truck
by considering truck queues as a fluid flowing into a reservoir, which represents the
ability of terminal in handling the trucks. FA model estimates the number of the truck
line through a single nonlinear differential.
To support the implementation of solution, researcher provides general guidance and
technical aspect related to TAS. The technical aspect derives from the best practice of
some terminals that are implementing TAS, such as Long Beach Container Terminal,
Sydney Container Terminal, and Hong Kong International Container Terminal.
1.4. Structure and organization
The structure of dissertation comprises of six chapters with the following order:
Chapter I presents the background and main objective of the thesis by briefly
describing its overall concept and methodology.
Chapter II evaluates some literature related to the general concept of container terminal
7
covering quay, yard, and gate operation. Introduce TAS as a strategy to manage the
container terminal workload.
Chapter III identifies a problem in optimizing container terminal operation by
evaluating the three components of operation. BCG matrix model will be used to define
the problem and case study of JICT will be presented for further discussion.
Chapter IV analyzes the problem and measures the impact on terminal service without
implementation of TAS. A simple linear programming will identify the optimum
operational limit. Furthermore, the queuing theory will simulate existing operational
problem resulted by exceeding the operational optimum limit.
Chapter V evaluates the TAS solution in solving the problem. The queuing simulation
will be repeated with TAS implementation scenario. Furthermore, the result of the new
simulation will be compared with the previous simulation to evaluate the effectiveness
of TAS solution.
Chapter VI concludes by summarizing the impact of unscheduled truck arrival. Also,
propose the implementation of TAS as the solution to optimize the existing
infrastructure.
8
CHAPTER 2. LITERATURE REVIEW
2.1. Introduction
Optimization is a central topic in container terminal operations. Limitation of resources
such as land, facilities, equipment, manning, and financing are the driver factors of a
container terminal in pursuing the most optimum and efficient operations. Moreover,
competition among container port for better and cheaper customer services leave
terminal operations no option but optimizing their service.
There are several approaches in optimizing container terminal operations. Some
approaches are from an engineering aspect and some other from an operational aspect.
Engineering perspectives try to optimize the terminal operations by improving the
quality of materials, design, information and technology of the equipment. The other
approach focuses on how to utilize equipment and facilities to gain an optimum
operational result. This literature review will only discuss the research related to the
operational strategy by identifying some optimization tactics and considering the impact
to Key Performance Indicators (KPI) of each part of operations.
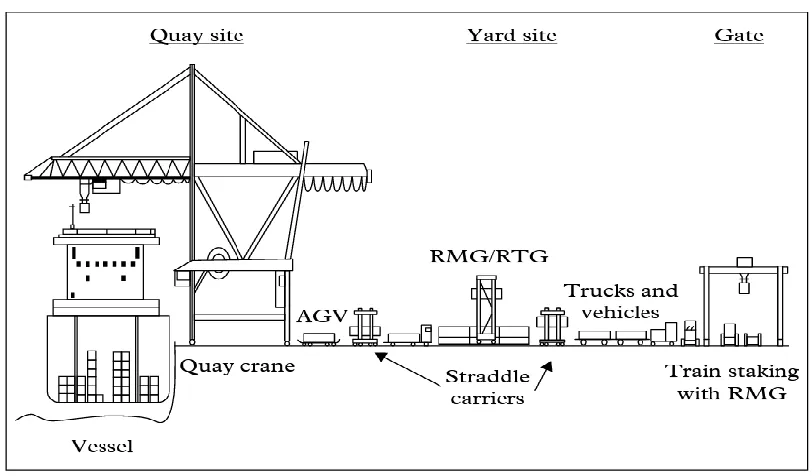
As shown in Figure 1, the process of import container movement starts from the
discharging activity of a vessel by quay crane at Quay site. Then the transfer is taking
place to transporter equipment, such as Automated Guided Vehicles (AGV), straddle
carrier, and trucks to the yard for temporary storage. Finally, containers are moved to a
gate area to be loaded by Rail Mounted Gantry (RMG) onto train or trucks for the
further delivery process to customers. The process is the opposite for the export
container (Bichou, 2014, p. 137).
Three groups of operation work as a system in high dependency. A good terminal
operation performance will only possible when all components work collectively and
9
achieve their individual KPI to improve the KPI of the whole operation. The quay
operation KPI depends on backing from yard operation. At the same time yard operation
depends on the support of the gate service.
Figure 1 Container Terminal Operation Process (Bichou, 2014, p. 137)
It is critical to optimize the individual performance of each part of the operation to
achieve an integrated performance of the whole system. Nevertheless, focusing KPI to
only one part of the system may lead to imbalance workload at the other parts, and
consequently the entire system will work under optimum level. Therefore, the
optimization process has to be integrated to avoid sub-optimization in a particular area
(Böse, 2011, p. 91)
2.2. Quay Operation
Quay operations are activities on quayside area where terminal performs discharge and
loading containers from and onto the vessel. In a modern container terminal discharge
and loading are performed by Quay Cranes (QC). However in an exceptional case the
10
cranes, ships cranes or other mobile cranes. Usually, additional equipment only handles
special cargo such as over dimension cargo, or overweight cargo that is the weight
beyond terminal crane capacity. This thesis will only measure the performance of QC as
a main KPI of quay operation.
The main KPI of quay operations is QC rate. It represents the capability of a terminal in
handling container to serve shipping company, as their primary customer. Container
terminal puts a high priority in pursuing a higher QC rate. It does not merely reflect the
efficiency of terminal operation, better service to clients, but also a prestige in
completion among container terminals.
QC rate calculates the average performance per hour of a QC in handling containers in a
full cycle. The QC cycle has three steps, firstly lift on or lift-off container on the vessel,
the subsequent transfer to pier side, and finally lift on or lift-off container on transfer
vehicle/truck. Technically performance of QC could reach 50-60 boxes/hour,
nevertheless, in operational the average performance is 22-30 boxes/h (Günther and
Kim, 2005, p. 8).
There is a gap 50% between average functional and technical specification of cranes.
Researchers have been trying to apply the various methodologies to improve the
performance of QC. The objective of the thesis is to upgrade crane productivity closer to
its maximum capacity. There are two well-known strategies to improve QC
performance, namely dual cycle and truck pooling.
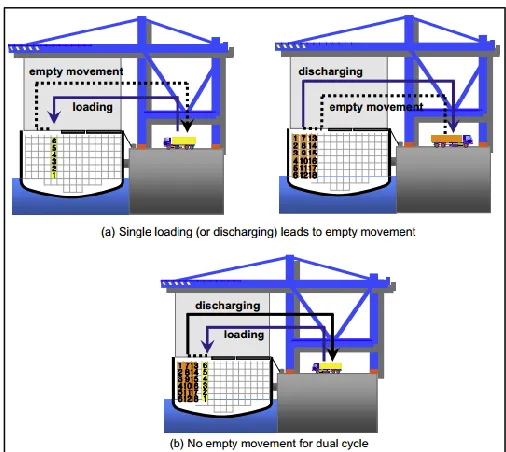
Crane Dual Cycle
Double cycling is the method of using these “empty” moves to carry a container, thus
causing the crane more productive, and reducing turn-around time. When discharging
11
During unloading, the crane is empty when running to the vessel. During loading, the
crane is empty when returning to the dock (Goodchild and Daganzo, 2006, p. 473)
As illustrated in Figure 2(a), one cycle crane operation produces single loading or single
discharge for each movement (Zhang and Kim, 2009, p. 980). Since there is an empty
movement in every cycle, crane should perform two set of the cycle to handle two
containers. Assuming one cycle is 5 minutes, it takes 10 minutes to handle two
containers. In the Figure 2(b), the dual cycle crane does not have an empty movement.
Crane transfer is loading-container while traveling to the vessel, subsequently carrying
discharging-container when returning to the quay deck. With the same assumption
previously, the crane will be able to handle two containers within one cycle and only
takes 5 minutes of the time.
Figure 2 Comparing the Single Cycle and Dual Cycle QC Movement
12
Goodchild and Daganzo (2006, p. 476) explain that while the dual cycle is appropriate
for handling containers in the same row on the ship, nevertheless it is not practical for
handling containers in different rows. The reason is that since cranes should move
laterally between rows hence it consumes additional time. Furthermore, the dual cycle
involves substantial operation planning of discharge and loading simultaneously,
therefore, requiring truck scheduling to make sure double cycle run smoothly.
Transporter Pooling
Almost similar to dual crane cycle, transporter pooling aims to allow carriers (trucks/
AGVs) gain two containers in one cycle. In the single-cycle mode, the vehicles
dedicated serve only one crane. According to the crane's cycle, they either serve for
discharged containers from the quay to the yard or export containers from the yard to the
crane (Günther, 2005, p. 26).
In pooling mode, the transport vehicles serve several cranes that are in the loading or
unloading process. After the transporter delivers the export container from the yard to
the vessel, it does not return to the yard directly without carrying the container. Instead,
they pick up another import container from another crane that discharges the import
container. Transporter pooling optimizes both transport vehicles and also optimizes
cranes. Transporters have an opportunity to carry containers during their travel going
and back to pier side while cranes have a larger number of transport vehicles supporting
its discharge or loading operation. Pooling mode makes transporter assignment more
flexible and dynamic, hence reducing the risk of idle time.
2.3. Yard Operation
Container yard occupies the largest area of the terminal. In general, a container yard
typically takes up about 60–70% of the total terminal area. It is primarily used to stack
13
consignee for container import (Lun, Lai, and Cheng, 2010, p. 184). The container yard
is the most complex part of a container terminal. Yard operation serves the quay
operation by receiving import containers and delivering export containers. At the same
time yard serving gate operation by receiving export containers and delivering import
containers. Also, yard operation performs additional movements inside, such as
marshaling and shuffling.
Marshaling
Marshaling mainly is performed for internal needs of the terminal, as part of yard
management strategy to improve operational efficiency. Marshaling activity relocates
container from one block location to block further position in the same yard. Yu, Cheng,
and Ting (2009, p. 2934) explain that there are two stages in the planning of the
marshaling operation. Firstly, determining the optimal storage space for containers and
secondly, optimizing the container moving plan. The objective to determine optimal
storage space is to consolidate containers with the same destination from the scattered
yard locations. Yard planning process will be easier when the containers are stacked
according to the same category. Grouping also prevents yard cranes from moving too
often between blocks during serving for the loading operation.
The second stage is optimizing the container moving plan. Furthermore, marshaling
stage relocates containers, according to the next moving plan. The moving plan consists
of the sequence of containers to be moved (in loading plan). Subsequently the containers
are transferred and stacked in the opposite sequence of the loading plan. This stage of
marshaling could significantly reduce shuffling during the loading operation.
Shuffling
Shuffling is relocating container within the same slot to collect the required container
14
container is under other containers. Shuffle in loading operation is caused by different
loading sequence with stacking sequence. Shuffle in import delivery process is
inevitable since terminal applies First Come-First Service. Hence, the delivery sequence
is not following stacking sequence.
A container terminal with a local shipment for export loading and import delivery has a
higher ratio of shuffling movement. In contrary, a container terminal with majority
transshipment will have a little part of the shuffling activity since most of the
transshipment containers have been planned prior discharge and loading. During
discharge operations, transshipment containers will be stacked according to the sequence
of the next loading operation. Hence shuffling will be less.
The shuffling movement also depends on yard density, or Yard Occupancy Ratio
(YOR). YOR is the ratio between the numbers of TEUs of the container stacked in the
yard over total TEUs of yard capacity of a terminal. In a high YOR situation, terminal
stack containers in an upper tier (five up to six tiers containers in a slot) to maximize
yard space. It increases the probability of shuffling since more containers may stay on
top of the required container.
The number of shuffle moves that need to be performed by the yard equipment is
supposed to be important in influencing yard productivity. Also, it reduces truck waiting
times at the waterside and landside interfaces of the container yard. Container terminals
consider shuffle as unproductive movements. Therefore, minimizing the number of
shuffle moves could improve yard operation productivity. Finally, the accessibility of
containers in the storage yard is defined by the average number of shuffle moves
required to make a particular container available to take it out of the stack. This indicator
is of great importance for the annual handling capacity of a container terminal. Fewer
15
2.4. Gate Operation
Gate operation deals with outward freight forwarders. Two activities are engaged,
namely export delivery and import receiving. Export delivery, where the freight
forwarders bring in the containers to the yard to be loaded onto the vessel. Import
receiving activity is where the freight forwarders receive containers from the yard or
wharf and bring them to cargo owner (Esmer, 2008, p. 245).
Böse (2011, p. 315) explain the general process at the gate. Acting as a reception and
delivery facility for the terminal, gate operation ensures every container and every truck
enter and out terminal are validated and in a suitable order. Legality is the priority for
the gate operation. Therefore, gate operation performs a set of checking before trucker in
and out of the terminal. As seen in Figure 3, it starts with a pre-notice: (1) via Electronic
Data Interchange (EDI). When the truck arrives at the terminal (2), it has to stop at a
parking area outside the gate.
The driver has to get out for a personal check-in (3) for authorization and security
purposes. The truck moves on to the in-gate after having registered at the interchange for
the physical container check (4). The inspection validates the container and the seal
number, the general condition, as well as any safety and security issues. If the vehicle
does not bring any container, the driver could enter (5) the terminal without any further
physical checking procedure. It takes sometimes to perform validation and inspection
process. Therefore gate operations KPI measures the time spent by a truck at the gate
before proceeding to the yard area. Gate with the manual method, involves paper
16
Figure 3 General Process of Truck Handling (Böse, 2011, p. 316)
Arriving at the handling area of the terminal, the inbound container has to be unloaded
(6) before an outbound box could be taken (7). Then, customs checks (8) may be
necessary at the terminal. Finally, a physical inspection (9) has to be carried out at the
gate before the truck is allowed to leave the terminal (10) with a container. If the vehicle
wants to depart without any cargo, no extra checking procedures are needed.
Dougherty (2010, p. 11) stated efficient gate operations are crucial to intermodal freight
terminals. Their impact broadly influences the efficiency of the operations within the
terminal and also extends to the road traffic on nearby freeways and access ramps. Too
many trucks inside the terminal will create long queues inside the terminal and may
disturb the operation. At the same time, too many trucks waiting outside the terminal
will block the access road and trouble in the movement of public transportation. A
precise measurement is necessary to keep the traffic at the optimum level, both in the
17
Container terminal undertakes different operational strategies in managing gate
operations. Some focus on traffic design, gate layout and the other focuses on traffic
controlling. One of the most well-known studies is a procedure to handle the arrival of
trucks through Terminal Appointment System (Merk, 2013, p. 141). Some research in
the literature uses different terms for the same solution. Hayden and Brien (2008) use
term Gate Appointment System (GAS) while Song (2012) uses Booking System (BS),
Davies (2009) calls Vehicle Booking Systems (VBS) and Ltée., Conseil, and
Consultants Ltd (2006) use (TAS) Terminal Appointment System. All term refers to the
same system that regulates the arrival of the truck. In this thesis, (TAS) Terminal
Appointment System is used to emphasize that this system is beneficial not only for gate
operation but also for the whole terminal operations.
2.4. Terminal Appointment System (TAS)
Apart from the different literature regarding TAS, container terminals also use a
different name for the system. Table 1 shows container terminal or port that has been
implementing TAS with a different name.
No Container Terminal Name Country System Name
1 Port of Los Angeles/Long Beach USA Appointment System
2 Sydney International Container Terminals Australia Truck Appointment System
3 Haropa Port France Terminal Appointment System
4 Manila International Container Terminal Philippine Vehicle booking system (VBS)
5 Hong Kong International Terminals China Tractor Appointment System
6 PSA Antwerp Terminals Belgium Truck Appointment Management System
7 Port Metro Vancouver Canada Smart Fleet Trucking
18
Even though terminal containers call the system differently, yet those systems have
similar principle features. The principle features that exist in TAS can be summarized as
follows (Terminal, 2005):
1. Setting for gate quota
2. Booking time slot
3. Registration for container and truck
4. Gate validation
5. Administration
TAS has a feature for setting the quota of gate transaction that limits the number of
containers to be booked for receiving or delivery in every period of gate service. The
period of service could be divided by the hour, day shift or by day depend on the needs
of the container terminal. The terminal also could modify the quota setting when
required to improve the equipment optimization.
Subsequently, based on the gate quota set by the terminal, the trucks make an
appointment through the Booking Time Slot feature by selecting the available gate
service time according to the plan of receiving and delivery. The trucker should choose
the other time slot if the quota in the designated time is fully booked. The Booking Time
Slot also provides functions for amending and canceling the booking.
Furthermore, the trucker has to register the container number and the truck before
arriving at the terminal. The registration is important for validation process when the
truck arrived at the terminal. The validation process is performed before gate transaction
by checking the physical data against the terminal data. Validation aims for security
purposes and prevents the truck gate in without an appointment. For a truck that pass
validation process could proceed for gate transaction. Meanwhile, for the truck with
19
The last feature is administration. Administration feature provides a function for
security, financial and reporting. The identity of the container owner, the truck company,
and the truck drivers should be validated and recorded properly, to avoid any legal issue
in the transaction. Administration feature also covers function for finance settlement
between terminal and container owner, such as terminal handling charge, storage, and
penalty.
Furthermore, the reporting function consists of detail information of the transaction,
tracing and tracking the container movement. Based on the report, the terminal could
perform controlling, monitoring and evaluation of TAS for further adjustment of gate
quota. The report is also required to evaluate the terminal service performance against
the service agreement made with truck companies.
Apart from the principle features, each terminal has their unique characteristics which
applicable only in their business process and terminal environment. Take an example in
the ports of Los Angeles and Long Beach that offers incentives to the truckers to use
off-peak hours. The ports also charge a Traffic Mitigation Fee (TMF) for transactions made
during peak hours. The program was successful in redistributing the arrival times of
trucks to port terminals throughout the day. Nevertheless, the similar program were not
considered to be a success when it was implemented in Port of New York/New Jersey
(Merk and Notteboom, 2015, p. 12).
Another unique characteristic of TAS is related to the regulation of penalty that has to be
paid by the terminal to the trucker. Port Botany, Australia regulate that terminal should
pay a penalty if the truck total turnaround time greater than 50 minutes (single
20
Canada regulates penalty to be paid by the terminal operators to the truck carrier for total
turn times exceeding 2 hours is CDN$30 (Davies, 2013, p. 11).
Most of the unique characteristic in TAS implementation is related to policy and
regulation. The reason is that every port is unique hence the regulation of TAS embraces
the uniqueness of the port. The regulation also should fit with the requirement of
terminal stakeholders. Terminal operator, freight forwarders, the truck companies and
local government should formulate TAS regulation based on principles of collaboration,
respect, engagement, fairness, transparency, accountability, and long-term sustainability
(Vancouver, 2013).
The implementation of TAS involves different parties from various companies and also
involves some procedures and regulations. Considering its complexity, the needs for
reliable information and communications technology (ICT) system is inevitable. The
ICT system makes the transaction process simple, user-friendly, real time, and
transparent. Thus, the parties involved could communicate smoothly, and the process of
controlling and monitoring could be performed efficiently and effectively. For a success
TAS implementation, at least two type of ICT system are required, Terminal Operation
Systems (TOS) and Radio Frequency Identification Device (RFID) system.
TOS is a main system of the container terminal operation. It controls the movement of
container and equipment in gate operation, yard operation, and quay operation. The
system also enables internal terminal operation communicate with other systems. In
relation with TAS, TOS act as an internal server while TAS acts as an external server.
Both systems communicate through Electronic Data Interchange (EDI). TOS transmits
21
RFID wirelessly transmits object identity and location by radio waves. TAS uses the
technology in the process of Gate Validation. With RFID technology, the trucks could
be validated without stopping. At the time a truck passing RFID reader, the information
will be transfer to TAS system and instantly validated whether the truck is eligible to
gate in or not. An eligible truck could proceed to gate in while ineligible truck will be
ordered to the parking lot to fix the problem.
The implementation of TAS is indeed challenging and costly for a container terminal.
Nevertheless, it has been proved by many container terminals could optimize terminal
equipment and improve the quality of service. Referring to from Philip Davies, (2013)
about cost/benefits analysis of Port Botany Australia in 2012, the implementation of
TAS resulted in the following improvements in efficiency in the first 12 months of
operation:
• Reduction in TRT of 30%.
• Increase functionality of trucks arrival time from 72% to 95%. • Significant reduction in congestion during peak periods. • Greater uniformity in slot availability across the week.
Unquantified benefits included:
• Safety, environmental, and economic benefits of reduced congestion around
Port Botany.
• Benefits to importers and exporters of increased consistency of truck
deliveries, and almost complete elimination of demurrage payments.
• Benefits from delay of infrastructure investments.
22
CHAPTER 3. PROBLEM IDENTIFICATION
3.1. Introduction
All operation strategy in every part of container operation should be managed to achieve
an integrated performance for the whole system. Focusing the strategy only in one part
of the system may lead to imbalance workload among the operational components . The
nature of a terminal in prioritizing quay operation often creates imbalance workload in
yard or gate operation. Therefore, optimization process should be performed in a whole
system perspective to avoid sub-optimization condition in a particular area (Böse, 2011,
p. 91).
Sub-optimization occurs when one area is optimized without considering the impact on
the whole system. Consequently, it creates a productivity gap among the operation area.
Some areas with high optimization produce more and faster service while un-optimized
areas provide less and slower service. The un-optimized areas will turn into critical
points or bottlenecks whereby their capacity and performance is a binding constraint on
the performance of another site. Eventually, it impacts the aggregate efficiency of the
whole system.
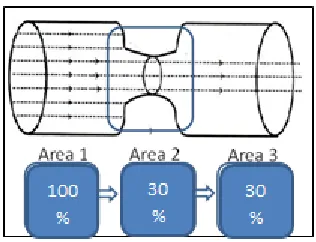
Figure 4 illustrates the effect of sub-optimization in a system. Area 1 could reach 100%
optimization, by utilizing the whole capacity. When the flow reaches Area 2, the
optimization drops to 30%. Subsequently, 70% of the stream is blocked and build queue
in Area 1. Only 30% released from Area 2 as input for Area 3. Eventually, Area 3 only
produces 30% of output and leave 70% unused.
23
Figure 4 Bottleneck Illustration
The above situation happens in a container terminal with sub-optimization condition.
The terminal operation may not be able to produce maximum output due to the existence
of a bottleneck component. As container terminal comprises of three groups of
operation, the bottleneck may be located at quay operation, at yard operation or gate
operation.
The bottleneck of operation mainly derives from the lack of capacity and
mismanagement. Lack of capacity indicates that the infrastructure is no longer sufficient
to support an effective and efficient operation. There is not enough room for the
operation to increase the volume and quality of services, unless by adding the new
facility.
Apart from lack of capacity, mismanagement also leads to bottleneck. Mismanagement
correspondences to ineffective operating method of the equipment. Hence the equipment
unable to reach its maximum performance is expected. The existence of the waste
product, idle capacity, idle equipment in the middle of high workload environment are
24
Identification of the bottleneck allows terminal managers to take the right solution and
the right measured action to improve the operation performance. In contrary, fail in
identification of the bottleneck may lead to the wrong decision and eventually not solve
the real problem. In above sample, the bottleneck is assumed located in area 2, a
terminal manager should focus in improving the capacity of area 2 to improve the
capacity of the whole system. Improving area 2 will automatically improve the capacity
of area 3. Nevertheless, if a terminal manager focus in improving the capacity of area 3,
then the capacity will never improve. No matter the size of area 3, it will not increase the
capacity of the system as the whole system capacity is limited by area 2 as the
bottleneck.
Identification a bottleneck in a container terminal operation is more complex than above
illustration. Even though terminal operations can be simplified by grouping into three
group of operation (quay, yard and gate operation), nevertheless there are some factors
inside each group to be analyzed. The bottleneck factor may be sourced from facility,
equipment, human resources, system, technology, management. A thorough analysis is
required to identify the source of the problem.
3.2. Problem Identification by BCG Matrix Model
There are several methods for evaluation and analysis the bottleneck, the most cited of
which is the Business-Consulting Group (BCG) matrix, also called the growth-share
matrix. The BCG methodology consolidates the measurement of actual industry market
share for each of the firm's Strategic Business Units (SBUs) with related growth rates by
classifying four distinct market positions.
The BCG matrix also could be used to evaluate the optimization of container terminal
operation. In a container terminal operation context, growth is translated into equipment
25
could be conceived as operational units, such as quay operation, yard operation, and gate
operation.
Through the BCG matrix, operation units will be mapped to identify the bottleneck in
the operational of the container terminal. The indicators of bottleneck unit are having the
smallest reserved capacity and the lowest reserved productivity among the component.
A reserved value indicates the saturation or density of workload in the unit. High
reserved values mean that the units still have room to accommodate more workload. In
contrary, a unit cannot afford additional workload if the unit has low reserved values.
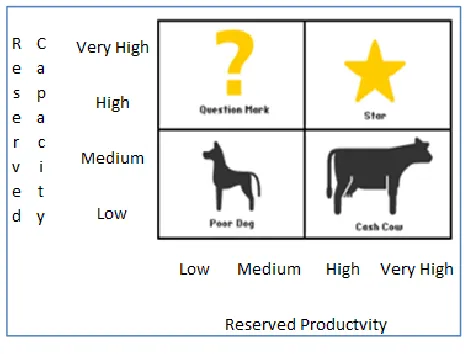
Furthermore, the BCG matrix categorizes the operational unit into four ranges namely
Cash Cow, Dog, Question mark and Star. The Cash Cow is where the operational unit
has high reserved capacity with low reserved productivity. Star is a unit with a high
reserve capacity in a high reserved productivity. A question mark is an operational unit
with a high reserved productivity, but having a low reserved capacity. Moreover, Poor
Dog is the unit with low reserved capacity with low reserved productivity. The Poor Dog
represents saturated component in BCG matrix. Hence, it becomes a bottleneck for the
whole.
The first step in building BCG matrix is choosing the unit of measurement. In this case,
the units are quay operation, yard operation, and gate operation. Each unit will be
evaluated from two areas of analysis, infrastructure capacity and equipment
productivity. The second step is measuring the reserved capacity of infrastructure and
reserved productivity of the equipment. The reserved value derives from the gap value
between the maximum value and operational value. The maximum value is the highest
capacity and the maximum productivity that possible to be provided by the operational
unit. The operational value derives from the average capacity and productivity
26
Reserved Capacity = 100% – Occupancy Ratio
Reserved Productivity = Maximum Productivity – Operational Productivity Maximum Productivity
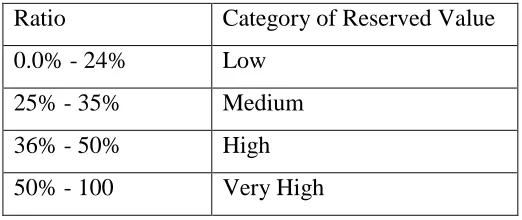
The third step is categorizing the reserved value into Low, Medium, High and Very
High. Referring to OECD (2014), industry intelligence shows that the optimum
percentage for a terminal to work at maximum efficiency is in the range 65% to 75%.
Hence, the gap between 25%-35% is categorized as High.
Table 2 displays the categories of reserved value for the capacity and productivity. The
categories are based on researcher assumption that indicates the availability of a room
for further improvement in providing capacity and productivity. Low category means
that there is hardly room available for improvement. Medium Category is an indicator of
possibility to improve with medium effort. High and very high represent that capacity
and productivity have a big portion unutilized.
Table 2 Category of Reserved Value
The last step is placing the operational units into the matrix according to ratio category.
The matrix is shaped in one large square and is divided into four equal quadrants. Along
the bottom of the box, the reserved productivity is written, and the reserved capacity is
Ratio Category of Reserved Value
0.0% - 24% Low
25% - 35% Medium
36% - 50% High
27
written on the left side. On the bottom left are low reserved capacity and low reserved
productivity. On the right-hand side, high reserved productivity is at the top, and high
reserve capacity is at the bottom.
Figure 5 BCG Matrix Model
3.3. Case Study: Jakarta International Container Terminal (JICT)
To apply the analytical methodology, a case study of Jakarta International Container
Terminal (JICT) will be presented. JICT is located in Tanjung Priok Port, Jakarta,
Indonesia. Over two-thirds of Indonesia‟s International trade is shipped through the
Tanjung Priok Port. In 2013, container traffic in Tanjung Priok was recorded 6.2 Million
TEUs, which equal to 57% of total national container throughput 10,790,450 TEUs
28
Figure 6 Industrial Hinterland of Tanjung Priok Port
Figure 6 shows that container traffic of Tanjung Priok port derived from the city and
industrial area around the port. As illustrated in figure 6, the majority of container traffic
is generated by industrial activities around the port. The biggest traffic volume comes
from the industrial area on the east side which account for 62% while the other industrial
zones in south and west contribute 18% and 14% respectively. Jakarta as the city
generates 6% of the traffic. Categorized as one of the densest city in the world, Jakarta
gives a substantial contribution to the growth of Tanjung Priok Port.
Together with container traffic contribution from the other industrial area, Tanjung Priok
Port is visited by more than 16,000 TEUs containers per day. The container traffic is
distributed to three container terminals inside the port i.e. Terminals 009, KOJA
Terminal, and JICT. Terminals 009 comprises of several small terminal operators inside,
in total handled 2.9 million while the other single operator terminals, KOJA and JICT
29
JICT is the biggest single operator terminal in Tanjung Priok Port. It covers 39% of total
container traffic of the port. JICT has two terminals, Terminal 1 Terminal (JICT-T1),
and Terminal 2 (JICT-T2). Terminal 1 is the main terminal, with superior facility and
equipment, while Terminal 2 is hardly operated due to the limitation of water draft and
equipment. Therefore, this paper will associate all discussion about JICT with operation
in JICT-T1 only.
JICT-T1 has 1640 meters length of the berth, with draft 11-14 meters. The quay deck is
L-shaped, comprises of The West berth 900 meters length and north berth 740 meters
length. Each berth is equipped with eight cranes with Berth Occupancy Ratio (BOR)
was 52%. JCT-T1 container yard covers 45.54 Ha, with total ground slot 1720 unit and
average Yard Occupancy Ratio (YOR) was 85%. JICT-T1 also equipped with five
entrance lanes, five exit lanes and parking lot with capacity for 400 trucks with average
parking utilization (POR) 45%.
1. QC (Quay Crane)
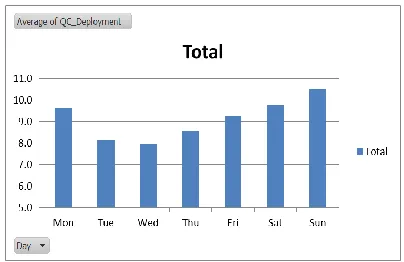
As per record in 2013, JICT-T1 had 16 units of QCs. Nevertheless, maximum
deployment of QC in a day was recorded 14 and 15 units (Figure 7). The average
number of QC deployment in hourly basis was relatively stable extends from 8 units to
30
Figure 1 Max. Deployment: unit/day Figure 2 Avg. Deployment: unit/hour
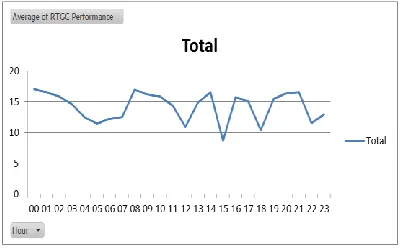
Figure 3 Avg. Performance: Box/hour
While QC deployment had a steady pattern, QC productivity in hourly basis had a bigger
fluctuation extend from 12 to 25 moves per hour with average 19.8 moves per hour. QCs
Productivity fluctuated in every hour; the lowest level was reached at shift change at
07:00,15:00 and 23:00. The productivity increased up to the middle of the shift and
turned declining until the next shift change (Figure 9).
2. Rubber Tired Gantry Crane (RTGC)
Total number of RTGC of JICT-T1 in 2013 was 63 units. Nevertheless, according to the
record, maximum daily deployment was only 45 units while the average daily average
31
mechanical problem. RTGC performance in hourly basis fluctuated at range 8 to 16
moves/ hour with average 14.2 moves per hour (Figure 12). Similar with QC
performance, RTGC performance declined in shift change time and increased up to mid
of shift.
Figure 10 Max. Deployment: unit/day Figure 11 Avg. Deployment: unit/hour
Figure 12 Avg. Performance: Box/hour
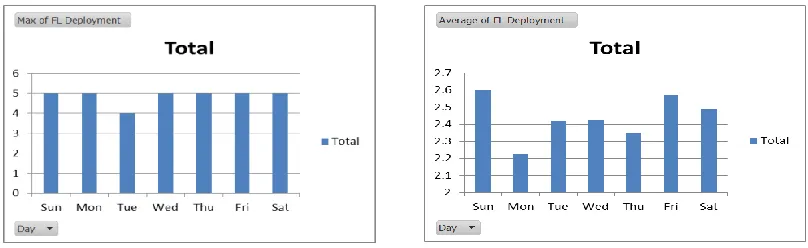
3. Front Loader FL / Reach Stacker RS
Apart from RTGC, JICT deployed Front Loader to support yard operation. FL
deployment mainly was allocated to serve empty container and special containers, such
as over dimension, flat rack, and un-containerized cargo. From total 6 unit reach
stackers, maximum daily deployment was 5 (Figure 13) and average deployment was
32
Figure 13 Max. Deployment: unit/day Figure 44 Avg. Deployment: unit/hour
Figure 15 Avg. Performance: Box/hour
Reach stacker had similar function and same performance as RTGC, with 13.9 moves/
hour. Using the same performance benchmark as RTGC (15 moves/hour), the
productivity of RS was 93% similar operation pattern as RTGC (Figure15).
4. Gate
JICT-T1 had five entrances for the gate in and five exits. The gates were equipped with
an auto gate system that could handle 8000 transactions/day or in average 333
transactions/hour (Figure 16). Nevertheless the average transaction per day was the only
4383/day, with the lowest number of the transaction was 2504/day and the highest was
5620 transaction/day (Figure 17). In hourly basis, gate transaction fluctuated in the same
pattern as QC and RTGC, with the average transaction was 182.6 transactions per hour
33
Figure 16 Max. Deployment: unit/day Figure 17 Avg. Deployment: unit/hour
Figure 18 Avg. Performance: Box/hour
Evaluation of BCG Matrix
From above facilities and equipment information, a BCG matrix could be developed to
identify the bottleneck of the JICT operation.
Table 3 Infrastructure Capacity Mapping
Quay 52% 48% High
Yard 85% 15% LOW
Gate 45% 55% HIGH
Infrastructure Capacity
34
Table 4 Equipment Productivity Mapping
R
ESER
VED
C
APAC
IT
Y
Very
High Gate
High Quay
Medium
Low Yard
Low Medium High Very High
RESERVED PRODUCTIVITY
Figure 19 BCG Matrix Mapping
The BCG matrix shows that yard operation has the low reserve capacity. The reserved
capacity indicates that yard operation environment has been saturated. Yard operation
has the small possibility to increase the capacity as current yard density has been so
high. The limitation capacity in the yard also becomes a limit for quay and yard
operation. Even though the reserved capacity of quay and gate are still high, but their
free capacity could not be utilized.
Quay 375 180 52% High
Yard 735 674 8% LOW
Gate 333 183 45% HIGH Equipment Productivity
35
Apart from the limitation of reserved capacity, yard operation also has low reserved
productivity. It means yard operation productivity is reaching to the maximum limit.
Hence the opportunity to improve the performance of yard operation is minuscule.
Similar with the limitation of capacity, limitation of performance also limit quay and
gate operation. Both quay and gate operation should maintain their productivity to fit
with yard operation productivity.
The above indications conclude that yard operation is the bottleneck of the system.
Nevertheless, the BCG matrix model only provides an initial indication of a problem. It
does not give detailed information on the reasons behind the problem. Therefore, further
analysis of yard operation as the bottleneck of the operation is required to get better
understanding of the root of the problem. Further analysis will be discussed in the next
chapter.
36
CHAPTER 4. PROBLEM ANALYSIS
4.1. Yard Operation Productivity
In line with the objective of this dissertation to optimize the existing container terminal
equipment, this chapter will analyze the problem related to the equipment. Even though
yard operation has been indicated as the bottleneck by having capacity limitation and
productivity limitation, nevertheless, this chapter will investigate the yard productivity
limitation that related to equipment utilization.
Yard productivity is highly relevant to the number of equipment and performance of the
equipment. The productivity will increase along with the rise in the number of
equipment and or the improvement of equipment performance. Yard Productivity is
measured in Box Container per Hour (BCH). BCH is derived from some container
movement (Cm) that could be handled by equipment deployed (Ed) in one hour.
To be able to understand the relationship between Cm and Ed, a simple linear regression
is run. Simple linear regression analysis finds a straight-line equation between the values
of two numeric-random variables only. The one variable is called the independent or
predictor variable, x, and the other is termed the dependent or response variable, y.
Independent variable (x) The independent variable is represented by the symbol x. It is
the variable influencing the outcome of the other variable (Wegner, 2012. p. 408).
In this case, y variable is represented by the average of container movement (Cm) while
y is presented by the mean number of yard equipment deployment (Ed). Furthermore,
the simple linear regression is visualized through a scatter graph as presented in Figure
37
Figure 20 Scatter Graph of Relationship Between Cm and Ed
Table 5 Summary Output of Regression
The scatter graph display relationship between Cm and Ed. The regression value, y =
32.774x - 707.15, shows a positive correlation between two factors. When Cm increases, SUMMARY OUTPUT
Regression Statistics
Multiple R 0.81
R Square 0.65
Adjusted R Square 0.65
Standard Error 77.74
Observations 175.00
ANOVA
df SS MS F Significance F
Regression 1.00 1,945,345.00 1,945,345.00 321.89 0.00 Residual 173.00 1,045,516.75 6,043.45
Total 174.00 2,990,861.76
Coefficients Standard Error t Stat P-value Lower 95% Upper 95%
38
Ed will increase. The value of R2 is = 0.6504 indicates that 65% of Cm could be explained by Ed. Furthermore, Table 5 displays that the regression has estimated the
coefficient of t-stats 7.25 which correspondence to p-values 0.00. It reflects a high
confidentiality level of the regression that is greater than 95%.
Figure 21 Histogram-Normality Test
39
Further test by using EViews software, the diagnostic shows that the data in this analysis
is desirable statistically. The Residual Diagnostic results in Figure 21 display the
histogram of Normality test. The value of normality tests shows that the residuals are
normally distributed, represented by a bell-shaped and the Bera-Jarque statistic value is
bigger than 0.05. It means that the null hypothesis of a normal distribution is accepted.
The normality test gives a researcher a confidence that the data used is normally
distributed. Further test in table 6, serial correlation test has indicated that the residual
data has no serial correlation as represented by the value of Prob.Chi-Square (2) at 0.15
which means above 0.05. Finally, the Heteroskedasticity in table 7 displays the value of
Prob.Chi-Square (1) is 0.1 which means P-Value is bigger than 0.05 and concludes that
residual is homoscedastic.
The Cm has a broad range of value expanding from 29 to 782. The Cm values reflect
average workload per hour of yard operation that consists of some container movement.
Ed fluctuates in relatively smaller range, with minimum 3 and maximum 42. The Ed
pattern shows the average number of yard equipment deployed for every hour.
Figure 20 displays Cm values divided by a trend line into two groups. The Cm values
located below the trend line indicate a situation when some container movement is less
than the average number of deployed equipment. In contrary, when Cm values are
located above the trend line, it indicates that container movement volume is bigger than
the mean number of deployed equipment. The values above the trend line may indicate
that terminal is experiencing over workload situation.
Obviously, over workload situation could be seen at the end of the trend line. The Value
of Ed stops at 42 while the value of Cm increases exceeding 660 up to 787, above the
trend line. Similarly, the same indicator of an over workload situation also exist in the