Available online on 15.08.2019 at http://jddtonline.info
Journal of Drug Delivery and Therapeutics
Open Access to Pharmaceutical and Medical Research
© 2011-18, publisher and licensee JDDT, This is an Open Access article which permits unrestricted non-commercial use, provided the original work is properly cited
Open Access
Research Article
Formulation and Evaluation of Matrix tablets containing Chitosan Based
Polyelectrolyte Complex with Natural Gum for Prolonged Release of
Diltiazem HCl
Rudragouda Patil*
1, Dr
Rakesh K Jat
2,
1 B.L.D.E.A’s SSM College of Pharmacy Vijayapura B.L.D.E University Campus-586101, India
2 Dept. of Pharmaceutical Sciences, JJT University Rajasthan, India
ABSTRACT
The aim of the present study was to formulate and evaluate the matrix tablets containing chitosan based polyelectrolyte complex microsphers of natural gum to overcome the problem of dose dumping and prolonged release of Diltiazem HCl . Microspheres of diltiazem were prepared using emulsion–crosslinking technique. The prepared microsphers were converted into matrix tablets by direct compression method and evaluated. Interaction of drug with polymers was examined by FT-IR spectroscopy, results indicated absence of chemical interactions between drug and the polymer. Differential Scanning Calorimetry studies indicated amorphous dispersion of Diltiazem HCl particles into the polymer matrix. The %encapsulation efficiencies were found between 36.5% and 84.8%. The average particle size of the prepared microspheres ranged
from 9.3 to 16.87 μm when observed under optical microscope using stage micrometer. In-vitro dissolution profiles of all formulations were
carried in acidic buffer (pH 1.2) for initial two hours, followed by alkaline buffer (pH 7.4) for 10 h. The drug release was found to be dependent on %encapsulation efficiencies and the concentrations of chitosan and xanthan gum used. The drug release pattern was in accordance with Higuchi’s model for diffusion because, it showed the maximum correlation coefficient in most of the formulations. Further the pre-compression and post-compression parameters for the tablet blend and the compressed tablets were found to be well within the compendial limits and drug release study showed zero order release up to 12 hours.
Keywords: Microspheres, matrix tablets Diltiazem hydrochloride, Chitosan, Xanthan Gum, polyelectrolyte complex, crosslinking.
Article Info:Received 11 June 2019; Review Completed 19 July 2019; Accepted 21 July 2019; Available online 15 August 2019
Cite this article as:
Patil R, Jat RK, Formulation and Evaluation of Matrix tablets containing Chitosan Based Polyelectrolyte Complex with Natural Gum for Prolonged Release of Diltiazem HCl, Journal of Drug Delivery and Therapeutics. 2019; 9(4-s):22-431
http://dx.doi.org/10.22270/jddt.v9i4-s.3242
*Address for Correspondence:
Rudragouda Patil, B.L.D.E.A’s SSM College of Pharmacy Vijayapura B.L.D.E University Campus-586101, India
INTRODUCTION:
Since many decades, drugs have been delivered to the patients in various dosage forms in order to relieve the patient from sufferings caused by several diseases (acute or
chronic).1,2 Nowadays rural lifestyle is getting replaced by
urbanisation, led to more stress and chronic state of tension- “hypertension or high blood pressure”. Hypertension, Ischemic heart disease (ICH), coronary artery diseases, arrhythmia like atrial and ventricular fibrillation, are few
important cardiovascular disorders.3 Hypertension leads to a
severe risk factor for cardiovascular diseases thus need to
control high blood pressure.4 A number of classes of
antihypertensive agents have been used to treat hypertension, viz, α- adenargic blockers, β- adrenergic blockers, diuretics, angiotensin converting enzyme (ACE) inhibitors, angiotensin II type 1 receptor blockers (ARB),
calcium channel blockers (CCBs) and diuretics.5,6 Among
various classes of anti-hypertensives CCBs are said to be
important class of drugs, cover varied group of compounds with typical structures, which are safe with effective pharmacologic action in reducing hard cardiovascular end points.7,8
Sustained Release dosage forms are the most desirable dosing regimens with effective pharmacokinetic profile and
pharmacodynamic response in controlling hypertension.9,10
The expression controlled release pattern has been joined with those new systems from which an active pharmaceutical ingredients(API) are mechanically set free at a predicted and predetermined rates over a long period of
time in a reproducible manner10-13 and thus duration of drug
release implies slow release of drug for extended period, reproducing the drug release kinetics for convenience and
patient compliance .14-17
pH, electric or magnetic field which includes stimuli like neutralization of charged groups by either a pH shift or the addition of an oppositely charged polymer, changes in the efficiency of hydrogen bonding with an increase in temperature or ionic strength and collapse of hydrogels and interpenetration of polymer network. Polyelectrolyte complexes (PECs) are the association complexes formed between oppositely charged particles (e.g. polymer-polymer,
polymer-drug and polymer-drug-polymer) due to
electrostatic interaction between oppositely charged polyions. These polyelectrolyte complexes are biocompatible polymer systems and can be adapted to meet the various requirements like carrier substances and components for
active substances.18-22
Natural polysaccharides contribute a significant
responsibility in the development of new sustained release
dosage forms.23-24 Gums and mucilages are extensively used
natural resources for conventional and novel drug delivery systems. These natural materials are advantageous for being chemically inert, non toxic, economical, biodegradable and extensively accessible. Xantham Gum is a bacterial polysaccharide synthesized by Xanthomonas campestris,
produced by fermentation process.25
Diltiazem hydrochloride (DTZ) is a calcium channel blocker, used in the treatment of hypertension and ICH like angina
pectoris.26-27 Diltiazem HCl binds with the alpha subunit of
calcium channel inhibiting the entry of calcium ion in to the smooth muscles of blood vessels, thereby inhibits the contraction of the smooth muscles leading to the
vasodilatation.28-29 Owing to their short biological half-life
(t1/2, 4 h) when administered orally, frequent dosing is required Diltiazem HCl in the form of sustained release tablet
is being observed to improve patient compliance.30-34
Matrix tablets provide a well established base for the sustained release of drug molecules from the matrix. However the dose dumping is one of the major disadvantages of matrix tablets. Hence in the present study an attempt has been done to overcome the difficulty like dose dumping by converting the diltiazem hydrochloride in the form of microspheres of polyelectrolyte complex of Chitosan and Xanthan gum. The prepared microspheres were formulated in to matrix tablets
and evaluated for post and pre-compression parameters in order to overcome the disadvantages of matrix tablets, ease of administration and to improve patient compliance.
MATERIALS & METHODS:
Materials: Diltiazem HCl was obtained as a gift sample from
Sun Pharmaceutical Industries Ltd, Piparia, Silvassa, India. Chitosan was obtained from Sigma Aldrich chemicals, Iceland. Xantham gum and Carbopol was obtained from Hi media chemicals Ltd, Mumbai, India. Glutaraldehyde, light liquid paraffin, acetone and petroleum ether were obtained from Rankem chemicals Pvt Ltd, Mumbai, India. Span and glaciel acetic acid was obtained from SD fine Chem. Ltd, Mumbai, India. Potassium dihydrogen phosphate and sodium hydroxide was obtained from Hi media chemicals Ltd, Mumbai, India. Potassium chloride and hydrochloric acid were obtained from Rankem chemicals Pvt Ltd, Mumbai, India.
Formulation Design: Microencapsulation of Diltiazem HCl
Polyelectrolyte microspheres containing chitosan and Xanthan gum were prepared using emulsion cross linking method. Aqueous solution of 2% w/v glacial acetic acid containing Chitosan and Diltiazem Hydrochloride was prepared by continuous stirring whereas, aqueous solution of Xanthan gum was prepared separately. Liquid paraffin
was kept at 37oC with Span 80® and to this, Chitosan
solution containing drug was added drop wise and stirred at 900 rpm to prepare an emulsion. Xanthan gum solution was added to the above emulsion in drop wise which results in the formation of a polyelectrolyte complex containing drug. These particles lack strength, so Glutaraldehyde was added (5% v/w of polymer) and emulsion was stirred for 3h. Microspheres formed are washed thoroughly with distilled water to get rid of excess glutaraldehyde (as glutaraldehyde is soluble in water), after drying, these microspheres were washed thrice with Petroleum Ether and dried for 24 h after which a final washing is done with Petroleum Ether to achieve free flowing property. Table 1 shows the formulae for various microspheres. %Yield was calculated as following.
% yield= Practical yield × 100
Theorotical yield
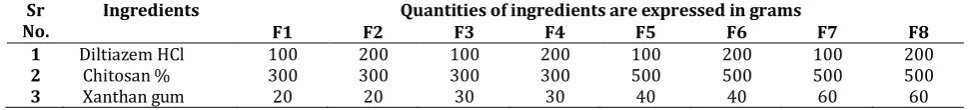
Table 1: Formulations of Diltiazem hydrochloride microspheres Sr
No. Ingredients F1 F2 Quantities of ingredients are expressed in grams F3 F4 F5 F6 F7 F8
1 Diltiazem HCl 100 200 100 200 100 200 100 200
2 Chitosan % 300 300 300 300 500 500 500 500
3 Xanthan gum 20 20 30 30 40 40 60 60
Evaluation of Microspheres
1. Drug content37: Drug-loaded microspheres were
accurately weighed (40 mg) and placed in a 50 ml standard volumetric flask, its volume was made up with distilled water and the flask was kept in an orbital shaker incubator (BIO BEE Tech, Bangalore, India) maintained at 37°C for 24 hours at 100 rpm rotation speed. Then the solution was filtered through Whatman filter paper and the clear supernatent solution was analyzed by UV spectrophotometer at the λ max value of 237 nm (Labindia, UV 3000, Mumbai, India). Analysis was done in triplicate for each sample, but
the average values are considered in data analysis. The percent encapsulation efficiency (EE) was calculated as:
2. Particle Size Measurements38: Determination of average
the particles and covered with a cover slip. The average particle size was determined in this manner for each formulation by triplicate measurements, from which average values were considered in data analysis.
3. Scanning Electron Microscopic Studies41: Scanning
Electron Microscopy has been used to determine particle size distribution, surface morphology. SEM is probably the most commonly used method for characterizing drug delivery systems, owing in large part to simplicity of sample preparation and ease of operation. SEM studies were carried out by using JEOL JSM-6360 Scanning microscope (Japan). Dry microspheres were placed on an electron microscope brass stub and coated with gold in an ion sputter. Picture of microspheres were taken by random scanning of the stub.
4. Equilibrium Swelling Studies40,43: Equilibrium swelling
was measured in terms of water uptake by the microspheres by the extent of swelling of the matrix in distilled water. To ensure complete equilibration, samples were allowed to swell for 24 h. Excess surface-adhered liquid droplets were removed by blotting with soft tissue papers and the swollen microspheres were weighed accurately. The microspheres were then dried in an oven at 60°C for 5 h until there was no change in the weight of the dried mass of the samples. These studies were performed in triplicate for each sample, but the average values are considered in data analysis. The percent swelling was calculated as:
5. In vitro dissolution studies43:
Drug release from the PEC microspheres with different drug loading and polymer compositions were investigated in pH 1.2 acid buffer solution for the initial 2 h, followed by pH 7.4 phosphate buffer solution for next 10 hours. These experiments were performed using a USP XXIII (Electrolab, Model TDT 08L, India) equipped with eight baskets at the stirring speed of 100 rpm. A weighed quantity of each sample equivalent to 100 mg of was placed in 900 ml of dissolution medium maintained at 37°C. A 5 ml of the sample was withdrawn every hour from the dissolution medium and the same amount was replaced with fresh buffer to maintain the sink conditions. The Diltiazem hydrochloride
concentration was determined using a UV
spectrophotometer at the λmax of 237 nm. These studies were performed in triplicate for each sample, but the average values are considered in data analysis.
6. Model fitting of in-vitro release data: 35,45
Kinetics of drug release from all the formulations were
calculated by fitting the in vitro release data to zero-order,
first order, Higuchi square root, Hixson-Crowell cube root as well as Korsemeyer-Peppas equations using the Microsoft
excel 97. Regression coefficients, r2, approaching close to
unity were considered to be the best fit model for the system under consideration.
Analysis of Release Kinetics
In order to understand the mechanism & kinetics of drug release from the microcapsules, the in-vitro release data were fitted with the following mathematical models, Zero-order kinetic equation …………Qt= K0 t …….. (1)
First-order kinetic …….ln Qt = ln Q0 – K1 t …….. (2) and,
Higuchi release model ……….Qt= Kh t1/2 …….. (3)
Table 2: Formulations of matrix tablets containing microspheres
S. N. INGREDIENTS Formulation in mg
1. Microspheres equivalent to
100 mg diltiazem 461.25
2. Carbopol-934P 128.75
3. Sodium lauryl sulphate, 5
5. Magnesium stearate 5
8. Total weight of the tablet 600
Preparation of matrix tablets
For preparing matrix tablets containing the polyelectrolyte microspheres equivalent to 100 mg of diltiazem hydrochloride which was calculated on the basis of entrapment of efficiency. Entrapment efficiency of formulation F7 containing 100 mg diltiazem hydrochloride, 250 mg of Chitosan and 40 mg of Xanthan gum was found to be 84.8 %. Depending upon the entrapment efficiency 461.25 mg of microspheres equivalent to 100 mg of diltiazem hydrochloride was taken for the formulation. Sodium lauryl sulphate, magnesium stearate were used as glidants & lubricants respectively(Table 2) .
The tablets were prepared by direct compression method. Initially required quantity of microspheres were weighed and sifted through sieve #40 and then mixed thoroughly in a polybag and finally uniformly blended in planetary mixer for 10minutes. Magnesium stearate and sodium lauryl sulphate were taken previously sifted through #60 and added as a lubricant to the blend in the planetary mixer.
Pre-compression analysis of the powder blend to be compressed was for the following pre-compression parameters angle of repose, bulk density, tapped density , Carr’s index and Hausner’s ratio.These blended mixtures were compressed by using tablet compression machine having 11 mm, The details of all formulations are as shown in Table 2
Post compression evaluation of prepared tablets
Administration of a formulation is one of the very essential challenges before the formulator. To ensure the mode of administration in which the prepared microspheres can be administered, Polyelectrolyte microspheres were formulated in to matrix tablets using Carbopol-934P, a hydrophilic polymer with a very high swelling ability. The prepared tablets of diltiazem hydrochloride containing polyelectrolyte microspheres were subjected to various pos- compression analysis. Following are the post compressions parameters Tablet description, weight variation, Crushing strength or hardness, Friability, In vitro swelling , In vitro dissolution.
.37 In–vitro dissolutoion study was carried
RESULTS AND DISCUSSIONS
Drug – Excipient compatibility studies: From the FTIR
spectra of pure drug and the combination of drug with polymers, it was observed that all characteristic peaks of Diltiazem hydrochloride were present in the combination spectrum, thus indicating compatibility of the drug and polymer.
FTIR spectrum of Diltiazem hydrochloride shows a band at 1679 cm-1 indicating lactam C=O stretching vibrations. Bands at 1743 cm-1 indicate acetate C=O stretching vibrations. A band at 837 cm-1 represents the o-substituted
aromatic C-H out-of-plane deformation. A band at 2390 cm-1
physical mixture of Chitosan, Xanthan gum and Diltiazem hydrochloride all the bands corresponding to Diltiazem hydrochloride are present i.e. 1743 cm-1, 1677 cm-1 and 836 cm-1 for respective acetate C=O stretch, lactam C=O stretch and out of plane deformation. But however all the bands present in both pristine Diltiazem hydrochloride and
physical mixture of Chitosan, Xanthan gum and Diltiazem hydrochloride are absent in physical mixture of Chitosan and Xanthan gum. Thus, FTIR spectral studies indicated the absence of interactions between drug and polymers as shown in Fig 1(a), 1(b) & 1(c)
A B
C
Fig 1: FTIR of A) Dilitiazem HCl B) CS + XG & C) Drug+ CS+XG
Confirmation of polyelectrolyte complex formation:
Polyelectrolyte complex formation between Chitosan and Xanthan gum was confirmed using FTIR spectral analysis. FTIR spectra of plain Chitosan, plain Xanthan gum and Placebo microspheres were taken. The IR spectra are presented in Fig 2(a), 2(b) & 2(C). FTIR spectra of plain Chitosan, xantham gum and placebo microspheres confirmed
the formation polyelectrolyte complex. In case of Chitosan, a broad band at 3422 cm-1 indicates N-H stretching vibrations of amine group. Whereas in case of Xanthan gum, a sharp band at 1021 cm-1 represents –C=O stretching. In case of placebo microspheres, the N-H stretching band of Chitosan and –COOˉ stretching band of Xanthan gum have diminished indicating the formation of polyelectrolyte complex structure between Chitosan and Xanthan gum.
(A) (B)
(C)
Differential Scanning Calorimetric (DSC) Studies: DSC thermograms of placebo microspheres, drug-loaded microspheres and Diltiazem hydrochloride are presented. DSC was performed to investigate the crystallinity of drug in the drug-loaded microspheres. DSC thermograms of (a) placebo microspheres, (b) drug-loaded microspheres and (c) pristine Diltiazem hydrochloride were taken. For placebo microspheres, two peaks are observed, one endothermic peak observed at 100.8°C attributed to the loss of volatile components or possible chain relaxation and another an exothermic peak at 241.87°C due to the degradation of polymer matrix. However, electrostatic interactions between
the Chitosan and Xanthan gum polymers might have caused the loss of H-bonding. DSC thermograph of Diltiazem hydrochloride showed a sharp peak at 215.32°C, indicating the melting of drug. In the case of drug-loaded microspheres, two peaks were observed, one referring to endothermic peak at 82.37°C, indicating the loss of volatile components or chain relaxation and another peak at 197.56°C due to the degradation of polymer, but no peak corresponding to Diltiazem hydrochloride was observed, indicating the amorphous dispersion of Diltiazem hydrochloride particles into the Polyelectrolyte Complex matrix. DSC thermogram graphs are shown in Fig 3(a), 3(b) and 3(c)
a)pure dug b) placebo
c
Fig 3: DSC thermogram of (a) Pure drug, (b) Placebo microspheres & 3 (c) Drug loaded microspheres
Microencapsulation of Diltiazem Hydrochloride: The
mechanism of formation polyelectrolyte complex
microspheres is presumably due to matrix dispersion of drug in chitosan droplets followed by cross-linking due addition of Xanthan gum in glutaraldehyde, that leads to polyelectrolyte complex formation simultaneously.
Percent Yield and Drug content: Percent Yield and Drug
content of all the formulations are presented in table 3. The percent yield for all the formulations was found to be between 81.2 and 96.5. The results of percent encapsulation efficiency were in the range of 36.5% to 84.8% depending on the nature of the Polyelectrolyte Complex matrix. For instance, formulations F1 and F2 showed the Percent encapsulation efficiency values of 72.5% and 36.3% respectively, whereas, formulations F3 and F4 have the
Percent encapsulation efficiency of 80.4% and 49.3%, respectively which clearly indicate the dependence of percent encapsulation efficiency on the Polyelectrolyte composition of Xanthan gum, Chitosan and the drug. Similarly, formulations F7 and F8 exhibited percent encapsulation efficiency values of 84.8% and 46%, respectively, whereas formulations F5 and F6 showed percent encapsulation efficiency of 40.5% and 40.92% respectively.
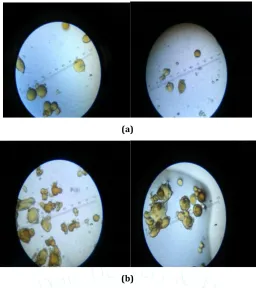
Particle size and external morphology: The average
(a)
(b)
Fig 4: Optical microscopy of a) F2 and b) F4 formulations
Table 2: %EE, %yield, Average particle size(µm) and % Equillibrium water uptake of formulations F1 to F8
FORMULATIONS %EE %yield Avg particle size % Equillibrium
water uptake
F1 72.5 ± 1.5 84.7 10.8± 2.19 168 ± 0.76
F2 36.3 ± 1.0 90.6 15.87 ± 2.98 75 ± 0.57
F3 80.4 ± 2.1 81.2 9.3 ± 1.98 90 ± 1.04
F4 49.3± 2.5 85.3 9.9 ± 1.99 209 ± 0.58
F5 40.5± 2.3 94.3 12.76± 2.65 262 ± 1.10
F6 40.92± 1.2 87.2 11.4± 1.18 190 ± 1.0
F7 84.8± 1.1 96.5 16.43 ± 3.16 170 ± 1.15
F8 46 ±1.8 86.7 16.87 ± 3.29 168± 0.76
Swelling Studies: The percent water uptake study results
reveals that this parameter depends on the concentrations of both Chitosan and Xanthan gum. For instance, in case of F1 with lower Xanthan gum concentration of 20 mg, percent equilibrium water uptake is 152±0.86% , whereas, in case of F3 having Xanthan gum in the amount of 30 mg, the percent equilibrium water uptake is 75 ± 0.57%. Similarly, when we compare formulations F5 and F8 the percent equilibrium water uptake values are 209 ± 0.58 and 170 ±1.15% respectively.
Scanning Electron Microscopy:Scanning electron
microscopy (SEM) was performed to characterize the surface morphology of microspheres. SEM of formulations F1, F4 and F8 were taken. SEM analysis revealed the external morphology to be spherical. Close examination reveals that microspheres formed show a rough surface. SEM photographs of all the three formulations are shown in Fig 5(a), 5(b) and 6.
Fig 6: SEM of Formulation F8
In vitro dissolution studies:Drug release behaviour of the
Polyelectrolyte Complex microsphere formulations have
been evaluated by performing in vitro release experiments
in simulated gastric and intestinal pH conditions. Percent Cumulative drug release after 12 hrs for formulations F1 to F8 are presented in table 3
Fig 7: In Vitro drug release of formulations F1-F8
In vitro drug release studies indicated that the release of the drug from the Polyelectrolyte complex microspheres showed dependence on percent Encapsulation Efficiency (Fig.7). As the Percent encapsulation efficiency increased, the %CDR decreased from 99.23 to 84.03. The release rate is higher in case of formulations with lower values of percent encapsulation efficiency as their swelling indices are higher. Formulation F2 has the minimum percent encapsulation efficiency showing %CDR of 99.23 at the end of 12 hours, whereas, formulation F7 has the maximum percent encapsulation efficiency, which shows %CDR of 84.03 at the end of 12 hours.
Mathematical Models Used:
The results of in vitro release studies were also fitted into
five models viz. zero order kinetics (cumulative % drug release vs. time), first order kinetics (log cum. % drug retained vs. time), Higuchi matrix(cumulative % release was
plotted against √T [square root of time]), Hixson crowell’s erosion(, {% retained} 1/3 vs. time) and korsemeyer-peppas model (log % cumulative drug release vs. log time) to investigate the drug release.
The data are presented in following table 4
Table 4: Correlation coefficients, r2, computed from different equations
Formulations Zero First Higuchi Hixson
Crowell Korsemeyer-Peppas
Order Order
r2 r2 r2 r2 r2 N
F1 0.917 0.893 0.974 0.913 0.783 0.582
F2 0.836 0.861 0.972 0.960 0.783 0.582
F3 0.962 0.863 0.978 0.958 0.906 0.123
F4 0.907 0.867 0.977 0.966 0.927 0.155
F5 0.904 0.857 0.975 0.966 0.755 0.579
F6 0.905 0.856 0.964 0.967 0.848 0.150
F7 0.903 0.892 0.985 0.970 0.851 0.090
F8
MT* 0.929 0.992 0.875 0.971 0.977 0.962 0.977 0.921 0.847 0.821 0.145 0.123
MT : Matrix tablets containing polyelectrolyte microspheres
The values of regression coefficient or correlation coefficient of Higuchi’s diffusion model for formulations F7, F3, F4, F8 and F5 are 0.985, 0.978, 0.977, 0.977 and .0975 respectively. Based on data of correlation coefficient, most of the
formulations follow Higuchi’s release kinetics,
Indicating that the drug release takes place through Higuchi’s diffusion mechanism. Probably, upon swelling, the drug diffuses through the pores formed on the surface of microspheres.
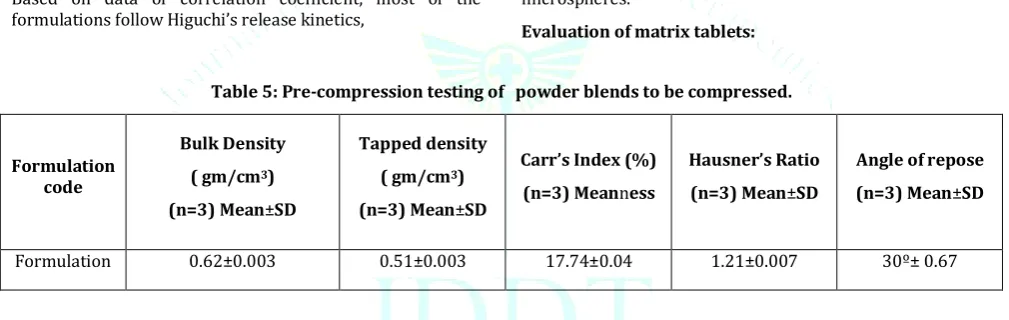
Evaluation of matrix tablets:
Table 5: Pre-compression testing of powder blends to be compressed.
Formulation code
Bulk Density
(gm/cm3)
(n=3) Mean±SD
Tapped density
( gm/cm3)
(n=3) Mean±SD
Carr’s Index (%)
(n=3) Meanness
Hausner’s Ratio
(n=3) Mean±SD
Angle of repose
(n=3) Mean±SD
Formulation 0.62±0.003 0.51±0.003 17.74±0.04 1.21±0.007 30º± 0.67
Blend of formulation was subjected for precompression evaluations and the values (Table 5 )were found to be in the range of 30º± 0.67 which indicates a good flow property of
the powder. Bulk density was found to be 0.62±0.003 g/cm3
and the tapped density was found to be 0.51±0.003 g/cm3..
The percentage compressibility of powder was determined using Carr’s compressibility index. Carr’s was 17.74±0.04 %.
Table 6: Post-Compression Parameters of All Formulations
Formulation code
Hardness*
(Kg/cm 2)
Thickness*
(mm) (n=10)
Friability (%) Weight
Variation (n=20) Content of drug uniformity
* (%)
Mg %
F4 4.12±0.03 4.80± 0.01 0.205 602.95±3.50 0.49 96.5 ±1.99
* * Values are expressed as mean ± standard deviation
Formulated Matrix tablets were evaluated for various parameters(Table 6.). The hardness of matrix tablet
containing carbopol was found to be 4.12 kg/cm.3 The
thickness of all the tablets was uniform and found to be 4.80 mm. Ten tablets were randomly selected and subjected for weight variation test. Results were found to be 602.95±3.50. Friability test was performed using Roche fraibilator and
Fig 8: In Vitro drug release of formulations matrix tablets containing microspheres
CONCLUSION:
The main objective of the study was to formulate and evaluate the matrix tablets containing chitosan based polyelectrolyte complex microspheres for prolonged release of an antihypertensive drug. PEC microspheres of CS and XG were successfully prepared by a novel emulsion-crosslinking method for the sustained release of Diltiazem hydrochloride, an antihypertensive and antianginal agent. Various formulations were prepared by changing formulation contents such as drug loading, CS and XG. The mechanism of the formation of PEC microspheres is due to the Hydrogen bonding as well as the electrostatic interactions between positively charged CS and the negatively charged XG. The polyelectrolyte microspheres of Diltiazem hydrochloride prepared by using Chitosan and Xanthan gum showed good Swelling indices, Content uniformity, Shape and Surface morphology and sustained release of the drug consistently for 12 hours .Further the matrix tablets containing polyelectrolyte microspheres showed good post and pre compression properties. In vitro drug release exhibited controlled release of drug with zero order release kinetics. Hence the controlled release matrix tablets were successfully prepared and evaluated which can be given to the patient after successful pre clinical and clinical trials to treat the disease like hypertension, angina pectoris and other cardiovascular disorders
REFERENCES:
1. Vyas SP, Khar RK. Targeted and Controlled Drug Delivery –
Novel Carrier Systems. New Delhi: CBS Publishers; 2008. Pg. No.:38,39.
2. Vyas SP, Khar RK. Controlled Drug Delivery – Concepts and
Advances. New Delhi: Vallabh Prakashan; 2008. Pg. no.- 1-3.
3. Tripathi KD. Essentials of medical pharmacology. 5th Ed. New
Delhi: Jaypee brother’s medical publication (p) Ltd;2003.
4. Katzung GB. Basic and clinical pharmacology. 8th ed. New York:
Mcgraw Hill;2001.
5. Ozawa Y, Hayashi K, Kobori H. New Generation Calcium Channel
Blockers in Hypertensive Treatment. Curr Hypertens Rev. 2006 May 1; 2(2): 103–111.
6. Lachmman L, Liberman HA, Konig JL. The theory and practice of
Industrial Pharmacy. 3rd Edn. Vargheese Publishing House, Bombay;1991:430.
7. Chien, Yie W. Text Book of Novel drug delivery system. 2nd Edn.
Marcel Dekker Inc. New York;1992:2.
8. Michael E, Aulton. Pharmaceutics the science of dosage form
design. 1st Edn. ELBS Hongkong;1990:316.
9. Gennaro AR. (Ed.) Remington. The Science and Practice of
Pharmacy. 19th Edn.1995:Vol.-II,1661-1662.
10. Gennaro AR, (Ed.) Remington’s. Pharmaceutical science. 20th
Edn. Lippincott .Williams and Wilkini Publishing Co., New York 2000:Vol-I:905-06.
11. Robinson JR., Lee LH. Controlled Drug Delivery: Fundamentals
and Applications; 1987;2nd edition;29; 312-9.
12. M Flu Lu et al., Drug Development and Industrial
Pharmacy;1991;17(4);1987-2004.
13. Nicholson S J et al., Journal of pharmacy and
Pharmacology;1990;42;21-26.
14. Nigayale AG et al., Drug Development and Industrial
Pharmacy;1990;16;2-8.
15. Ansel CH., Pharmaceutical Dosage Forms and Drug Delivery
Systems., 6th edn, B.I. Waverly Pvt. Ltd., New Delhi.,1995: 213.
16. Parmar NS., Shivprakash., Biopharmaceutical and
pharmacokinetic consideration in development of controlled release drug product. Chapter 1, Controlled and Novel Drug Delivery,1st edition, Jain NK , CBS Publisher and Distributor, New Delhi., 1997:1,10,24.
17. Vyas SP, Khare RK., Controlled Drug Delivery Concept and
Advances. 1st edition, Vallabh Prakashan, New Delhi., 2000:1, 154-155.
18. Lankalapalli S, Kolapalli V. R. M. Polyelectrolyte Complexes: A
Review of their Applicability in Drug Delivery Technology. Indian J Pharm Sci. 2009 Sep-Oct; 71(5): 481–87.
19. Vehlow D, Schmidt R, Gebert A, Siebert M, Lips KS, Müller M.
Polyelectrolyte Complex Based Interfacial Drug Delivery System with Controlled Loading and Improved Release Performance for Bone Therapeutics. Nanomaterials (Basel). 2016 Mar; 6(3);53:1-21.
20. Wang H, Sun H, He J. Formation of Polyelectrolyte Complex
Colloid Particles between Chitosan and Pectin with Different Degree of Esterification. IOP Conf. Ser.: Mater. Sci. Eng. 2017;275(1):1-7
21. Patil J.S., Kamalapur M.V., Marapur S.C., Kadam D.V: Ionotropic
gelation and polyelecrolyte complexation: The novel Techniques to design hydrogel particulate sustained, modulated drug delivery system: A review. Digest J. Nanomat. Biostrc 2010; 5:241-248.
22. Jain, S.; Kumar, D.; Swarnakar, N.; Thanki, K. Polyelectrolyte
stabilized multilayered liposomes for oral delivery of paclitaxel. Biomaterials 2012, 33, 6758–6768.
23. Girish K Jani, Dhiren P Shah, Vipul D Prajapati, Vineet C Jain. Gums and Mucilages .AJPS 2009;4(5):309-323.
24. Jani GK, Shah DP, Prajapati VD, Jain VC. Gums and
mucilages:versatile excipients for pharmaceutical formulations. Asian J Pharm Sci 2009;4(5):309
25. Benny I S, Gunasekar V, Ponnusami V. Review on Application of
Xanthan Gum in Drug Delivery. Int.J. PharmTech Res. 2014 Aug-Sep;6(4): 1322-26.
26. Kajale AD, Wankhade J M, Bakde B V, Channawar M A, Chandewar AV.
Formulation and Evaluation of sustained release matrix tablets of diltiazem HCl. Int J Pharm Pharm Sci. 2014;3(4): 178-183
27. Imran N, Nisar-ur R, and Asadullah M. Prepration and in vitro
dissolution of deltiazem sustained release tablets. Turk.J.Pharma Sci 2009;6(1):43-50.
28. Radhika PR, Pal TK, Sivkumar T. Formulation and Evalution of
sustained release Matrix Tablets of Diltiazem. Iranian J Pharm Sci 2009;5(4);205-14
29. Han X et. al. Prearation and evaluation of sustained release
diltiazem hydrochloride pellets. Asian J Pharm Sci. 2013 Aug;8(4):244-251.
30. Kabir ER, Huq S. Diltiazem HCl: Evaluation of its presence in
Bangladesh. Int Res J Pharm. 2014 Aug;5(9):683-9.
31. Yan X Q, Chen Z G, Wang R L, Yang J, Ai F, Pan Y J, Qiu P Y, Wang D
X. Pharmacokinetics of diltiazem hydrochloride delay-onset sustained-release pellet capsules in healthy volunteers. Braz. J. Pharm. Sci. 2013 Jan;49(1):29-38
32. Han X, et al,. Preparation and evaluation of sustained-release
diltiazem hydrochloride pellets. Asian J Pharm Sci.2013 Aug;8(4): 244-251.
33. Wang YB , Lian ZX , Chen MN , Zhang L , Zhou CY , Wei W.
Bioadhesive drug delivery system of diltiazem hydrochloride for improved bioavailability in cardiac therapy. Tropical J Pharma Res. 2016 July; 15 (7): 1375-80.
34. Lakshmana MG, Hareesha CH, Gargeyi P, Nantheeswaran. Drug
release matrix tablet wet granulation method Int. J. Pharm. 2011 jan-mar;01(01):43-51.
35. Bettini R, Bonferoni MC, Colombo P, Zanelotti L, Caramella C.
Drug release kinetics and front movement in matrix tablets containing diltiazem or metoprolol/λ-carrageenan complexes. BioMed Res Int. 2014 June:1-8
36. Ganesh s, Radhakrishnan M, Ravi M, Prasannakuma B, Kalyani J.
In vitroEvaluation of the Effect of Combination of Hydrophilic
and Hydrophobic Polymers on Controlled Release Zidovudine Matrix Tablets. Indian J Pharm Sci. 2008 Jul-Aug; 70(4): 461– 465.
37. Patil RG, Rakesh J, Gururaj K, Ashwini A Sudhir I. Formulation
and evaluation of sustained release matrix tablets of Diltiazem
HCl. UJP 2018, 07 (05):11-19.
38. Kulakarni PK, Dixit M, Selvam P, Rudra SD. Formulation and
Evaluation of Indomethacin Microspheres for Colonic Drug Delivery System. Int Res J Pharm 2011 Aug; 2(8): 181-84.
39. Chellat F, Tabrizian M, Dumitriu S, Chornet E, Rivard CH, Yahia L.
Study of biodegradation behavior of chitosan–xanthan microspheres in simulated physiological media. J Biomed Mater Res 2000;53:592–99.
40. Briones AV, Sato T. Encapsulation of glucose oxidase (GOD) in
polyelectrolyte complexes of chitosan-carrageenan. React. Funct.
Polym. 2010, 70, 19–27.
41. Bernabe P, Peniche C. Argüelles-Monal W. Swelling behavior of
chitosan/pectin polyelectrolyte complex membranes. Effect of
thermal cross-linking. Polym. Bull. 2005, 55, 367–375.
42. Behera AL, Patil SV, Sahoo SK. Formulation and Characteristics
of 5flurouracil Microspheres by Solvent Evaporation Method. Int J Ph Pharm Sci 2011; 3(1):32-35
43. Muzaffar F, Murthy VN , Paul P, Semwal R ,Pandey S.
Formulation and Evaluation of Mucoadhesive Microspheres of Amoxicillin Trihydrate by using Eudragit RS 100. Int J Chem Tech Res 2010 Jan-Mar; 2(1): 466-70.
44. Pandey S, Devmurari V, Goyani M, Koradia S. Formulation,
characterization and in vitro evaluation of Diltiazem
Hydrochloride matrix tablets. Der Pharm Let 2010; 2(1): 482-88.
45. Syed L A, P. Niveditha, Ahmad I. Formulation and evaluation of
polyelectrolyte complex-based matrix tablet of Isosorbide Mononitrate. Int J Pharm Investig. 2014 Jan-Mar;4(1):38-45.
46. Radin S, Chen T, Ducheyne P. The controlled release of drugs
from emulsified, sol gel processed silica Microspheres. Biomaterials 2009 Feb; 30(5): 850-58.
47. Arif M, Raja MA, Zeenat S, Chi Z, Liu C. Preparation and