Available online on 15.09.2018 at http://jddtonline.info
Journal of Drug Delivery and Therapeutics
Open Access to Pharmaceutical and Medical Research© 2011-18, publisher and licensee JDDT, This is an Open Access article which permits unrestricted non-commercial use, provided the original work is properly cited
Open
Access
Research Article
NEW ANALYTICAL METHODS FOR ESTIMATION OF ARTEETHER BY
UV AND FLUORESCENCE SPECTROPHOTOMETRY: DEVELOPMENT
AND VALIDATION
Thakur Shikha
1, BajwaNeha
2, Baldi Ashish
2*
1Department of Quality Assurance, ISF College of Pharmacy, Moga, (Pb), India
2
Department of Pharmaceutical Sciences & Technology, Maharaja Ranjit Singh Punjab Technical University, Bathinda. (Pb), India
ABSTRACT
The research work is based on the development and validation of two different spectrophotometric methods (UV spectrophotometer and spectrofluorimeter) for estimation of α-β arteether. Two simple, accurate, precise, sensitive and economical methods has been developed, validated for the estimation of α-β arteether in bulk and pharmaceutical dosage form as per ICH guidelines Q2(R1). The solvent used for UV spectroscopy was methanol and HCl (8:2) and methanol was used for fluorimeter. For qualitative and quantitative analysis, 254 nm was used in UV spectroscopy and excitation and emission wavelengths were set at 354 nm and 697 nm, respectively for fluorimetry. Coefficients of correlation were found to be 0.993 and 0.992 for UV spectroscopy and fluorimetry respectively. Both methods show good accuracy and precision and were compared statistically by using two way ANOVA which shows no significant difference between these methods. So, the proposed methods were found to have equal applicability for estimation and routine analysis of arteether in pharmaceutical formulations.
Keywords: Arteether, Analytical method, Fluorimeter, Pharmaceutical formulation, UV spectrophotometer.
Article Info:Received 20 June, 2018; Review Completed 14 July 2018; Accepted 05 Aug 2018; Available online 15 Sep 2018
Cite this article as:
Shikha T, Neha B, Ashish B, New analytical methods for estimation of arteether by UV and Fluorescence spectrophotometry: development and validation, Journal of Drug Delivery and Therapeutics. 2018; 8(5):151-158
DOI:http://dx.doi.org/10.22270/jddt.v8i5.1797
*Address for Correspondence:
Dr. Ashish Baldi, Professor & Head, Department of Pharmaceutical Sciences and Technology, Maharaja Ranjit Singh Punjab Technical University, Bathinda (Pb), India, E-mail: [email protected] , Telephone no: +91-8968423848
INTRODUCTION
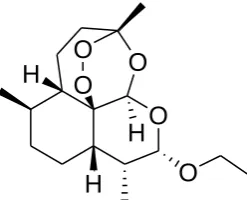
α-β arteether, (3R,5aS,6R,8aS,9R,10S,12R,12aR
)-decahydro-10-ethoxy-3,6,9-trimethyl-3,12-epoxy-12 H-pyrano[4,3-j]-1,2-benzodioxepin, is an oil-soluble ethyl ether derivative of dihydroartemisinin, which is an
efficient erythrocyticschizontocidal drug for the
treatment of multi-drug resistant falciparum malaria. α-β
arteether (Fig. 1) shows rapid schizonticidal action and
brings about quick clinical improvement in falciparum malaria with low recrudescence rate. Inmulticentric clinical trials in patients with complicated and
uncomplicated P. falciparum malaria, α-β arteether has
been demonstrated for rapid parasite and fever clearance
with no adverse effects1,2. The mechanism of action
responsible for its pharmacological activity is haem-catalyzed cleavage of the peroxide that generates
unstable free radicals to which malaria parasites are particularly sensitive. α-β arteether has been proven to be 100% effective in treating patients for acute
chloroquine resistant, complicated as well as
uncomplicated falciparum malaria3.
Extensive literature survey revealed that although there
are many methods like HPTLC4, HPLC5 for
determination of arteether and simultaneous estimation
method using HPLC/MS6 were reported previously. A
O
O
O
O
H
H
O
H
Figure 1: Chemical structure of Arteether
So, the object of this work was to develop new, simple, sensitive, precise, and accurate methods for the estimation of α-β arteether in pure form and in pharmaceutical formulation and to validate the
developed methods as per the ICH guidelines7 for
reliability and industrial acceptance.
MATERIAL AND METHODS
Apparatus
SHIMADZU UV-1700 double beam UV-Vis
spectrophotometer equipped with 1cm matched pair of rectangular quartz cells was used in present study. Fluorescence measurements were carried out on LS-50 spectrofluorimeter (Perkin Elmer) equipped with xenon lamp and 1 cm quartz cells. The slit width of both the excitation and emission monochromators were set at 10 nm. All the apparatus and instruments were calibrated and validated before starting the experimental work.
Materials
Arteether pure drug was obtained as a gift sample from Cipla Pvt. Ltd., Baddi. All the chemicals and reagents used were of analytical grade. Two injection formulations procured from local market, were MATCH
(MANKIND) and KAPITHER-150 (GODRAMS
LIFELINE) each containing α-β arteether 150 mg/2 ml.
Methods
Preparation of standard stock solution
Standard stock solution of α-β arteether was prepared by dissolving 10 mg of α-β arteether in 10 ml of methanol which gives 1000 g/ml concentration.
Preparation of calibration curve
As no direct spectrophotometric method was reported so far in literature for the drug estimation. So, the problem of UV detection of α-β arteether has been tackled by acid decomposition using 5 M HCl inducing the formation of UV detectable degradation product. The optimum conditions for the estimation of α-β arteether were established by varying concentration of HCl and heating conditions and the maximum absorption was obtained by heating at 50ºC for 30 min. with 2 ml of 5M HCl. The peak at 254 nm was the most intense and prominent one and was produced in every condition of
heating8.
For UV spectrophotometry 100g/ml solution was prepared from stock solution, pipetted out 0.8ml, 1.2 ml, 1.6 ml, 2.0 ml, 2.4 ml, 2.8 ml, 3.2 ml and 3.6 ml into 10 ml volumetric flasks and 2 ml of 5 M HCl was added to
each and finally volume was made up to 10 ml with
methanol to produce concentrations of 8 g/ml, 12
g/ml, 16 g/ml, 20 g/ml, 24 g/ml, 28 g/ml, 32 g/ml, 36 g/ml respectively. The solution were kept in water bath at 50ºC for 30 minutes for its acid decomposition to produce, - unsaturated decalone
[8-methyl-5-(2-propanyl) decalin-4-ene 3-one]. The
absorbance was measured at max 254 nm using
methanol and HCl (8:2) as blank. At this absorbance maximum, calibration curve of concentration against the
absorbance was prepared (Fig.2). The overlay spectra of
arteether are shown in Fig.3.
For fluorimetry 100 g/ml solution was prepared from
stock solution and pipetted out 0.1 ml and was diluted upto 10 ml using methanol as solvent. The solution such obtained was further diluted to 6.25 ng/ml, 12.5 ng/ml, 25 ng/ml, 50 ng/ml and 100 ng/ml by using same solvent. The fluorescence intensity was measured at the excitation wavelength of 354 nm and emission wavelength of 697 nm. The calibration curve was drawn by plotting graph between fluorescence intensity at
emission wavelength and concentration (Fig.4). The
overlay spectra of arteether by using fluorimeter are
shown in Fig. 5.
Figure 2: Calibration curve of arteether using UV Spectrophotometer
Figure 3: Overlay Spectra of arteether using UV Spectrophotometer
y = 0.0214x + 0.0035 R² = 0.9929
0 0.1 0.2 0.3 0.4 0.5 0.6 0.7 0.8 0.9
0 4 8 12 16 20 24 28 32 36 40
A
bs
orbance
Figure 4 Calibration curve of arteether using flourimeter
Figure 5 Overlay spectra of Arteether using fluorimeter
Analytical method validation of the proposed method
Validation is the process of demonstrating that analytical procedures are suitable for their intended use and that they support the identity, strength, quality, purity and potency of the drug substances and drug products.
The analytical method validation includes linearity, precision, accuracy, robustness, limit of detection (LOD) and limit of quantification (LOQ) as per ICH
guidelines7.
Linearity and range
The linearity of the analytical method is its ability to elicit test results which are directly proportional to analyte concentration in samples within a given
range9. The various aliquots were prepared by suitable
dilution of the standard stock solution (100g/ml) ranging from 8-36 g/ml and the samples were scanned in UV-Vis Spectrophotometer against methanol and HCl (8:2) as blank. The absorbances of respective concentrations were then calculated for coefficient of correlation using Microsoft excel.
For fluorimeter, linearity was established by preparing five different dilutions (6.25 ng/ml, 12.5 ng/ml, 25 ng/ml, 50 ng/ml and 100 ng/ml) of drug. Intensities of respective concentrations were then calculated for coefficient of correlation using Microsoft excel.
Precision
The precision of an analytical procedure is usually expressed as the closeness of agreement between a series of measurements obtained from multiple sampling of the same homogenous sample under the prescribed
conditions10. Intraday precision study was carried out by
preparing drug solution of three different concentrations and analyzing them at three different times in a same day. Likewise for interday drug solutions were analyzed for three different days. The same procedure was followed to calculate precision by using fluorimeter. The results were reported in terms of %RSD.
Accuracy
The accuracy of the method is the closeness of the
measured value of the true value for the sample11. To
determine the accuracy of proposed method, recovery y = 0.968x + 459.1
R² = 0.992
0 100 200 300 400 500 600
0 10 20 30 40 50 60 70 80 90 100 110 Concentration (ng/ml)
In
te
n
si
studies were performed by standard addition method. The recovery studies were performed at three levels, 80, 100 and 120 % of working standard solution (100 g/ml). The recovery samples were prepared in afore mentioned procedure. The solutions were then analyzed at respective wavelength (254 nm) for UV spectroscopy and at 697 nm for fluorimetric analysis. The percentage recoveries were calculated for the formulation from the calibration curve.
Robustness
Robustness of the proposed method was determined by carrying out analysis under different wavelengths (252 nm, 254 nm, 256 nm) and by making deliberate small changes in ratio of HCl and methanol (1:9 and 3:7) used for UV spectrometer. In case of fluorimeter, robustness was determined at different wavelengths (695 nm, 697 nm, 699 nm). The respective absorbances were noted and the results were indicated as % RSD.
LOD and LOQ
Limit of detection (LOD) is the lowest amount of analyte in the sample that can be detected. Limit of quantification (LOQ) is the lowest amount of analyte in the sample that can be quantitatively determined. The LOD and LOQ for arteether by the proposed method were determined using calibration standards. LOD and LOQ were calculated using following equations:
LOD= 3.3 /S, LOQ= 10 /S;
Where standard deviation of the response and S is is the slope of the related calibration curve.
RESULTS
Linearity and Range
The calibration curve was obtained by its correlation coefficient. The curve of Arteether was linear in the
concentration range of 8-36 g/ml with correlation
coefficient of 0.993 for UV spectroscopy. For fluorimetric analysis curve was linear in range of 6.25-100 ng/ml with correlation coefficient of 0.992. The linearity data of arteether for UV and fluorimetric
analysis are shown in Table1 and Table 2 respectively.
Table 1: Linearity of arteether estimation by UV spectroscopy
Concentration (g/ml) Absorbance
8 0.19934
12 0.24927
16 0.31604
20 0.43457
24 0.53687
28 0.59021
32 0.6922
36 0.77893
Table 2: Linearity of arteether estimation by fluorimetry
Concentration (ng/ml) Intensity
6.25 461.02
12.5 475.03
25 482.22
50 510.61
100 554.57
Precision
Precision was calculated as intraday and interday variation (%RSD) for the drug. The results confirmed adequate sample stability and method reliability where % RSD was < 2%. The results of interday and intraday
precision for UV analysis are mentioned in Table 3 and
Table 4. Same results are summarized in Table 5 and Table 6 for fluorimetric analysis.
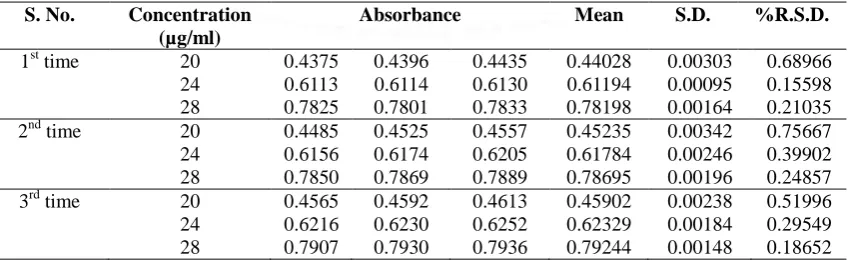
Table 3: Intraday Precision at 254 nm in UV spectroscopy
S. No. Concentration (µg/ml)
Absorbance Mean S.D. %R.S.D.
1st time 20 0.4375 0.4396 0.4435 0.44028 0.00303 0.68966
24 0.6113 0.6114 0.6130 0.61194 0.00095 0.15598
28 0.7825 0.7801 0.7833 0.78198 0.00164 0.21035
2nd time 20 0.4485 0.4525 0.4557 0.45235 0.00342 0.75667
24 0.6156 0.6174 0.6205 0.61784 0.00246 0.39902
28 0.7850 0.7869 0.7889 0.78695 0.00196 0.24857
3rd time 20 0.4565 0.4592 0.4613 0.45902 0.00238 0.51996
24 0.6216 0.6230 0.6252 0.62329 0.00184 0.29549
Table 4: InterdayPrecision at 254 nm in UV spectroscopy
S. No. Concentration (µg/ml)
Absorbance Mean S.D. %R.S.D.
1st day 20 0.4375 0.4396 0.4435 0.44028 0.00303 0.68966
24 0.6113 0.6114 0.6130 0.61194 0.00095 0.15598
28 0.7825 0.7801 0.7833 0.78198 0.00164 0.21035
2nd day 20 0.4520 0.4539 0.4554 0.45377 0.00170 0.37607
24 0.6194 0.6221 0.6252 0.62223 0.00293 0.47141
28 0.7969 0.7978 0.8004 0.79838 0.00183 0.22912
3rd day 20 0.4661 0.4664 0.4696 0.46736 0.00194 0.41634
24 0.6229 0.6278 0.6269 0.62589 0.00261 0.41710
28 0.7927 0.7958 0.7991 0.79586 0.00318 0.39903
Table 5: Intraday Precision at 697 nm in fluorescence spectroscopy
S. No. Concentration (ng/ml)
Absorbance Mean S.D. %R.S.D.
1st time 12.5 471.89 472.59 472.2 472.23 0.35076 0.07428
25 494.91 493.21 494.17 494.09 0.85237 0.17251
50 517.99 517.99 516.72 517.34 0.63553 0.12285
2nd time 12.5 477.91 476.18 476.87 476.99 0.87089 0.18258
25 498.19 499.72 499.11 499.01 0.77021 0.15435
50 523.29 524.49 525.66 524.48 1.18502 0.22594
3rd time 12.5 481.99 478.21 480.23 480.14 1.8915 0.39394
25 502.81 502.52 503.99 503.11 0.7786 0.15476
50 526.31 523.99 525.83 525.83 1.2246 0.23309
Table 6: InterdayPrecision at 697 nm in fluorescence spectroscopy
S. No. Concentration (ng/ml)
Absorbance Mean S.D. %R.S.D.
Day 1 12.5 471.89 472.59 472.2 472.23 0.35076 0.07428
25 494.91 493.21 494.17 494.09 0.85237 0.17251
50 517.99 517.99 516.72 517.34 0.63553 0.12285
Day 2 12.5 480.97 478.19 481.27 480.14 1.69827 0.35370
25 503.45 501.77 505.29 503.50 1.76060 0.34967
50 522.9 523.78 525.51 524.06 1.32787 0.25338
Day 3 12.5 487.89 485.91 488.18 487.33 1.2354 0.25350
25 507.19 504.85 506.87 506.30 1.2687 0.25059
50 529.09 531.14 532.86 531.03 1.8874 0.35542
Accuracy
Accuracy was determined by calculating the recovery and the mean was determined. The assay values with respect to the label claim of marketed formulation of
arteether in both methods ensure the accuracy of proposed methods. The results of accuracy for UV and
fluorimetric analysis are mentioned in Table 7 and
Table 8 respectively.
Table 7: Accuracy data of UV method
Drug Injection amount (g/ml)
Level of addition (%)
Amount spiked (g/ml)
Amount recovered (g/ml)
Recovery (%)
Average recovery (%)
Arteether
10 80 8 17.97 98.75 99.71
10 100 10 20.06 100.8
10 120 12 21.93 99.58
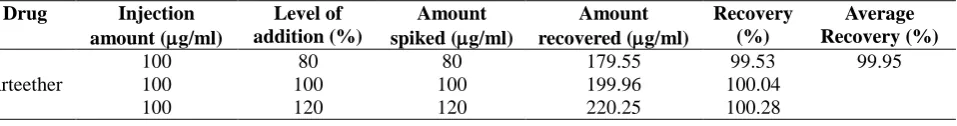
Table 8: Accuracy data of fluorimetric analysis
Drug Injection amount (g/ml)
Level of addition (%)
Amount spiked (g/ml)
Amount recovered (g/ml)
Recovery (%)
Average Recovery (%)
Arteether
100 80 80 179.55 99.53 99.95
100 100 100 199.96 100.04
Robustness
Robustness was calculated by varying the ratio of
solvents and wavelengths and results are shown in Table
9 and Table 10 for UV analysis and in Table 11 for fluorimetric analysis.
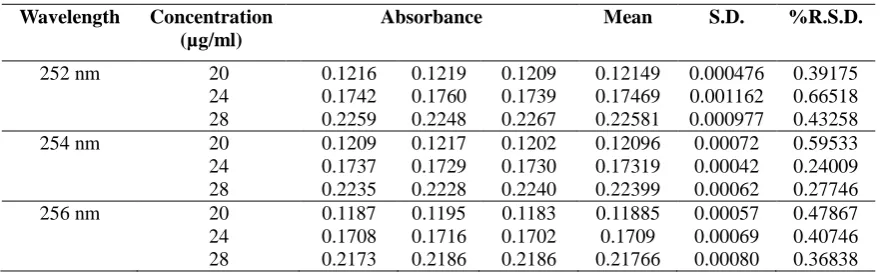
Table 9: Robustness studies (1:9 ratio of HCl:Methanol) in UV estimation
Wavelength Concentration (µg/ml)
Absorbance Mean S.D. %R.S.D.
252 nm 20 0.1216 0.1219 0.1209 0.12149 0.000476 0.39175
24 0.1742 0.1760 0.1739 0.17469 0.001162 0.66518
28 0.2259 0.2248 0.2267 0.22581 0.000977 0.43258
254 nm 20 0.1209 0.1217 0.1202 0.12096 0.00072 0.59533
24 0.1737 0.1729 0.1730 0.17319 0.00042 0.24009
28 0.2235 0.2228 0.2240 0.22399 0.00062 0.27746
256 nm 20 0.1187 0.1195 0.1183 0.11885 0.00057 0.47867
24 0.1708 0.1716 0.1702 0.1709 0.00069 0.40746
28 0.2173 0.2186 0.2186 0.21766 0.00080 0.36838
Table 10: Robustness studies (3:7 ratio of HCl:Methanol)in UV estimation
Wavelength Concentration (µg/ml)
Absorbance Mean S.D. %R.S.D.
252 nm 20 0.4957 0.4948 0.4966 0.49573 0.00089 0.18054
24 0.7872 0.7869 0.7879 0.78734 0.00055 0.06971
28 0.9517 0.9528 0.9521 0.9522 0.00059 0.06197
254 nm 20 0.5030 0.5049 0.5024 0.50347 0.00129 0.25555
24 0.8007 0.8012 0.8028 0.80156 0.00110 0.13775
28 0.9635 0.9629 0.9646 0.96368 0.00089 0.09264
256 nm 20 0.5009 0.5023 0.5039 0.50241 0.00149 0.29713
24 0.7989 0.7972 0.8004 0.79886 0.00159 0.19925
28 0.9591 0.9581 0.9615 0.95958 0.00174 0.18166
Table 11: Robustness data at different wavelengths in fluorimetric analysis
Wavelength Concentration (ng/ml)
Absorbance Mean S.D. %R.S.D.
695 nm 12.5 472.12 473.71 474.10 473.31 1.0489 0.2216
25 479.91 481.29 481.89 481.03 1.0153 0.2111
50 506.78 507.99 506.12 506.96 0.9484 0.1871
697 nm 12.5 475.91 473.72 476.19 475.27 1.3525 0.2846
25 481.81 482.88 483.11 482.60 0.6938 0.1438
50 511.32 509.29 510.81 510.47 1.0561 0.2069
699 nm 12.5 482.33 483.12 482.91 482.79 0.4092 0.0848
25 491.91 492.19 493.01 492.37 0.5717 0.1161
50 517.81 515.19 518.12 517.04 1.6096 0.3113
LOD and LOQ
The LOD and LOQ for UV method were found to be
0.524 g/ml, 1.588 g/ml respectively. The flourimetry
based method was found to be more sensitive, LOD and LOQ, as determined for this method, were 18.77 ng/ml and 61.94 ng/ml respectively.
Statistical comparision of the results obtained by both the developed methods by two way ANOVA and t-test.
To compare the significant difference between the developed methods, two way ANOVA test and t-test were applied to both the methods: UV spectroscopy,
Spectrofluorimetry (Table 12). Assay results in two
marketed formulations were taken in account for performing the ANOVA test. The results of statistical
comparisons are shown in Table 13. Various validation
parameters of both methods developed for estimation of
Table 12: Results of statistical t-test analysis
Method Drug Label
claim
Concentration found
% Purity S.D. % R.S.D. t-test
UV method F1 10 9.91 99.10 0.06 0.64 2.42
F2 10 9.98 99.80 0.01 0.14 2.44
Fluorimetric method
F1 100 100.12 100.12 0.08 0.08 2.45
F2 100 99.92 99.92 0.06 0.06 2.44
tcal =|100 − R|√n/R.S.D., where tcal is the calculated t value, n is the number of replicates, and R is mean accuracy.
Tabulated t-value for 95% two sided confidence interval for 5 degree of freedom was (ttab=) 2.92.
Table 13: Statistical results of one way ANOVA
Statistical parameters (n=3) F-value(Calculated) F-value (Theoretical)
Accuracy 4.41 19.37
Table 14: Validation parameters of developed analytical methods for estimation of α-β Arteether
Validation parameters UV method Fluorimetric method
Absorption maxima (nm) 254 697
Linearity range 8-36μg/ml 6.25-100 ng/ml
Standard Regression equation
Y= 0.0214x + 0.0035 Y=0.9684x 459.17
Correlation coefficient (r2) 0.993 0.992
Accuracy 99.71% 99.95%
Precision Intraday(0.385)
Interday(0.374)
Intraday (0.190) Interday (0.243)
Robustness 1:9 ratio (0.42855)
3:7ratio (0.16403)
0.19635
LOD 0.52408μg/ml 18.77 ng/ml
LOQ 1.58814μg/ml 61.94 ng/ml
DISCUSSION
The proposed methods provide sensitive, precise, economical and accurate UV spectrophotometric as well as fluorimetric method for the estimation of arteether in injection dosage forms. In the UV spectrometric method, methanol was used as solvent and HCl was used for acid decomposition, which induce the formation of UV detectable degradation product. The maximum absorption was found to be 254 nm for UV and 697 nm(emission wavelength) for fluorimetric analysis. The linearity range was found to be 8-36 g/ml with correlation coefficient of 0.993 for UV method. The linearity for fluorimetric method is in range of 6.25-100 ng/ml with correlation coefficient of 0.992. The method was found to be precise as % RSD values for intraday and interday were within the limits less than 2. Accuracy of the proposed methods was determined by the recovery studies and the mean recoveries (% RSD) for the three concentrations were found to be 98.75% (80% spiking), 100.8% (100% spiking), 99.58% (120% spiking) for UV analysis and 99.53% (80% spiking), 100.04% (100% spiking), 100.28% (120% spiking) respectively for fluorimetric analysis. The good % recovery of the drug obtained indicates that the methods are accurate. The proposed method was found to be robust as the % RSD values were found to be less than 2. The limit of detection and limit of quatification for UV and fluorimetric method was found to be 0.524 g/ml, 1.588 g/ml and 18.77 ng/ml, 61.94 ng/ml indicating the methods developed are sensitive. The
calculated F value did not exceed the theoretical value, at 0.05 level of significance, indicating no significant difference with respect to accuracy among the results of developed methods.
CONCLUSION
The developed spectroscopic methods are not only rapid but also simple, sensitive, accurate, and precise and hence used for the routine analysis of arteether in bulk and in pharmaceutical formulation. This method helps us in estimating that in contrast to UV spectrophotometric method, results of fluorimetric analysis were more sensitive and accurate as the accuracy from fluorimetric was 99.95% which is better
than UV method i.e. 99.71%. The LOD and LOQ of
fluorimetric method were 18.77 ng/ml and 61.94 ng/ml whereas that of UV method are 0.524g/ml and 1.588 g/ml indicating that reported fluorimetric method is more sensitive. As the samples with low concentration can be detected by these methods, hence both methods may be applied in pharmaceutical industries for routine estimation as evident by studies on novel drug delivery
system of arteether by author’s group12.
Acknowledgement
Partial financial assistance by Punjab State Council for
Science and Technology, Chandigarh is dully
acknowledged.
REFERENCES
1. Asthana OP, Srivastava JS, Pandey TK, Vishwanathan KA, Dev V, Mahapatra KM, Nayak NC, Balsara AB, Mandal OP, Gupta N, Mishra SK, Multicentric clinical trials for safety and efficacy evaluation of alpha; beta arteether in complicated P. falciparum malaria, The Journal of the Association of Physicians of India. 2001; 49:155-1160. 2. Thakur S, Sharma S, Kumar S, Singh U, Baldi A,
Artemisinin: The ‘Molecule of Hope’ for treatment of malaria, Pharm Aspire, 2013; 4:84-89.
3. Mandal PK, Sarkar N, Pal A, Efficacy of arteether in chloroquine resistant falciparum malaria in eastern India, Indian J. Med. Res, 2004; 119(1):28-32.
4. Agarwal SP, Ali A, Ahuja S, Estimation of artemether and arteether by HPTLC, Asian J.Chem, 2007; 19:4407- 4414. 5. Al-Angary AA, Bayomi MA, Khidr SH, Al-Meshal MA,
Lutfi KM. Determination of arteether in plasma using a simple and rapid high-performance liquid chromatographic assay. Analytical letters. 1994; 27(14):2689-2702.
6. Rajanikanth M, Madhusudanan KP, Gupta RC, A HPLC-MS method for simultaneous estimation of α-β -arteether and its metabolite dihydroartemisinin, in rat plasma for application to pharmacokinetic study, Biomed.Chromatogr.,2004; 17(7):440-446.
7. ICH, Q2 (R1) Validation of analytical procedures: Text and methodology, International Conference on Harmonisation, 1996.
8. Jain D, Bhadra D, Bhadra S, Jain NK, Direct UV Spectrophotometric estimation of -arteether, Indian Journal of Pharmaceutical Sciences, 2005; 67(4):506-507.
9. Baldi A, Panwar M S, Swapnil G, Development and validation of spectrophotometric method for determination of ropinirole hydrochloride in bulk and formulation, Inventi Rapid: Pharm Analysis & Quality Assurance, 2015; 1:1-4. 10. Singh U, Baldi A, Simultaneous estimation of quercetin and
silymarin: Method development and validation, International Journal of Pharmaceutical Biological Archive, 2013; 4(3):527-531.