in t h e p r of e s sio n al d e v el o p m e n t of t e a c h e r e d u c a t o r s . Te a c h e r
E d u c a ti o n Adv a n c e m e n t N e t w o r k Jo u r n al (TEA N), 6 ( 1). p p . 3
0-4 0 .
Do w n l o a d e d fr o m : h t t p ://i n si g h t . c u m b r i a . a c . u k /i d/ e p ri n t/ 1 5 1 0 /
U s a g e o f a n y i t e m s f r o m t h e U n i v e r s i t y o f C u m b r i a’ s i n s t i t u t i o n a l r e p o s i t o r y ‘I n s i g h t ’ m u s t c o n f o r m t o t h e f o l l o w i n g f a i r u s a g e g u i d e l i n e s .
Any it e m a n d it s a s s o ci a t e d m e t a d a t a h el d i n t h e U niv e r si ty of C u m b r i a ’s in s ti t u ti o n al r e p o si t o r y I n si g h t ( u nl e s s s t a t e d o t h e r wi s e o n t h e m e t a d a t a r e c o r d ) m a y b e c o pi e d , di s pl ay e d o r p e rf o r m e d , a n d s t o r e d i n li n e wi t h t h e JIS C f ai r d e a li n g g ui d eli n e s ( av ail a bl e
h e r e) fo r e d u c a t i o n al a n d n o t-fo r-p r ofi t a c tiviti e s
p r o v i d e d t h a t
• t h e a u t h o r s , ti tl e a n d full bi blio g r a p h i c d e t ail s of t h e it e m a r e ci t e d cl e a rly w h e n a n y p a r t
of t h e w o r k is r ef e r r e d t o v e r b a lly o r i n t h e w ri t t e n fo r m
• a h y p e rli n k/ U RL t o t h e o ri gi n al I n si g h t r e c o r d of t h a t it e m is i n cl u d e d i n a n y ci t a ti o n s of t h e w o r k
• t h e c o n t e n t is n o t c h a n g e d i n a n y w a y
• all fil e s r e q ui r e d fo r u s a g e of t h e it e m a r e k e p t t o g e t h e r wi t h t h e m a i n it e m fil e.
Yo u m a y n o t
• s ell a n y p a r t of a n it e m
• r e f e r t o a n y p a r t of a n it e m wi t h o u t ci t a ti o n
• a m e n d a n y it e m o r c o n t e x t u ali s e it i n a w a y t h a t will i m p u g n t h e c r e a t o r ’s r e p u t a t i o n
• r e m ov e o r a l t e r t h e c o py ri g h t s t a t e m e n t o n a n it e m .
T h e full p oli cy c a n b e fo u n d h e r e.
Alt e r n a t iv ely c o n t a c t t h e U niv e r si t y of C u m b ri a R e p o si t o ry E di t o r b y e m a ili n g
Citation:
Hryniewicz, L., Griffiths, V., Thompson, S. (2014) ‘Living graphs as a methodological tool representing landmarks in the professional development of teacher educators’, Tean Journal, 6(1), pp.30-40.
30
Living graphs as a methodological tool: representing landmarks in the professional development of teacher educators
Teacher Education Advancement Network Journal Copyright © 2014 University of Cumbria Vol 6 (1) pages 30-40
Liz Hryniewicz*, Vivienne Griffiths*, Simon Thompson** *Canterbury Christ Church University
*University of Sussex
Abstract
This article relates to the use of an innovative visual research method, living graphs, to capture and represent the life experiences of teacher educators in two universities in the UK. Six mid-career teacher educators from each university were asked to map their personal biographies, career landmarks, academic and research highs and lows, using a graphic format. This was then used as a basis for discussion and exploration in the interviews. Narrative analysis was used to examine the teacher educators’ accounts and themes were identified which related to professional and academic development. Living graphs were found to be a rich data source to identify and explore career landmarks: enhanced verbal input resulted from using graphics to represent highs and lows of experience, including the visual representation of emotion. This is a useful research tool but needs further clarification and guidelines for use.
Keywords
Living graphs; visual methods; teacher educators; professional development; career landmarks.
Introduction and background
There is increasing interest in the re-conceptualisation of the role of teacher educators and in particular, their professional, academic and research development (Cochrane-Smith, 2005; Smith, 2003). This article relates to the use of an innovative visual research method, living graphs, to
capture and represent the life experiences of teacher educators in two universities in the UK. We will present some findings from a longitudinal research project on the professional and academic
development of early and mid-career teacher educators (Griffiths, Thompson and Hryniewicz, 2010, 2013). The research focused on landmark events and critical incidents, as well as factors affecting teacher educators’ development and changing identities over time. These have been focused on in other studies (Harrison and McKeon, 2010; Swennen at al., 2010); the original feature of our research is the use of the participatory graphical method of living graphs alongside interview data.
The research questions were:
What are key features of the career development of teacher educators?
What are the major factors affecting the professional and academic development of teacher
educators?
What landmark events and critical incidents mark stages in this development?
This paper will discuss the effectiveness of living graphs as a methodological tool to illuminate teacher educators’ experiences and development.
Visual research methods
31 developing area of social enquiry and there is an evolving visual culture in research in social science and more particularly, in education (O’Brien et al., 2012; Pauwels, 2010; Reavey, 2011; Rose, 2001; Spencer, 2011). This has often involved the use of photographs and artefacts in research, which are used to stimulate discussion (Pimlott-Wilson, 2012). More recently there has been a focus on the use of alternative forms of visual images such as diagrams, drawings and maps (Bagnoli, 2009; Iantaffi, 2011; Jackson, 2012), particularly with children in educational settings (O’Brien et al., 2012).
Pauwels (2010) has identified two kinds of visual images used in research: pre-existing visual images, such as photographs, pictures, cartoons and website content and respondent-generated imagery, which is produced by participants specifically during the research process. These can be
photographs, drawings or diagrams. Rose (2001) identified three sites or levels when using images generated by respondents: the production of the image; the image itself; and how it is read by different audiences and stressed the importance of giving attention to all these levels.
Respondent-generated visual images
Researchers often use respondent-generated images to give participants more control over the research process and to generate new insights from the participants’ point of view. Many studies use these visual methods with children and young people, in order to elicit their views in a direct and motivating way (Cox and Robinson-Pant, 2003; Pimlott-Wilson, 2012). For instance, Cremin et al. (2011: 5) used pupil-generated photographs with 13-14 year-olds to use as a prompt during interviews and to help explore ‘issues of identity and schooling that might be difficult to put into words’. Used in this way, the use of such visual methods can be seen as both inclusive and
potentially transformative. For example, Miles et al. (2005) describe a range of visual methods used in action research projects in Zambia and Tanzania, in order to include participants in a meaningful way. These included mind-mapping (visual brainstorming), making posters, photography, video-recording and mountain pictures, as well as more traditional research methods.
Diagrams and drawings created specifically during research can also be useful when dealing with complex and challenging life stories which may be difficult to articulate in words. Iantaffi (2011) drew on concepts from personal construct theory (Kelly, 1955) to investigate the experiences of women with disabilities accessing higher education. She asked them to draw their life as a ‘river of experience’, represented by a winding snake-like river. As Iantaffi emphasises, using such visual metaphors enables other people’s constructs to become visible, as a way of making sense of the world.
Bagnoli (2009:547) found asking participants to create a timeline was helpful in encouraging young people to reflect on their past and future lives, relationships and events that had particular
importance to them within a temporal framework. She used three types of graphic elicitation: a self –portrait, a relational map and a timeline of experience alongside interviews to gain greater insight into the narratives of identity of young migrants in a study in UK and Italy. She argues that this process ‘can open up participants’ interpretations of questions, and allow a creative way of interviewing that is responsive to participants’ own meanings and associations’. However, the method was less helpful with young people who had learning difficulties, as they found the concept of time difficult to grasp.
Living Graphs and Timelines
32 own research was adapted from a strategy often used in history teaching to represent sequences and patterns over time, with positive or negative consequences. Dawson (undated) writes that the use of a ‘timeline with attitude’ and ‘the charting of changing attitudes or emotions…opens up controversy, debate.’
Zimmerman (2006), in an innovative study of home class teachers in Israel, used living graphs
alongside in-depth interviews, as a way of eliciting detailed information about critical incidents in the respondents’ teaching careers. She employed a sophisticated method of narrative analysis to
interpret the resulting life stories and graphic timelines.
In a study of people with substance abuse, Berends (2011: 1) notes that interview questions can be ‘conceptualised as instances of power, where the interviewer controls the orientation, focus and sequence of the narrative’. In contrast the process of constructing a timeline can give the participant the opportunity to be more creative and fluid, moving through time and place using annotation, imagery and self-expression. It is less controlled by the interviewer (Jackson, 2012; Sheridan et al., 2011). Both Berends (2011) and Iantaffi (2011) warn against the over-reliance on words as symbols in accessing and representing complex layers of experience. Drawing can provide access to thoughts, feelings and beliefs which are difficult to express verbally.
The process of constructing a timeline is an active process and Sheridan et al. (2011) found that asking respondents to plot their weight over time in a graph served to distract their participants from what might have been an intrusive and troubling interview process on a sensitive subject. However, Jackson (2012) critiqued the use of the drawing of visual timelines to represent and investigate lived multi-racial experience. She found that although participants often recalled additional, relevant experience in interviews during the production of the timeline, it was important that they were reassured that their drawing skills were not the focus for the research to enable them to engage fully. There can be other more troubling ethical issues in the use of
respondent-generated data.
Ethical Issues in the use of respondent-generated visual data
Using respondent-generated imagery can give research participants more control over the research process and generate greater insights to their perspective but Wiles et al. (2012) draw attention to a range of ethical issues involved in using visual methods, especially problems around the
identification and anonymity of participants.Concerns have also been raised about the context in which images are produced and the format in which they can be kept and reproduced at a later date. Visual images may be in a form which makes them more instantly accessible or recognisable than interview transcripts, for example.
Lomax (2012) emphasises that researchers must give particular attention to the ways in which children’s voices are differently interpreted and often unequally heard in research and this is particularly relevant when they are asked to produce visual data which will be seen and interpreted by others. A good example of this kind of process, used ethically, is a study of school inclusion in South Africa (Engelbrecht, 2011), where researchers wanted to understand school experiences and cultures through the eyes of students. The children were asked to take photographs of where they felt most welcome and unwelcome in the school and were then asked why they chose the particular images and what they meant to them. In Engelbrecht’s (2011) study, due attention was given to all three levels noted by Rose (2001) and the process highlighted in a direct, personal way some instances of inclusionary and exclusionary practices.
33 Wall et al., 2012). For example, Barker and Smith (2012) argue that the interpretation of visual methods such as photographs should be undertaken with children to ensure their intended meaning is understood rather than the interpretations of adult researchers.
Methodology
An embedded case study approach was used in the study overall (Cohen et al., 2007; Yin, 2003), with two universities in the UK. For this stage of the research, in-depth biographical interviews were used with 12 teacher educators (six female, six male), together with the use of living graphs. All the UK teacher educators had substantial previous experience in schools or colleges before becoming university lecturers. At the time of interviewing, all the interviewees had between seven and 20 years’ experience in teacher education at one or more universities. Four had completed a PhD; the others had MAs and were completing PhDs. Further details about the process and interview findings are included in Griffiths et al. (2013).
We particularly focussed on ‘critical incidents’ as career landmarks (Tripp, 1994) in the interviews. Living graphs were constructed as concept maps to chart, guide and enhance the discussion (Zimmerman, 2006). A situated learning framework was central to the research, with contextual factors in the two universities having a profound impact on the teacher educators’ research experiences (Griffiths, Thompson and Hryniewicz, 2010; 2013).
The living graphs were created using a timeline as a horizontal axis, and affective responses in relation to professional development and identity as the vertical axis (similar to Dawson, undated; Deaney and Wilson, 2011). Participants were asked to map their personal biographies, academic and research highs and lows, career landmarks, perceived barriers and successes, using this graphic format. This was then used as a basis for discussion and exploration in the interviews. Respondents were also asked to reflect on the use of living graphs as a research tool.
As Zimmerman (2006) found, the passage of time is easy to represent using an axis; and as in Iantaffi’s research (2011), participants had a choice about the start time, which added another layer to the data. Over time, we introduced the use of multiple lines and colours to represent different aspects of teacher educators’ career biographies. The research team also trialled different approaches in order to test their effectiveness, with each researcher giving slightly different instructions; we acknowledge that this will have had an effect on the resulting graphs and data analysis. For example, one researcher allowed participants time to compile the graphs, followed by the interview, while the others undertook the interviews and living graphs simultaneously. Another researcher used a graphic format with the horizontal axis in the middle of the graph, while the others positioned it at the bottom. The third researcher kept notes, enabling the process of the construction of the graphs to be recorded alongside the interviews. These differences will be reflected on later. In addition, one of the researchers became a respondent in the research, while another trialled the method in a research methods workshop, in order to experience the approach first hand.
The living graphs and interview extracts presented below represent only a small part of the data collected. In one case, a participant withdrew permission to use his graph after it was presented at a seminar at one of the universities, as he felt that the visual representation of his academic career compromised his anonymity, in a way that interview extracts did not (as in Wiles et al., 2012). In other cases, the amount of textual material added to the graphs also made anonymisation difficult and it was decided not to show these particular graphs. In those presented, we have sometimes had to block out certain names or words to protect the identity of participants; we have also not
34 methodological analysis of the graphs, with extracts from the interviews used for by way of
comparison or contrast.
Findings
Fig.1. Living graph, teacher educator 1.
This was the first living graph that we did. The interviewee drew everything using one line to represent the trajectory of her academic career. The description of the highs and lows matched the graph exactly as each landmark and critical incident was explained.
‘In 2002 I moved into HE and it was a really steep learning curve even though I had done one year of an MA. This was a real high but it dropped as I got more used to the programme and as I got more confident. In 2004 it rose again when the university was really keen to offer
opportunities for staff to be involved in research – and for my own personal development. From 2006-7 there was a really steep decline because I changed jobs and moved to another University. Here there was a far greater teaching responsibility [in ITE] – in fact it was unworkable – it was not possible to do any personal research. I taught every day for often six hours – sometimes 24 hours a week’
(Teacher educator 1).
We got the idea of using more than one line to represent different aspects of teacher educators’ career experiences from another participant, who asked the interviewer:
‘Would it muck you up if I did two lines? One to represent my teaching and the other one to represent my research and publishing.’
The resulting graph is shown in Fig. 2.
35 For this teacher educator, teaching had been a largely upward curve, with a more recent downward dip as new requirements for ITE were brought in, which he felt diminished some of the values and priorities he thought were important in teaching. Unlike many of our respondents, research was a steady line, as he had a continuous publication record. His description elaborated on what he had drawn, but did not follow it exactly. However, drawing the graph, he told us, prompted his reflections:
‘I think that feeling… that involvement with one’s wider professional community is hugely
valuable and that’s something which isn’t reflected in the publications graph, a steady line of satisfaction as it were, but certainly has fed in and that is why I put teaching lower at the beginning and much higher at the end’
(Teacher educator 2).
In the two previous examples, the respondent had compiled the graph before the interview. In the next case, the teacher educator explained the trajectory he was drawing as he went, marking each landmark clearly on the graph as he talked.
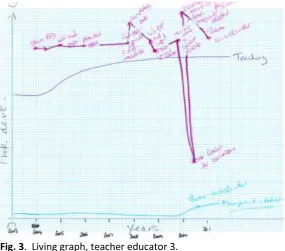
Fig. 3. Living graph, teacher educator 3.
Here, the existence of notes made at the time enables one to see how the graph was constructed and whether or not it matches the interview account:
‘Teaching, I’ve always been confident. It’s more fluid and samey (draws on graph). Management, I’ve never had intrinsic reward (draws line low down). Research is all high (marks on graph). In 2004 I started my PhD. I’d wanted to do it for five years. It’s a key component of research – a vital step… I completed my PhD in four years (noted as a high) – I set a challenge. It was accepted with no changes. One of the key things about research: it has to be of intrinsic interest. It’s about meeting challenges, personal challenges ... I’m lucky there’s no downsides. My biggest down was the university’s decision not to have Readers for a year (marks this very low). I was going to apply for PL (Principal Lecturer) this autumn and Reader next autumn. I’ve never felt I needed more time till now. I had study leave to finish my PhD. I’ve reached a critical level, shown potential, but no compensation. My goal is to be a Reader to free up time. My personal challenge is to become a Professor’
36 What is striking in this account is the number of personal challenges that the interviewee is setting himself and the priority given to research goals and successes. There is a marked contradiction, however, between the comment, ‘I’m lucky there’s no downsides’, followed immediately by an explanation of ‘My biggest down’. On the accompanying graph, the eye is drawn immediately to the major dip in the middle. Arguably, this is more striking visually than the interview account, which almost glosses over this episode as a minor hitch in an otherwise uninterrupted, proposed trajectory to Professor.
It was noticeable that the expression of emotion in relation to events was reflected directly in other living graphs too. For example, one teacher educator described quite traumatic events surrounding a large research project, which she led alongside a heavy teaching load. The existence of notes as this happened again helped to show the process, as shown below:
‘So if I’m talking about learning, I learnt, I suppose I learnt. I learnt (her emphasis). So that was the learning curve (draws curly lines going up). This was the emotional curve (does dark
squiggles low down). Um, so I learnt, I learnt how to manage things… If I had a project like that again I’d do it totally differently. It took my blood. It was so negative, that when it was over - and I don’t feel it at all now - I never - wanted - to - see it - again (speaks slowly). And it had more research in it, a wealth of stuff, and I’ve still got all the stuff…So I could have got books and papers, but it was emotionally so draining, I just put it all in boxes and I’ve never got it out again. So that was here (points to graph). If I put this sort of here (marks paper hard) Draining. Terrible’
(Teacher educator 4).
The account was accompanied and enhanced by the image that was being created simultaneously; heavy, black clouds reflected the dark feelings that were being expressed.
However, in other cases, there was not the same congruence between the living graph and the interview account. For instance, one interviewer described in detail how doing a PhD was like ‘the dark night of the soul’ (teacher educator 5), but the dip in the living graph is counterbalanced by a series of upward lines that make the whole look smooth and relatively uneventful. Conversely, in another case, the living graph revealed emotions that were not being expressed in the interview.
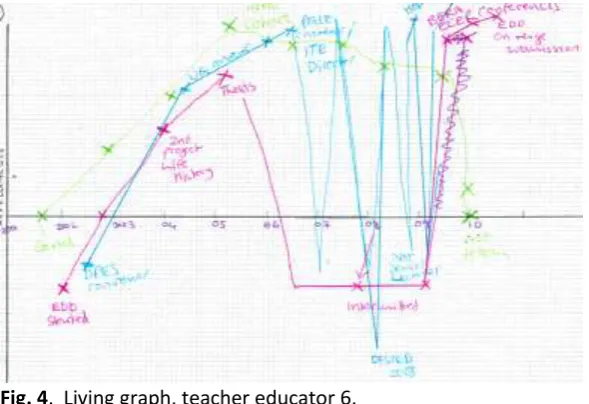
Fig. 4. Living graph, teacher educator 6.
37 appointments and coincided with an interruption to the interviewee’s PhD (shown in purple). The living graph showed the extremes of experience more starkly than the interview account, which was far more positive overall:
‘The research was very positive. I saw myself moving forward, being recognised as a lecturer rather than an ITE tutor… Then I stopped doing research...other roles dominated my time’
(Teacher educator 6).
The final sentence, about stopping research, is almost an afterthought in the interview, whilst on the living graph it shows as a major life event.
Eraut (2007) identified expectations, relationships, balance or overload, as key contextual factors. For instance, one graph listed contextual factors as negatives, such as ‘Workload stops you doing important things, ‘Lack admin support’, as well as the more general ‘Dealing with problems’ and external factors such as Ofsted (Teacher educator 7). As we can see in the examples shown, many interviewees wrote quite a lot on their graphs, to indicate the event or factor that was significant. This enables the graphs to stand alone without the additional commentary given by the interviewee, although the written notes on the graphs do make the participant more identifiable. So, how
effective were the graphs in representing the lived experiences and academic and research development of teacher educators?
Strengths and drawbacks of living graphs
Living graphs were found to be a rich data source to identify and explore landmarks, positive features and barriers to development. They proved a powerful way to represent experiences, either by explaining and reflecting while drawing, or using drawing as a prompt to talk, demonstrating the richness of data in which life experiences are constructed (Spencer, 2011).
Other people’s constructs as a way of making sense of the world are shown very clearly in visual form as Iantaffi suggests (2011). The participant has a choice about their start time and about which episodes or critical incidents to include. Bagnoli (2009) has noted that timelines suggest a forward facing trajectory, when people may see their experience in a more circular way, but Sheridan et al. (2011) have found that the constraints imposed by this are probably no different from that imposed by the structure of an interview. In practice, the structure of the timeline still enabled participants to go back over their drawing and explain and amend it in a way they might not have been able to do so easily within a structured interview. Although not relevant in this study, Bagnoli’s critique of timelines with certain respondents would need to be taken into account if using graphs with young children or adults with learning difficulties. Overall, however, while the passage of time can also be represented in drawings and diagrams, it is easier to represent this using an axis.
Furthermore, language alone can be a limiting factor and the use of graphic images can produce a far more layered and complex representation of lived experiences (Berends, 2011; Reavey, 2011). Using graphics to represent highs and lows of experience, for example, showed an explicit and easily represented immediate view of emotion, which then enhanced the verbal input in the interview. Using the visual timelines may also enable participants to give a more in-depth and authentic representation of the lived experience of their careers, if the expression of emotion in words is seen as restricted within an organisational culture (Mazzetti and Blenkinsopp, 2012).
Visual representation through living graphs provides a two-dimensional approach, as represented in the examples where research subjects say one thing and draw another. These findings are
38 The familiarity of the interview process also carries a risk (King and Horrocks, 2010). Interviewees can construct an account which can be filtered in a particular way, such as excluding negative events, as we found in some of the examples. The graphs enable an extension from the interview questions by the research subject, rather than being controlled and shaped by the interviewer. Participants have more control over the whole process and their voices are less filtered through the researcher (Iantaffi, 2011).
Having now used this method several times, questions have arisen within the research team about the most effective approach to using living graphs in research; for instance, whether to recommend a simultaneous process or the separate construction of the graphs. It seems to us that there are pros and cons to each approach: drawing the graph first enables the participant to have more control away from the researcher and to engage in greater reflection; whilst simultaneity carries with it directness and a power of expressed emotion, as well as the practical advantage of the researcher being able to record the process. Two of the research team have tried the process directly, and emphasise that the emotional component of the process should not be underestimated and this should be made clear to participants. In addition, ethical issues associated with the use of living graphs need to be addressed clearly with participants, particularly the impact of seeing their graphic representations of challenging events at a later time or the recognisability of some images which inhibits anonymity (Wiles et al., 2012); this was an unforeseen dimension of the process when we used it and has only emerged during analysis and dissemination.
Overall, living graphs are a useful research tool, but need further clarification and guidelines for use, including procedures while they are drawn, interpretation and analysis and the ethical dimensions of their use. Nevertheless, several of our interviewees were so struck by the power and directness of this approach that they have gone on to use it in their own teaching and research, with equally powerful results.
References
AIPC (2010) Working with young children. Available at: http://www.aipc.net.au/articles/working-with-young-children/ (Accessed: 02 December 2013).
Bagnoli, A. (2009) Beyond the standard interview: the use of graphic elicitation and arts-based methods, Qualitative Research, 9(5), pp.547-540.
Barker, J. and Smith, F. (2012) What’s in focus? A critical discussion of photography, children and young people, International Journal of Social Research Methodology, 15(2), pp.91-103. Berends, L. (2011) Embracing the visual: using timelines with in-depth interviews on substance use
and treatment, The Qualitative Report, 16(1), pp. 1-9.
Burr, V., King, N. and Butt, T. (2012) Personal construct psychology methods for qualitative research,
International Journal of Social Research Methodology, pp.1-15.
Cochran-Smith, M. (2005) Teacher educators as researchers: multiple perspectives, Teaching and
Teacher Education, 21 (2), pp. 219–225.
Cohen, L., L. Manion, and Morrison, K. (2007) Research methods in education. 6th edition. London: RoutledgeFalmer.
Cox, S. and Robinson-Pant, A. (2003) Empowering children through visual communication. Norwich, UK: The University of East Anglia.
Cremin, H., Mason, C. and Busher, H. (2011) Problematising pupil voice using visual methods: findings from a study of engaged and disaffected pupils in an urban secondary school, British
Educational Research Journal, 37(4), pp.585–603.
Dawson (undated) Timelines & Living Graph Activities
.
Available at:39 Deaney, R. and Wilson, E. (2011) Drawing From Experience: Use of ‘Reflection Lines’ in Stimulated
Recall Interviews, BERA conference, Institute of Education, London, 6-8 September.
Eraut, M. (2007) Learning from other people in the workplace, Oxford Review of Education, 33(4), pp.403-422.
Griffiths, V., Thompson, S. and Hryniewicz, L. (2010) Developing a research profile: mentoring and support for teacher educators, Professional Development in Education, 36(1-2), pp. 245-262. Griffiths, V., Thompson, S. and Hryniewicz, L. (2013) Landmarks in the professional and academic
development of mid-career teacher educators, European Journal of Teacher Education, 37(1), pp. 74-90. doi: 10.1080/02619768.2013.825241.
Harrison, J.K. and McKeon, F. (2010) Perceptions of beginning teacher educators of their
development in research and scholarship: identifying the ‘turning point’ experiences, Journal
of Education of Teachers,36(1), pp.19-34.
Iantaffi, A. (2011) Travelling along ‘rivers of experience’: personal construct psychology and visual metaphors in research, in: Reavey, P. (ed.), Visual psychologies: using and interpreting images
in qualitative research. Hove: Psychology Press, pp. 271-283.
Jackson, K. (2012) Participatory diagramming in social work research: utilizing visual timelines to interpret the complexities of the lived multiracial experience, Qualitative Social Work, 12(4), pp.414–432.
Kelly, G.A. (1955) The psychology of personal constructs. New York: Norton. King, N. and Horrocks, C. (2010) Interviews in qualitative research. London: Sage.
Lomax, H. (2012) Contested voices? Methodological tensions in creative visual research with children, International Journal of Social Research Methodology, 15(2), pp.105-117.
Mazzetti, A., and Blenkinsopp, J. (2012) Evaluating a visual timeline methodology for appraisal and coping research, Journal of Occupational and Organizational Psychology, 85(4), pp.649–665. Miles, S., Lewis, I. and Ainscow, M. (2005) Learning from difference: an action research guide for
capturing the experience of developing inclusive education. Manchester: Enabling Education
Network.
O'Brien, M., Varga-Atkins, T., Umoquit, M., & Tso, P. (2012) Cultural–historical activity theory and ‘the visual’ in research: exploring the ontological consequences of the use of visual methods,
International Journal of Research & Method in Education, 35(3), pp.251-268.
Pauwels, L (2010) Visual sociology reframed: an analytical synthesis and discussion of visual methods in social and cultural research, Sociological Methods and Research, 38(4), pp.545-581.
Pimlott-Wilson, H. (2012) Visualising children’s participation in research: Lego Duplo, rainbows and clouds and moodboards, International Journal of Social Research Methodology, 15(2), pp.135-148.
Reavey, P. (ed.) (2011) Visual psychologies: using and interpreting images in qualitative research. London: Routledge.
Rose, G. (2001)Visual methodologies: an introduction to the interpretation of visual materials. London: Sage.
Sheridan, J., Chamberlain, K., and Dupuis, A. (2011) Timelining: visualising experience, Qualitative
Research, 11(5), pp. 552-569.
Smith, K. (2003) So, what about the professional development of teacher educators? European
Journal of Teacher Education, 26(2), pp. 201–215.
Spencer, S. (ed.) (2011) Visual research methods in the social sciences: awakening visions. London: Routledge.
Swennen, A., Jones, K. and Volman, M. (2010) Teacher educators, their identities, sub-identities and implications for professional development, Professional Development in Education, 36(1–2), pp. 131–148.
Tripp, D. (1994) Teachers’ lives, critical incidents, and professional practice, International, Journal of
40 Wall, K., Hall, E. and Woolner, P. (2012) Visual methodology: previously, now and in the future,
International Journal of Research & Method in Education, 35(3), pp.223-226.
Wiles, R., Coffey, A., Robinson, J. and Heath, S. (2012) Anonymisation and visual images: issues of respect, ‘voice’ and protection, International Journal of Social Research Methodology, 15(1), pp. 41-53.
Yin, R.K. (2003) Case study research: design and methods. 3rd edition. London, Sage. Zimmerman, V. (2006) The professional development of home class teachers: a case study.