Y. Temjenzulu Jamir*
Department of Economics,Nagaland University, Lumami. Pin-798627, Nagaland, IndiaABSTRACT
This paper reviews the changing population profile of Nagaland by examining its size, growth and structure and also makes a comparative study among the districts. The study finds that the compound annual growth rate of population from 1901-2011 is 2.74%. The highest compound annual growth rate was recorded during 1951-61 with 5.66% and the lowest during 2001-2011 with -0.05%. Almost half of the population resides in three districts viz- Kohima, Dimapur and Mon constituting 46% of the total population. Nagaland recorded the highest growth rate in India during 1981-1991 and 1991-2001 with a decadal growth of 56.08% 64.53% which was not only highest in India but highest among the world and during 2001-2011 it recorded the lowest growth rate in India, in fact, it recorded a negative growth of -0.05%. During the last decade, 2001-2011 the state witnessed almost 12% increase in urban population, but the growth was mainly concentrated in Kohima and Dimapur districts. Literacy rate increased from 22 % to 80 % during 1961-2011, while sex ratio declined to 931 from 973 during 1901-2011.
Keywords: Census, advance, and backward districts
Address for correspondence
Y. Temjenzulu Jamir: Department of Economics, Nagaland University, Lumami. Pin-798627, Nagaland, India E-mail: [email protected]
Access this article online
Publisher Website:
http://www.ndpublisher.in
DOI: 10.5958/0976-4666.2016.00029.2 The manner and rate at which an economy develops relies heavily on the growth of population and its various principle aspects viz-size and growth, distribution, sex composition, literacy, rural-urban population, birth rate, death rate, the density of population, etc. The growth
the coming years. Currently, it is estimated that it will become less than 1% by 2020 and less than 0.5% by 2050
(United Nations Department of Economic and Social Affairs).
Most countries especially Asian, African and Latin American are going through a period of unprecedentedly rapid population growth. India too experienced rapid population growth between 1960 and 2000, with the population increasing from 448 million to 1.04 billion. During the same period Nagaland also experienced a fast growth with a compound annual growth rate of 4.57% and like many of the states in India especially the northeastern states, this was not accompanied by steady appreciable economic growth. This paper examines the dynamics of population in Nagaland by looking at the various principle aspects of population and also make a comparative study among the districts, based entirely on secondary data taken from various sources viz- Statistical handbooks of Nagaland, Government of Nagaland, Sample Registration system, Office of the Registrar General of India, Ministry of Home Affairs and census of India.
Population Size and Growth
The state of Nagaland comprises eleven districts viz- Kohima, Mokokchung, Zunheboto, Wokha, Mon, Tuensang, Phek, Dimapur, Longleng, Peren and Kiphire with Kohima as the state’s capital. The district of Phek, Peren and Dimapur were carved out of Kohima district while the district of Kiphire and Longleng were created from Tuensang district. The state of Nagaland comprising 16 major tribes and other sub-tribes constitute almost 87% of the entire population. The percentage of scheduled tribe which was 93.1% during 1961 declined to a low of 84% in 1981 and steadily increased to 86.5% during 2011. According to 2011 census, scheduled tribe population in rural areas constituted 93% while in urban areas it was around 57% only. Among the districts, Tuensang district has the highest percentage of scheduled tribe population with 97.11% followed by Zunheboto with 97.02%. The lowest percentage of scheduled tribe population is in Dimapur district with 59.13%.
The Population Census of India covered Nagaland for the first time in 1901, covering almost the entire region
of the present State of Nagaland except for the district of Tuensang. It was during 1951 that an area covering 129.5 sq.km of Tuensang District was censused for the first time and only during the Seventh Census of India the entire Tuensang District covering an area of 5356.1 Sq.km was covered. As per census 2011, Tuensang district has a total area of 2536 Sq.km, which is 15.30% of the total area and is the largest community regarding area and Longleng with 562 Sq.km is the smallest district.
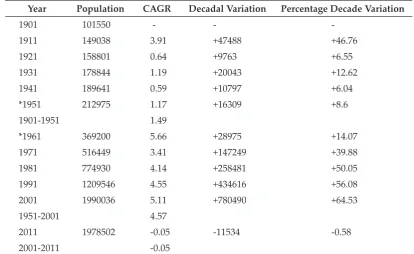
Nagaland with a total area of 16,579 sq.km has a total population of 19,78,502 (population census 2011), of which 10,24,649 (51.79%) are male and 953853 (48.21%) are female. The total area and total population of Nagaland to the total area of India is 0.50% and 0.16% respectively. From 1.01 lakh in 1901 population increased to 19.79 lakh in 2011. An interesting feature of the growth of population in Nagaland is that, during 1981-1991 and 1991-2001, it recorded the highest growth rate in India, with a decadal growth of 56.08% 64.53% which was not only highest in India but highest among the world, and during 2001-2011 it recorded the lowest growth rate in India. In fact, the state recorded a negative growth. The absolute decrease in population was 11,534 with a decadal growth of -0.58 and the annual growth rate -0.05%. From 1901 till 2011 the compound annual growth rate is 2.74%.
CAGR-Compound Annual Growth rate; * Decadal variation and percentage of decade variation 1951 and 1961 population of Tuensang District has not been taken into account as the area was censused for the first time in 1951. Tuensang District was censused for the first time in 1951 with an area of 129.5 Sq.km. and in 1961 the censused area increased to 5356.1 Sq.kms.
population grew at a compound annual increase rate of 1.49% which was slightly higher than the national growth of 1.06%. The absolute increase in population over the 50 years period was 1.1 lakh. The maximum growth rate was recorded during 1901-1911 with 3.91% and lowest during 1931-1941 with 0.59%. It is to be noted that Tuensang district was censused for the first time in 1951 for an area of 129.5 Sq.km.
Second Phase (1951-2001). This phase can be termed as the period of rapid growth. The second phase was
characterised by a very fast growth in the population especially during the last twenty years of the period. The total absolute increase during this entire period was 17.7 lakh and the compound growth rate was 4.57% which is very high compared to the period 1901-1951. In 1961 the entire area of Tuensang district covering an area of 5356.1 Sq.km was censused, and the absolute increase in population from 1951-1961 was 28,975 persons with a decadal growth of 14.07%. It was from 1981 that the annual population growth rate was over 4%. During Table 1: Trends of population growth in Nagaland
Year Population CAGR Decadal Variation Percentage Decade Variation
1901 101550 - -
-1911 149038 3.91 +47488 +46.76
1921 158801 0.64 +9763 +6.55
1931 178844 1.19 +20043 +12.62
1941 189641 0.59 +10797 +6.04
*1951 212975 1.17 +16309 +8.6
1901-1951 1.49
*1961 369200 5.66 +28975 +14.07
1971 516449 3.41 +147249 +39.88
1981 774930 4.14 +258481 +50.05
1991 1209546 4.55 +434616 +56.08
2001 1990036 5.11 +780490 +64.53
1951-2001 4.57
2011 1978502 -0.05 -11534 -0.58
2001-2011 -0.05
Source: Statistical Handbooks of Nagaland, GoN
1981-1991 and 1991-2001, Nagaland recorded the highest population growth rate in India. The decadal growth during these periods was 56.08 % and 64.53 % which was almost three times higher than the national average. Among the districts, Wokha recorded the highest decadal growth with 95.16% while Phek recorded the lowest with 45.07% during 2001-2011.
Third Phase (2001-2011). Though it may be too early to draw any conclusion, the third phase, which starts from 2001 can be termed as the period of stagnation. During the period 2001-2011 the state witnessed an absolute decline in population in the absence of war, famine, natural calamities, political disturbances, or any significant changes in its socio-economic characteristics (The Hindu, July 12, 2012). The census of 2001 was found heavily inflated and later on having found fault the Government of Nagaland ultimately rejected the population census of 2001. From 2001-2011, the decline in population was 11,534 persons and the decadal variation during this period was -0.58%.
Population distribution
The changing pattern of population distribution among the districts is the result of changes in decadal growth rates, which is the outcome of migration, immigration and natural growth rates. The geographic distribution of population is studied in the form of the district- wise population and density of population. A study of population distribution in Nagaland indicates that almost 20% of the population lives in Dimapur of which 52.2% is in an urban area. Dimapur district with a population of 3,78,811 persons is the commercial district of Nagaland having a railway and Air connectivity. Compared to all other districts more than half of its area is plain making it ideal for establishing medium and even large industries along with large-scale agriculture and allied activities. Next to Dimapur the second most populated district is Kohima with 14%, and the least populated district is Longleng with only 3%. Kohima district which is the state capital was the most populated area for an extended period but with the creation of Dimapur and Peren districts out of Kohima its population declined. The proportion of the population of Kohima district declined to 15.58% during 2001 and further to 13.54% in 2011. Tuensang district which had
the highest percentage during 2001 also experienced the same as Kohima district when Kiphire and Longleng became separate districts. The three highest populated districts viz-Dimapur, Kohima, and Mon constitutes 46% of the total population. Over the period from 1971 to 2011 Phek, Mokokchung and Zunheboto Districts saw a decline in the proportion of population and the highest decline was in Mokokchung District by 6.2%. The proportion of population increased in Wokha and Mon Districts by 1% and 0.23 respectively.
The decadal growth of the districts over the period 1961-2001 shows that all the districts have experienced a high decadal growth ranging from 23.62% to 95.16%. During 1981-1991 and 1991-2001 all the areas recorded a decadal growth above 40% and these were the period when the Decadal growth of Nagaland was highest in India. Interestingly the subsequent decade the state recorded a negative population growth. Decadal growth during 2001-2011 was -0.58 and the absolute decrease in population was by 11,534.
The state with an area of 16,579 Sq.km has a low density of population as compared to India. Density of population which was 13 persons in 1951 increased to 119 persons during 2001. Dimapur district with a total area of 927 Sq.km is the second smallest district in terms of area and has the highest density of population. The density of population of Dimapur is actually more than the double of the state average and continues to be heavily populated. Dimapur city which is recognised as one of the fastest growing city not only in the Northeast but in India has the highest density of population with 409 persons which is higher than national average of 382 persons. Peren district is the least densely populated with only 58 persons.
Rural-urban population
From 96.95% in 1901 rural population increased to a high of 98.46% in 1931. Till 1971, 90% of the population lived in rural areas and by 2011 it declined to 71%. As per 2011 census there are 1428 villages in Nagaland inhabited by 1.4 million people.
From 1901 till 1951 urban population in Nagaland constituted less than 2% of the total population. It was after the 1940’s that small township came into existence in Kohima, Dimapur and Mokokchung. Urban population steadily increased to 5% in 1961 from 2% in 1951and it was only after 1971 that the state witnessed a moderate rate of growth in urban population. By 1981, 16% of the population were living in urban areas which remained almost stagnant for the next twenty years. The decade 2001-2011 saw a remarkable increase in urban population by 2.2 lakhs, a decadal increase by 67%. Rural population on the other hand declined by 15% over the same period. The urban population of Nagaland as on 2011 is 28.86% which is slightly lower than the national average of 31.16%.
District wise rural-urban population reveals that from 1981 onwards rural population in all the districts constitute almost 80%. During 1981, out of the seven districts, Peak had no urban population and in Tuensang and Mon it was only 8%. Rural population in Tuensang and Mon district constitute almost 92%. The rural population in the districts of Mokokchung, Wokha and Zunheboto, was around 85%. Kohima with 73% in rural areas was the lowest. The State’s rural percentage was around 84% from 1981-2001. Peren, Kiphire and Longleng districts had no urban population during 2001. The state experienced a high growth of urban population during 2001-2011. The
Urban population doubled in Mokokchung and Mon districts while Kohima and Dimapur continue to have a high percentage of population in urban areas. Dimapur has the highest urban population with 52.2% followed by Kohima with 45.2% during 2011. The least urbanised district is Mon (13.8%) followed by phek (15.0%) The proportion of rural-urban population to total population from 1981-1991, indicates that Kohima district had the highest proportion of both rural and urban population. It was during 2001 when Dimapur was censused as a separate district that the proportion of rural-urban population of Kohima district decreased. During 2011, Dimapur recorded the highest percentage growth of urban population (52.23%) followed by Kohima (45.18%). The district of Mon constitutes 15.33% of rural population to total rural population and Longleng has the lowest proportion with 3.04%. The urban-rural ratio shows that during 1901, for every 100 rural population there were about three urban population and decreased to a low of 1.55% (2 urban population) during 1931. From there on the state experienced an increasing trend and by 2011 for every 100 rural population there is 41 urban population.
Decadal variations of rural population from 2001-2011 of the districts, reveals that Seven districts namely Dimapur, Peren, Mokokchung, Zunheboto, Mon, Kiphire and Longleng saw a decline in the rural population with Longleng district recording the highest with -64.7% while the overall decline in the rural population was 15.0% over the same period. The districts of Wokha, Kohima phek and Tuensang experienced an increase in rural population with the highest in Wokha district with 6%.
Urban population on the other hand rose by 67% and only Wokha district experienced a fall in urban population. The highest increase in urban population is Mon district with 108% and lowest in Wokha with -7.0%. Though Mon had the highest decadal change, it continues to be dominated by a large population living in rural areas. Rural population in Mon is the highest in Nagaland with 86.23%.
Sex composition of population
An important feature in population studies is the composition of the female population in an economy. In many countries especially the developing economies, falling sex ratio is of great concern and Nagaland too is
experiencing a drop in sex ratio. In Nagaland, since 1901 male population continued to be higher than female population, barring 1941 when the female population was higher than the male population. The gap which was 1.38% in 1901 decreased to -1.04 in 1941. From there on the gap between male and female population widened to a high of 7.34% during 1981. After 1981, there was a continuous decline and in 2011 the gap was 3.58%. Both male and female population saw an increase in the population over the years from 1901 to 2001. It was during 2001-2011 when absolute male population decreased by 22492. As a result, there was a decline from 52.62% to 51.79%. During the same period, the female population increased by 10958 and the difference stood at 3.58%, a decrease from 5.24% from the last decade. Fig. 3: Male Female Population
During 1901 there were 973 female for every thousand male in Nagaland while it was 972 for India. From 1901 sex ratio declined and in 2011 for every thousand male there are 931 female. Sex ratio for India too declined but the decline is lesser than that of Nagaland. In 2011 sex ratio for India is 940. The highest rate in the state was during 1941 when female population exceeded male population. The state recorded 1021 female per thousand male. The lowest sex ratio has been registered in 1981 with 863 which was much below the national average of 934. A comparison between Nagaland and India suggest that till 1951 the sex ratio of Nagaland was relatively higher than India but from1961 onwards the average sex ratio in India is greater than Nagaland. Population gap between male and female population among the districts reveals that, the highest gender gap over the years was in Kohima during 1981 with a difference of 11.7% and the lowest in Zunheboto of 1.2% during 2011.The district of Zunheboto over the years has the smallest gap between the male and female population. The gap which was 1.82% improved over the years to 1.2%. Since 1981 all the districts have reduced the gap between genders. Mon and Longleng district even though it has reduced the gap in these two districts is relatively higher than the other districts. Among the areas from 1971-2011, the maximum sex ratio is recorded in Zunheboto with 982 and lowest in Kohima with 771 during 1971. During 2011 Zunheboto recorded the highest sex ratio of 976 while Mon district has the lowest ratio of 899. A comparison between rural and urban areas suggest that Sex ratio is higher in the
countryside than in urban areas. Table 11 reveals that the sex ratio in the countryside is 944 while it is 903 in urban areas. Among the districts, Zunheboto has the highest sex ratio in the countryside with 993 and in urban areas Peren has the highest with 1012. Peren and Phek have the lowest sex ratio in rural and urban areas respectively.
Birth rate, Death rate, and Infant Mortality Rate Birth rate, Death rate and Infant Mortality rate (IMR) are important indicators influencing the growth and development of an economy, especially in the health sector. They reflect the economy’s level of socio-economic development and quality of life. The figure below shows the trends of Birth rate and the Death rate from 1991 to 2011.
Birth rate which was around 16 decreased to a low of 12 during 1999 and by 2011 it stood at 17. As can be seen from the above figure, not much variation is seen in the death rate over the years. From 2.6% in 1991 it increased to a high of 4.8% during 2008 and thereafter it declined to 3.3% during 2011. The gap between birth and death rate which was 13.2% in 1991 declined marginally to 12.8% during 2011.
For the study of birth rate and death rate of the districts two periods i.e 1991-1995 and 2001-2006 are taken as per availability of data. The years 1991-1995 and 2001-2006 gives us the average of the two periods. The district of Kohima had the highest birth rate with 26.04 and the lowest in Tuensang with 4.34 during the period 1991-1995. During 2001-2006, Dimapur recorded the highest
with 29.42 and Longleng the lowest with 4.6. Data on death rate reveals that during 1991-1995, Phek district had the highest average rate of 3.16 and the lowest in Tuensang district with 0.96. During 2001-2006 Dimapur averaged 4.65 which is the highest and the district of Longleng averaged the least with 0.52.
Data on birth and death rate of the districts indicates that the districts of Kohima, Dimapur, Mokokchung, Zunheboto and Wokha which are considered advance districts have a higher birth rate compared to the backward districts. The average birth rate for the former is 24.37% during 1991-1995 and 34.21% during 2001-2006 much higher than the state average of 19.47 % and 29.17 % respectively. For the other backward districts it is 11.24% during 1991-1995 and 20.61% during 2001- 2006.
Similarly, death rate in the advance communities is higher than the backward districts. The average death rate for these districts is 3.16% during 1991-1995 and 5.18% during 2001-2006 while it is 1.54% during 1991-1995 and 3.22% during 2001-2006 in the backward districts. The death rate in Nagaland during 1991-1995 and 2001-2006 is 2.61 % and 4.49 %. Phek district which comes under the backward district recorded the highest birth and death rate in 2001-2006 with 29.9 % and 5.20 % respectively.
Nagaland is one of the few states in India that has performed reasonably well in bringing down the Infant mortality rate over the years. In 1961 the rate was at a high of 68 but much below the Indian average of 115. During the 50 year period i.e from 1961-2011 infant mortality rate have declined by less than half to 21. In 2011 the all India average rate stood at 44. A study of male and female infant mortality rate suggest that from 1961 till 2008 male IMR was higher than the female but from 2009 to 2011 female infant mortality rate is higher than male. As on 2012 infant mortality is 18 per 1000 live birth of which female infant mortality rate is 22 and that of male 15 per 1000 live birth.
Among the districts, Wokha and Mon have the highest and lowest infant mortality rate with 47.42 and 27.1 respectively. In most of the district male infant mortality rate is lower than female. Highest male infant mortality rate is Wokha district with 48 and highest female infant
mortality rate is Tuensang district with 58.5. The average difference between male and female infant mortality rate is 9.34.
Literacy Rate
The quality of the population is often determined by the number of literates and this, in turn, is a good indicator in understanding human development. The state of Nagaland has performed relatively well in maintaining a high rate in the number of literates and more importantly of female literacy. As per 2011 census literacy rate in Nagaland is 79.6% with male literacy of 82.8% and that of female 76.1%. Over the last fifty years, literacy rate in Nagaland has increased by 116%. The literacy rate stood at 22% during 1961 and it increased to 80 % during 2011, an average annual growth of 2.64%. Male literacy rate increased by 107.2 %, while female literacy increased by 124.2% during 1961-2011. The gap between male and female literacy rate which was 15.2% in 1961 widened to 19.2% in 1971 but from there on the gap kept on declining and in 2011 it stood at 6.7%. The state of Nagaland comprising eleven districts is categorised under backward and advance districts and this categorisation is done according to the socio-economic status of the districts. The districts of Kohima, Dimapur, Mokokchung, Wokha and Zunheboto fall under the advance districts and the rest falls under backward districts. Literacy rate was considered to be one of the important variables while categorising the advance and backward districts. Till 2001 the literacy rate of the backward districts were below the National average but much improvement has been made over the years and by 2011 it matched with the National average of 74.04%. On the other hand the advance districts continue to have a high percentage of literate population with Mokokchung district having the highest rate of 93.6%.
reduced to 11.45 during 2011. As for Mokokchung district the gap reduced from 5.64% to 4.42% and then to 1.17% over the same period.
Age composition
Composition of population by age group indicates that during 2011 there are 34.3% in the age group 0-14 years, 60.4% in 15-59 years and the rest 5.3% above 60 years. Between the age groups 0-59 years male and female constitutes 52% and 48% respectively. In the age group 60 and above male percentage is relatively quite higher than the female. Male constitute 53.39% while it is 46.61 for female.
The absolute child population (0-6 years) which was 68 thousand during 1961 increased to 291 thousand during 2011. Male child increased from 34 thousand to 149 thousand while female child increased from 34 thousand to 141thousand during the same period and the average annual growth rate from 1961 to 2011 was 2.95%. Over the years the percentage of child population to total population decreased from 18.42% to 14.44% which is marginally higher than the national average of 13.12%. Child population in rural and urban areas suggests that both male and female child living in rural areas has declined while in urban areas it has increased. It is seen that during 2001-2011 rural male child declined by 7.85% while in urban areas it increased by 7.95%. Similarly for girl child the decrease and increase in rural and urban population was 9.16%. District wise data reveals that during 2011 the highest proportion of child population to total population was recorded in Kiphire (19.9%) while the lowest was in Mokokchung (10.6%). Five districts namely, Kohima, Dimapur, Mokokchung, Wokha and Zunheboto have a lower percentage of child
population than the state average in rural as well as in
urban areas.
C
onClusionThe growth of Population no doubt, increases the working force and brings about development of an economy, but unless employment avenues are created
this will result in slowing down the growth of an economy instead of accelerating it. The state of Nagaland is going through a period of transition from an agriculture based to a moderately industrialised economy but the few existing small and medium industries are unable to give employment to many and with no large industries the problem of unemployment especially with the educated youth continues to hamper the development of the state. Economic growth should lend support to the growth of population and one way to achieve this is through industrialisation. Once industrialisation take place the demand for skilled manpower will increase and even in rural areas this will attract the educated youth to stay or return back to villages. Rural industrialisation on the other hand will reduce migration to urban areas and ease the pressure in urban areas. If human resources are to be effectively and efficiently utilised, industrialisation in both rural and urban areas should be the prerogative for proper planning and development.
R
efeRenCesCensus of India 2011. Primary Census Abstract. Data Highlights, Nagaland Series 14, Directorate of Census Operations, Nagaland, Kohima, 2013.
Economic Survey 2012-13. Sample Registration System 46,47, 48 dated Dec. 2011; October, 2012, Sept. 2013; Office of the Registrar General of India, Ministry of Home Affairs.
Goel, N.P. 2005. Population Trends in North East India,Dialogue,
January-March, 2005, 6(3)
Government of Nagaland 2004. State Human Development Report, Department of planning and Coordination.
National Family Health Survey (NFHS-3), India, 2005-06: Nagaland. Mumbai. IIPS
Premi, M.K. 2009. India’s Changing Population Profile. National Book Trust, New Delhi, India.
Statistical handbooks of Nagaland, Directorate of Economics and Statistics, Government of Nagaland.
The Hindu, July 12, 2012.
Todaro, M.P. and Smith, S.C. 2011. Economic Development. 11th Edition. United Kingdom, England. Pearson Education Limited.