387 |
P a g e
FRACTURE BEHAVIOUR OF FIBRE REINFORCED
GEOPOLYMER CONCRETE
Marlene A. Jenifer
1, S. Sunder Kumar
2, Dr. C.S.C. Devadass
31
Department of Civil Engineering, Karunya University, Coimbatore (India)
2Scientist, Advanced Materials Laboratory, CSIR- SERC, Chennai (India)
3Professor, Department of Civil Engineering, Karunya University, Coimbatore (India)
ABSTRACT
The use of geopolymer concrete using fly ash and slag can reduce the emission of CO2 in the atmosphere. This study
analyses the impact of with and without steel fibres on compression, split tension, flexural strength and bond
strength of hardened geopolymer concrete. The use of crimped steel fibres with aspect ratio of 60 with volume
fraction of 0.75% was used in the mix. The effect of the geopolymer binder on fracture characteristics of concrete
has been investigated by three point bending on notched beam specimens. The fracture energy was calculated by the
method of work of fracture. The fracture behavior of GPC is mainly because of its higher tensile strength and bond
strength.
Keywords : Fly Ash, Ground Granulated Blast Furnace Slag, Geopolymer Concrete, Fracture Energy,
Stress Intensity.
I INTRODUCTION
Plain concrete suffers from various drawbacks like low tensile strength, brittleness, crack propagation and low fracture resistance. The addition of steel fibres in plain cement concrete improves its mechanical and elastic properties. Hence, steel fibre reinforced concrete has been proved as a reliable and promising composite construction material having superior performance characteristics compared to conventional concrete.
The rate of production of CO2 is increasing day by day due to the huge production of Portland Cement. A tonne of
Portland Cement produces 1tonne of CO2 in the atmosphere causing green house effect. On the other side, fly ash is
388 |
P a g e
Urmil Dave et. al (2013) concluded that compressive strength increases with increase in the curing time, curing temperature, rest period, concentration of sodium hydroxide solution and decreases with increase in the ratio of water to geopolymer solids by mass & admixture dosage, respectively. Subhash Patankar et. al(2013) describes the effect of steel fibres on mechanical and elastic properties of geopolymer concrete from the experimental results that the wet and dry densities of geopolymer concrete composites increased continuously with increase in fibre content, whereas the workability of geopolymer concrete composites reduced with increase in fibre content. Heah et. al (2013) described kaolin based geopolymer showing higher stability in water with no disintegration and cracks and thereby exhibiting different rates of strength development. Bharathi Murugan et. al (2012) concluded that low calcium fly ash based geopolymer concrete has excellent compressive strength and is suitable for structural applications. The compressive strength of M30 grade geopolymer concrete is 17.04% higher than OPC concrete and5.1% higher than of OPC concrete for M60 grade. Lloyd et. al (2010) concludes that geopolymer is applicable in
aggressive marine environments, environments with high carbon dioxide or sulphate rich soils and acidic conditions.
Bharatkumar et. al (2005) concluded that the The peak normalized moment and peak rotation decrease with increasing depth for a given reinforcement ratio, whereas the peak normalized moment and peak rotation increase
with an increasing reinforcement ratio for a given depth. Tian Sing et. al (2013) concluded in the results that the
shear strength increases significantly as the fibre content increases and that improvement in the cracking behaviour
is achieved through the addition of fibres. Silva et. al (2002) concluded that the toughness strength difference
between GPC and OPC with 0% fibres is 80% and for higher volume of fibres upto (3-5%) shows decrease in stress
intensity factor due to increase in porosity. F. Bencardino et. al (2010) concluded that the addition of steel fibres
upto 1-2% contributes the structural integrity, structural stability and increases its durabile life service.
In the present study geopolymer concrete of 3.5M is used. The constituents consist of 1:1 ratio of fly ash and slag, 1:2 ratio of NaOH and NaSiO3 , 10mm aggregates and river sand, and use of 0.75% crimped stainless steel and
crimped mild steel fibres are used. In geopolymer mix the water content ratio is less as compared to OPC. The study of mechanical properties such as compressive strength test on cubes, split strength test on cylinder, flexure strength test on prisms and fracture behavior of fibre reinforced geopolymer on prisms are studied throughout.
II REACTION MECHANISM
Generally, OPC concrete develops strength through the formation of hydrates such as CSH (calcium silicate hydrate), which is produced by the hydration reaction of water and the ordinary Portland cement typically used as a binder. Moreover, the hardening of fly ash and slag based geopolymer is achieved by dissolving the Al and Si components by alkaline activator known as geopolymerization. The geopolymerization process, indicates a chemical reaction between Al-Si oxides which form the three-dimensional polymer chain Si-A-O-A-Al-A-O, was proposed by Davidovits in 1978. The hardening of the geopolymer is believed to be due to the polycondensation of hydrolyzed aluminate and silicate species. The alkaline activator, which is generally used are sodium hydroxide (NaOH), potassium hydroxide (KOH), sodium carbonate (NaCO3) or sodium sulfate (Na2SO4) containing alkaline
389 |
P a g e
with the binder. The dissolution of water which accelerates the geopolymerization which provides discontinuous gel nanopores to the paste, resulting in a further improvement of the performance of the paste depicting the hardening mechanism.
III EXPERIMENTAL PROGRAMME
Experimental work is aimed to study the effect of steel fibres on mechanical and elastic properties on geopolymer concrete. The materials used for making geopolymer concrete composite specimens are low-calcium fly ash, ground granulated blast furnace slag, course and fine aggregates, steel fibers, alkaline solution, and water.
3.1 Fly Ash
Fly ash is the residue from the combustion of pulverized coal collected by mechanical or electrostatic separators from the flue gases of thermal power plants. The spherical shape of particle improves the flow ability and reduces the water demand. In this experimental work, the fly ash used is obtained from the silos of Ennore Thermal Power Station, Chennai, India, which is of low calcium, Class F. Low calcium fly ash makes substantial contributions to the workability, chemical resistance, and reduction in thermal cracking. Table 1 shows the chemical composition.
Table 1 : Chemical Composition of Fly Ash
Compound SiO2 Al2O3 Fe2O3 CaO MgO Na2O K2O TiO2 Mn2O3 SO3 P2O5
Fly Ash 49.45 29.61 10.72 3.47 1.3 0.31 0.54 1.76 0.17 0.27 0.53
3.2 Ground Granulated Blast Furnace Slag
GGBS is a by-product from JSW Industries, Karnataka, India. Table 2 describes the composition of GGBS.
Table 2 : Chemical Composition of GGBS
Compound SiO2 Al2O3 Fe2O3 CaO MgO Na2O K2O TiO2 Mn2O3 SO3
GGBS 33.45 13.46 0.31 41.7 5.99 0.16 0.29 0.84 0.40 2.74
3.3 Alkaline Solution
Sodium hydroxide (NaOH) in the form of flakes and sodium silicate are used as alkaline activators to give a good binding solution for the geopolymeric mix.
3.4 Aggregates
390 |
P a g e
3.5 Steel Fibres
Use of crimped stainless and crimped mild steel fibres of aspect ratio (a/d) 60 is used.
3.6 Mix Proportion of Geopolymer Mix
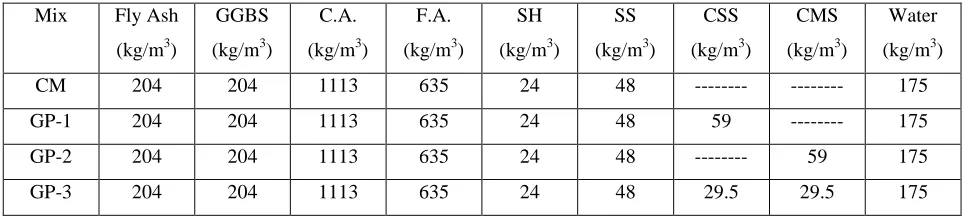
Fly ash, GGBS, coarse and fine aggregate and steel fibres are mixed thoroughly in a dry state and then alkaline solution is added to make the mix wet until it gains homogeneous state. Mix proportion and quantity of fibre content in each mix is explained below in table 3.
Table 3 : Geopolymer mix proportion
Mix Fly Ash (kg/m3)
GGBS (kg/m3)
C.A. (kg/m3)
F.A. (kg/m3)
SH (kg/m3)
SS (kg/m3)
CSS (kg/m3)
CMS (kg/m3)
Water (kg/m3)
CM 204 204 1113 635 24 48 --- --- 175 GP-1 204 204 1113 635 24 48 59 --- 175
GP-2 204 204 1113 635 24 48 --- 59 175 GP-3 204 204 1113 635 24 48 29.5 29.5 175
3.7 Test Specimens and Testing
Standard cube specimens (100*100*100mm) were tested for compressive strength test, split tensile test were tested on cylinder specimens (100*200mm) and flexure test were conducted on prism (100*100*500mm) for each batch of mix. The fracture test specimens were 100 *100*500mm beams with a 25 mm deep notch in the middle of the beam. Different ratios of the notch depth to beam depth were used in fracture test specimens available in literature, though a ratio of 0.5 is recommended by RILEM. A ratio of 0.25 was used in the specimens of this study to make the ligament area sizable in order to enable the observation of the crack propagation in the concrete.
Three point bending tests were performed in deflection controlled mode by using a very stiff closed loop Instron Servo Control machine of 200 tonne capacity. The ends of the test specimen were placed on the supporting rollers at a span of 400 mm with the notch on tension side. The Instron machine had a built in digital data acquisition system. It was incorporated with a load cell to record the load with an accuracy of 0.001 kN and a digital strain gauge measuring the vertical displacement with an accuracy of 0.001 mm. The data acquisition system had the ability to record up to 1000 data per second. Clip gauge was fixed at the bottom of the notch opening to record the critical mouth opening deflection. Three identical specimens were tested for each mixture.
391 |
P a g e
…(1)
where Wₒ is the area under the load–deflection curve (N–m), m is the mass of the beam between the supports (kg), g
is the acceleration due to gravity (m2/s), dₒ is the deflection at final failure of the beam (m) and Alig is the area of the
ligament (m2).
Figure 1 : Three point bending test on notched prisms
The term critical stress intensity factor (Kic) is used to indicate the magnitude of the stress concentration that exists in front of the crack tip when the crack starts to propagate. The most common method of calculation of the critical stress intensity factor is to use the peak load from the three point bending test of the notched beam and the dimensions of the specimen has been used in this study to calculate the critical stress intensity factor from the specimen geometry and the maximum value of load recorded in the test.
…(2)
where A = (a/d), a is the depth of the notch (mm), d is the depth of the beam (mm), b is the width of the beam (mm), P is the maximum load (N) and l is the span length of the beam (mm).
IV TEST RESULTS AND DISCUSSION
392 |
P a g e
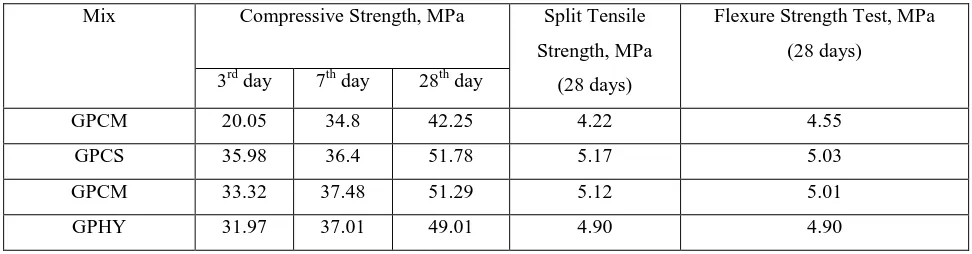
The mechanical properties of the geopolymer concrete were tested as per the standard in 3rd, 7th, and 28th day. The compressive test of cubes were conducted in accordance with ASTM C109 with a load capacity of 1000kN.The split tension test were conducted on cylinder specimen after 28 days. The flexure test conducted on beam specimens showed higher results because of the addition of steel fibers and the high bondage strength. Table 4 briefly explains the test analysis values.
Table 4 : Test result on mechanical properties
Mix Compressive Strength, MPa Split Tensile Strength, MPa
(28 days)
Flexure Strength Test, MPa (28 days)
3rd day 7th day 28th day
GPCM 20.05 34.8 42.25 4.22 4.55
GPCS 35.98 36.4 51.78 5.17 5.03
GPCM 33.32 37.48 51.29 5.12 5.01
GPHY 31.97 37.01 49.01 4.90 4.90
4.2 Load-Deflection Behavior
As the load was applied slowly on the notched beam specimen (100*100*500mm), no cracks were formed until the peak load was attained. A crack started to propagate at the end of the notched part faster in the ligament when the load reached its peak value. Failure started to propogate by opening a single crack in the geopolymer concrete specimens. For calculating the fracture energy by the work of fracture method the load–deflection curves were corrected for the initial non-linearity due to deformation of the specimen at the supports, as recommended in the RILEM guidelines. The typical load–deflection diagrams of GPC concrete specimens are given. It is seen from these figures that the peak load of geopolymer concrete specimen was higher similar to its compressive strength.
a) Load vs CMOD curve for each batch b) Load vs deflection curve for each batc
393 |
P a g e
c) Crack formed in specimens without fibres d) Crack formed in specimens with fibres
Figure 3 : Crack formation in tested geopolymer specimens
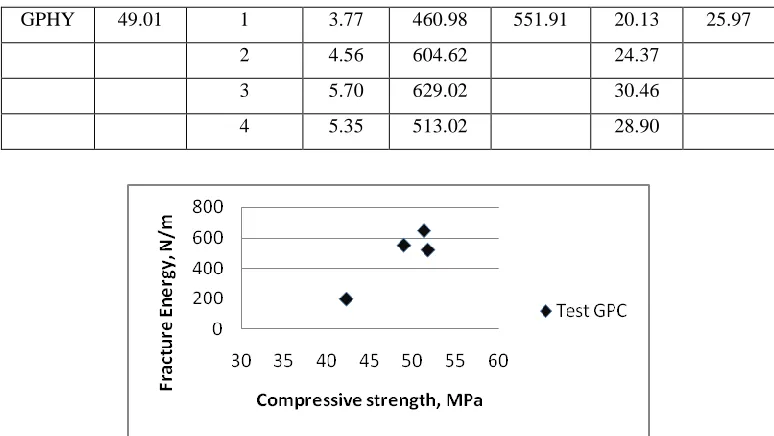
4.3 Fracture Energy
The area under the load–deflection curve for each notched beam specimen was calculated and used in Eq. (1)to obtain the fracture energy of each specimen. The mean value of the fracture energy for the specimens of each batch is also given in the table 5. The mean fracture energy values of the GPC concrete batches are plotted in Fig.5. It can be seen that the fracture energy of batch GPCM is slightly smaller than that of batch GPHY. The fracture energy tend to be higher for GPC concrete as the compressive strength increases. The fracture energy values of the specimens of each batch are plotted against compressive strength in Fig.4
Table 5 : Test and calculated values of GPC specimens
Batch fck
MPa
Specimen Peak Load (kN)
Fracture Energy
Mean Gf
(N-m)
Kic Mean
Kic
GPCM 42.25 1 4.36 145.90 196.57 23.30 24.56
2 4.59 173.91 24.54
3 4.84 269.90 25.83
GPCS 51.78 1 5.40 566.45 517.16 28.83 26.18
2 4.55 444.27 24.28 3 4.20 532.52 22.41
4 5.47 525.42 29.19
GPMS 51.29 1 6.28 817.02 645.79 33.55 29.33 2 5.26 604.62 28.09
3 4.97 452.51 26.53
394 |
P a g e
GPHY 49.01 1 3.77 460.98 551.91 20.13 25.97
2 4.56 604.62 24.37 3 5.70 629.02 30.46
4 5.35 513.02 28.90
Figure 4: Variation of fracture energy of GPC concrete with compressive strength
4.4 Critical stress intensity factor
The value of stress intensity factor indicates the magnitude of the stress concentration in front of the crack tip when the crack starts to propagate. The critical stress intensity factors of the GPC concrete specimens were calculated by using Eq. (2). The value for each test specimen and the mean value for the specimens of each batch of concrete are given in Table 5. The mean values of the critical stress intensity factors for each batch are plotted in Fig.6. The critical stress intensity factors for all the specimens are plotted against compressive strength in Fig.5. It can be seen that critical stress intensity factor tends to increase with compressive strength in GPC. Therefore, the crack resistance of GPC is higher to that of the its compressive strength. This behavior is consistent with the previous findings that geopolymer concrete has higher tensile and bond strengths.
395 |
P a g e
V CONCLUSIONS
This study investigated the fracture behavior of geopolymer concrete with respect to its compressive strength. Three point bending test was conducted on notched beams for four batches of geopolymer concrete specimens. The fracture energy is calculated using work of fracture method using the load deflection curve and the stress intensity is calculated using the peak load and the geometry of the specimen.
1. With the addition of steel fibres in geopolymer concrete reduced the workability of concrete mix. 2. The requirement of water content ratio is less as compared to other concrete.
3. The addition of fibers reduces the crack propagation in concrete and reaches higher peak value. 4. Fracture energy increased with compressive strength in geopolymer concrete.
5. The result of fracture properties indicate that geopolymer concrete can substitute with the traditional Portland cement in traditional application.
VI ACKNOWLEDGEMENT
We acknowledge with thanks the technical support provided by the Advanced Materials Laboratory, CSIR SERC. This paper is being published with kind permission of the Director, CSIR SERC, Chennai, India.
REFERENCES
1. Prakash R Vora , Urmil V. Dave “ Parameteric studies on compressive strength of geopolymer concrete” Procedia Engineering 51 210 – 219; 2013.
2. C.Y. Heah., H. Kamarudin., A.M. Mustafa Al Bakri., M. Bnhussain., M. Luqman., I. Khairul Nizar., C.M. Ruzaidi., Y.M. Liew, “Kaolin-based geopolymers with various NaOH concentrations” March 2013.
3. Atteshamuddin S. Sayyad and Subhash V. Patankar “Effect of Steel Fibres and Low Calcium Fly Ash on Mechanical and Elastic Properties of Geopolymer Concrete Composites” Indian Journal of Materials Science Volume 2013.
4. Bharathi Murugan., Sujatha., Kannapiran., Nagan, “Geopolymer Concrete - A Green Concrete” ACI Magazine 310-321; December 2012.
5. Prabir K Sarker, Karamchand V. Ramgolam, Rashedul Haque “Fracture behavior of heat cured fly ash based geopolymer concrete” Materials and Design 44 (580-586) 2013.
6. B. H. Bharatkumar, B.K. Raghu Prasad, D. S. Ramachandra Murthy, R. Narayanan, and S. Gopalakrishnan “Fracture mechanisms model for analysis of plain and reinforced high performance concrete beams”
Journal of Engineering Mechanics, ASCE, 131:831-838, August 2005.
7. Tian Sing Ng, Ali Amie, Stephen J. Foster “The behavior of steel fibre reinforced geopolymer concrete beams in shear” Magazine of Concrete Research 65(5); 308-318, 2013.
396 |
P a g e
9. F. Bencardino, L. Rizzuti, G. Spadea, and RN Swamy “Experimental evaluation of fibre reinforced concrete fracture properties” Composites Part B 41 (17-24), 2010.
10. C. K. Yip, G. C. Lukey “The coexistence of geopolymeric gel and calcium silicate hydrate at the early stage of alkaline activation” Cement and concrete research 35 (1688-1697), 2005.
Biolological Notes
Ms. Marlene A. Jenifer is presently pursuing M. Tech. final year in Civil Engineering Department (Specialization in Structural Engineering), Karunya University, Coimbatore, Chennai, India.
Mr. S. Sundar Kumar is working as a Scientist in Advanced Materials Laboratory, CSIR-SERC, Taramani, Chennai, India.