Research
Paper
May-June 2018 503
Azelaic acid (AZA) is a straight chain saturated (C9) dicarboxylic acid, nonanedioic acid (fig. 1). It is a naturally occurring substance found in wheat, rye, barley and also formed endogenously within the body by metabolism of oleic acid or by omega oxidation of mono carboxylic acid[1]. The effectiveness of AZA against hyperpigmentation was first observed by Nazzaro-Porro and Passi[2]. This depigmenting action of AZA was correlated to its inhibitory effect on thioredoxin reductase pathway[3]. AZA was also found to exhibit antiinflammatory, antimicrobial (Propionibacterium acnes, Staphylococcus epidermidis, Staphylococcus aureus, Escherichia coli) and antikeratinising activities[4-6]. These activities were attributed to the inhibitory action of AZA on the production of proinflammatory cytokines (IL-1β, IL-6 or TNFα)[7], proteins/DNA synthesis within the bacterial cell[7,8] and filaggrin expression in keratinocytes[9].
These multiple activities of AZA with a low toxicity profile[10] has encouraged the cosmeceutical industry to employ AZA as an essential component in their products for the management of hyperpigmentation
disorders, lentigo maligna/melanoma, melisma and acne vulgaris[11]. But the major challenge in the commercial implication of AZA is its quantitative analysis spectrophotometrically, since it lacks any strong chromophore and fluorophore group. Various techniques to quantitate AZA from the pharmaceutical/ cosmetic preparations have been reported. These include spectrophotometric analysis employing UV/fluorescent detector or by utilizing thin layer chromatography, gas chromatography and liquid chromatography-mass spectrometry. These techniques either follow pre-column derivatization approach via
1-leucine-4-methyl-7-coumarinylamide[12], methyl methoxy coumarin[13], methylation/salylation[14], 4-bromophenacylbromide/phenacetyl bromide[15,16], 2-bromoacetyl-6-methoxynaphthalene[17] or
on-A Validated Stability-indicating RP-HPLC Method for
Analysis of Azelaic Acid in Pharmaceuticals
D. S. MALIK AND G. KAUR*
Department of Pharmaceutical Sciences and Drug Research, Punjabi University, Patiala-147 002, India
Malik and Kaur: Analysis of Azelaic Acid in Cosmeceuticals
The study is designed to develop a simple, rapid, selective and robust stability indicating reversed phase-high performance liquid chromatography method for quantitative analysis of azelaic acid in pharmaceutical preparations. The chromatographic separation and estimation of azelaic acid was carried out using a Waters high-performance liquid chromatography system employing Kromasil 100-5C18 column (250× 4.6 mm; 5 µm particle size) as a stationary phase. The mobile phase comprised of 75 volumes of sodium
di-hydrogen orthophosphate (pH 3.5; 50 mM) and 25 volumes of acetonitrile, eluted at a flow rate of
1.2 ml/min. The eluents were monitored at 206 nm using 2487 dual wavelength ultra violet detector. The method was developed and validated in terms of stability as per International Conference on Harmonisation and Center for Drug Evaluation and Research guidelines. A linear relationship between peak area and
concentration of azelaic acid was observed in a concentration range of 5-400 µg/ml (correlation coefficient,
r2= 0.998). The method showed acceptable levels of precision (%RSD ≤2), accuracy (>96 % recovery),
robustness (<10 % content difference) and stability (>96 % recovery) over varied environmental and
laboratory conditions. The method was successfully applied for the determination of azelaic acid, extracted
from three different batches of Aziderm® cream, which yielded a recovery of >97 %, indicated its applicability
in routine analysis of azelaic acid in pharmaceutical preparations.
Key words: Azelaic acid, HPLC, non-derivatized, stability studies, validation
*Address for correspondence E-mail: kaurgpt@gmail.com
This is an open access article distributed under the terms of the Creative Commons Attribution-NonCommercial-ShareAlike 3.0 License, which allows others to remix, tweak, and build upon the work non-commercially, as long as the author is credited and the new creations are licensed under the identical terms
504
column derivatization via charged dye[18]. Most of these methods are sensitive enough for the quantitative analysis of lower concentrations of AZA. However, these reactions are often time-consuming and require a good experience in organic and inorganic chemistry. Also these techniques have been reported to form unstable product (mono/di esters) with the incidence of peak broadening and reproducibility issues[17-19]. The aim of the present study was to develop a simple, reproducible, precise, accurate and robust isocratic reversed phase-high performance liquid chromatography (RP-HPLC) method for identification, determination and estimation of AZA (non-derivatized form) in the Aziderm® cream. The developed method
was validated, as per regulatory requirements, for its stability under changing laboratory and environmental conditions.
MATERIALS AND METHODS
AZA was purchased from Sigma-Aldrich (St. Louis Mo, USA). HPLC grade methanol and acetonitrile (ACN) were obtained from Merck and Sigma Aldrich, respectively. Sodium di-hydrogen orthophosphate and ortho-phosphoric acid were procured from Loba Chemie, Mumbai, India. Aziderm cream 20 % (w/w), a product of Micro Labs Limited, was purchased from a Local Pharmacy. High quality pure triple-distilled Millipore (Model-Milli-QR, Merck, US) water was
used throughout the analysis.
Instrumentation and chromatographic conditions: A Waters HPLC system equipped with a binary controller pump (515) and UV detector (2487) was employed for the identification and validation of AZA. Each sample to be injected was filtered through 0.22 µm nitrocellulose filter and manually injected (20 µl) using Rheodyne injector (Milford, MA, USA controlled by Empower 2 software). The mobile phase comprised of (75:25) sodium di-hydrogen
orthophosphate (NaH2PO4; pH 3.5; 50 mM) and ACN, eluted at a flow rate of 1.2 ml/min through a stationary phase (Kromasil 100-5C18 column, 250×4.6 mm; 5 µm particle size) maintained at ambient temperature i.e. 25°. Analysis was conducted at a detection wavelength of 206 nm.
Preparation of standard and sample solutions: Stock solution (1 mg/ml) of AZA was prepared employing mobile phase, i.e., 50 mM sodium phosphate buffer:ACN (75:25; pH 3.5). The stock solution was further diluted with mobile phase immediately before use to obtain a working solution in the range of 5-400 μg/ml for preparation of calibration plot.
Method validation:
The analytical method was validated in terms of linearity, accuracy, precision, robustness and stability in accordance with International Conference on Harmonization (ICH Q2 (R1), 2005) guidelines[20].
Linearity:
Linearity is used to characterize the ability of a proposed analytical procedure to give a response signal (peak height/area) in proportion to the drug concentration[21]. For assay of formulations, linearity is generally performed at seven-concentration levels. Linearity was evaluated within the concentration range of 5-400 μg/ml using 1 mg/ml stock solution. The samples were analysed (n=3) in increasing order of concentration, i.e., 5, 20, 50, 100, 200, 300 and 400 μg/ml. The calibration curve was used to calculate limit of detection (LOD) and limit of quantification (LOQ) applying the graphical method, using following Eqn.: LOD = 3.3×σ/S, LOQ = 10×σ/S, where, σ is the standard deviation of intercept and S is mean of the slope of the calibration curve.
Precision:
It is the measure of degree of repetition and reproducibility of an analytical method under a given set of experimental conditions[22]. It is expressed as the percent relative standard deviation (% RSD) for a statistically significant sample number (n=6). Precision (intra-assay/repeatability and inter-assay precision) is determined by repeated analysis of aliquots of homogeneous samples at lower limit of quantification (LLOQ) 5 µg/ml, middle quality control (MQC) 50 µg/ml and high quality control (HQC) 100 µg/ml concentrations prepared independently in a laboratory on the same and on 3 successive days, respectively.
O
O
OH
OH
505
May-June 2018
The intra/inter-assay precision (% RSD) of less than 2 % was selected as acceptance criteria for the method evaluation.
Accuracy:
The accuracy is the proximity of the test concentration procured from an analytical procedure to the true concentration of an analyte. It is determined by replicate analysis (n=6) of samples, at least at three concentration levels, containing known amounts of an analyte. The deviation of the mean from true value serves as the measure of the accuracy. According to ICH Q2B, 1997 guidelines, the mean value should be within 15 % of the actual value[23].
The unfortified sample was prepared by mixing 2 ml of the standard solution (50 µg/ml) with 2 ml of the diluent while fortified samples were prepared by mixing equal volumes of standard with different drug solutions: LLOQ, MQC and HQC. The accuracy is expressed as percent recovery or percent nominal concentration (NC) of the drug in fortified samples with respect to unfortified one.
Robustness:
It is the reliability and susceptibility of an analytical procedure, in terms of stability, toward the deliberate changes in processing parameters possible under experimental conditions. The evaluation of robustness is usually considered during the development phase of an analytical procedure. Typical variable parameters (with their acceptable limits) capable of influencing the outcome of the analysis include ratios of mobile phase composition (±2.0 %), buffer pH (±0.5), detection wavelength (±5) and flow rate (±0.2). Standard drug solution (50 µg/ml) was analysed (n=3) at each chromatographic condition and its respective effect on percent drug recovery and retention time (RT)was noted.
Stability studies:
These were performed to evaluate the stability of an aqueous solution of AZA under variable stress/storage conditions, at least for the period that equals or exceeds those applied to the actual study samples i.e. 4-6 w. These studies included bench top, freeze thaw, aqueous solution, stock solution, long-term and post-operative stability studies. All these evaluations were performed as per Center for Drug Evaluation and Research (1994) and ICH guidelines and the response of the sample was analysed against freshly prepared calibration standards[21,24].
Bench top stability was determined by evaluating samples (n=6) at LLOQ and HQC kept undisturbed at 25° (on bench) for 6 h. Freeze thaw stability was calculated by assessing 6 replicates of samples at low and high concentrations previously frozen and thawed over 3 cycles for 3 consecutive days. The samples were frozen at –20° (Celfrost deep freezer, India) for at least 24 h followed by unassisted thawing at room temperature. Aqueous solution stability of the drug was conducted at MQC prepared from the 24 h old stock solution stored at 10°.
Long term stability studies are performed at-least for a period exceeding the time interval from the date of first sample collection to that of last sample analysis. Therefore, keeping this in view the samples were stored for 40 d. Samples (n=6) at LLOQ and HQC were stored at –20° for 40 d and analysed after thawing.
Stock solution stability was evaluated by injecting a dilution of AZA (100 µg/ml) prepared from 40 d old stock solution (1 mg/ml) stored at temperature below 10°. Results were analysed by comparing the area response of the diluted old stock solution with similar dilution made from freshly prepared stock solution. The postoperative stability study was determined by processing six replicates of LLOQ and HQC prepared by employing the stock solution and mobile phase stored prior in refrigerator for 24 h.
Extraction of sample from commercial preparation: Different batches (Batch No. 085, M001 and 132) of commercial preparation (Aziderm® cream; 10 % w/v)
containing AZA were considered for the study. One gram of each preparation was separately dissolved in ACN (2 ml) for complete extraction of drug from the cream. These were subsequently vortexed for 5 min on a vortex mixer and allowed to stand undisturbed for 15 min. The samples were centrifuged at 7000 rpm and supernatant was subsequently diluted to obtain 3 concentrations (50, 100 and 200 µg/ml). The samples were analysed spectrophotometrically (HPLC) at 206 nm and the percent recovery was calculated as per following Eqn., percent recovery = concentration of AZA calculated/concentration of AZA added×100.
RESULTS AND DISCUSSION
506
Therefore to improve the sensibility and detection of AZA within the UV spectral region various researchers have opted either its pre-column or in-column derivatization techniques. Method though sensitive, but additional derivatization step makes the process somewhat complex and tedious. On the contrary, various researchers have reported simple RP-HPLC method for the precise and accurate detection of short to long chain mono/dicarboxylic acids (underivatized form) in vegetable oil and industrial reaction samples at wavelengths less than 225 nm employing low pH mobile phase comprising of ACN as organic modifier[26,27]. Considering above findings, RP-HPLC method for AZA detection at lower wavelength band was evaluated. UV scan of AZA solution (2 mg/ml) in a spectral region of 200-400 nm revealed absorption maxima at 206 nm, which was further confirmed from the spiking analysis of AZA solution and its dilutions thereof (fig. 2). The results were found in consonance with the reported findings of Esposito et al.[28]. The wavelength so obtained was employed in developing method for the quantitative determination of underivatized AZA on HPLC. The mobile phase was selected based on the polarity of the drug. Different trials were conducted by varying mobile phase compositions, their ratios, pH, and the final working mobile phase comprising of sodium phosphate buffer: ACN (75:25; pH 3.5) at a flow rate of 1.2 ml/min was chosen.
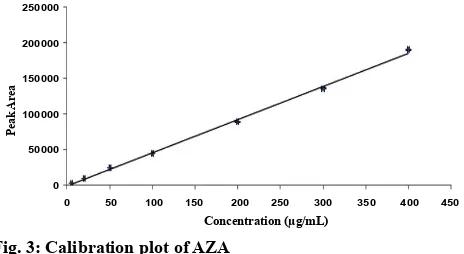
The calibration curve (fig. 3) showed a linear relationship between the drug concentrations and its respective areas within the range of 5-400 µg/ml. The linearity of the method was calculated from least square regression (r2) value of the slope, which was
found to be 0.998. The linear equation calculated from
the standard plot is as follows: y = 468.16x–1230.2, where, y is the response area of sample and x is the concentration taken.
LOD and LOQ as calculated using graphical method was found to be 1.08 and 3.28 µg/ml, respectively. Considering this 5, 50 and 100 µg/ml was taken as LLOQ, MQC and HQC, respectively. The chromatograph showed no significant interference of the blank sample (without drug) at the retention time (~8 min) of analysed AZA samples (fig. 4).
The results of precision-accuracy batches conducted on single or on 3 successive days are shown in Table 1. Intra/inter-day precision for 3 batches (n=6) was found to be within the acceptable limits with % RSD value ≤2.0. Good recoveries (>99 %) at each fortification level were achieved with % RSD of less than 2 %. No significant variation in the calculated drug concentration was observed on any day.
Absence of any significant change in the content (<10 %) and RT with deliberate changes to the method variables exhibited the method to be robust (Table 2). Results indicated the method to be sturdy enough to withstand minor alterations arising during experimentation due to human/equipment error.
Table 3 highlights the outcome of stability studies conducted on aqueous solutions of AZA. Different AZA dilutions (LLOQ, MQC and HQC) were prepared employing mobile phase (diluting solvent) from stock solution and peak areas of the response was compared to that of the freshly spiked sample. Bench top and aqueous solution stability studies, an indicator of formulation’s short term stability, predicted the recovery of >97 %. This showed the sample stability during the period of its retrieval from the cold room till its final processing. The outcome of freeze-thaw stability studies revealed the concentration of AZA to be >96 % of the NC. This exhibited the ability of solution to withstand the processing delays, if any,
1.3 1.2 1.1 1.0 0.9 0.8 0.7 0.6 0.5 0.4 0.3 0.2 0.1 0.0 -0.1 Abs
A
B
C
D
E
200 250 300 350 400 450 500nm
Fig. 2: Spiking analysis of different AZA concentrations on UV-spectrophotometer
A. 2000 µg/ml, B. 1500 µg/ml, C. 1200 µg/ml, D. 800 µg/ml, E. 400 µg/ml
250000
200000
150000
100000
50000
0
0 50 100 150 200 250 300 350 400 450
Concentration (µg/mL)
Peak Ar
ea
507
May-June 2018
0.014
0.012
0.010
0.008
0.006
0.004
0.002
0.000
-0.002
-0.004
AU
Minutes
0.00 1.00 2.00 3.00 4.00 5.00 6.00 7.00 8.00 9.00
A B C D E F
Fig. 4: Overlay HPLC-UV chromatogram of different AZA concentrations
A. 10 µg/ml, B. 20 µg/ml, C. 50 µg/ml, D. 80 µg/ml, E. 100 µg/ ml, F. blank
Precision Calculated concentration (µg/ml) ±SD; % RSD
Added Intra-day (n=6) Inter-day (n=6)
LLOQ 5 5.04±0.09; 1.78 4.97±0.08; 1.61
MQC 50 49.63±0.60; 1.21 49.39±0.98; 1.98
HQC 100 95.05±0.88; 0.92 96.93±1.07; 1.10
Accuracy Calculated concentration (µg/ml) ±SD; % RSD
Added Calculated % Recovery
Unfortified
concentration 25
24.93±0.43;
1.73 99.72
Fortified concentration
27.5 27.63±0.52; 1.88 100.47
50 50.37±1.04; 2.06
100.74 99.01
75 74.26±1.31;
1.76
TABLE 1: INTRA AND INTER-DAY PRECISION AND ACCURACY ANALYSIS OF AZA
Robustness
parameter RT (min) ∆RT
Content of
MQC (µg/ml) Difference in content (%) Optimized
condition 7.96 --- 52.03±0.61
---Mobile phase (Bfr:ACN; 73:27 % v/v)
6.81 -1.15 47.51±0.86 8.69
Mobile phase (Bfr:ACN;
77:23 % v/v) 10.07 2.11 49.55±0.88 4.76
Flow rate
(1.0 ml/min) 9.39 1.43 46.88±0.61 9.98
Flow rate
(1.4 ml/min) 6.91 -1.05 48.30±0.60 7.17
Detection wavelength (201 nm)
7.98 0.02 50.38±0.53 3.17
Detection wavelength
(211 nm) 7.95 -0.01 49.44±0.44 4.98
pH (3.3) 9.13 1.17 53.36±1.24 2.56
pH (3.7) 8.35 0.39 49.67±0.88 4.54
TABLE 2: RESULTS OF ROBUSTNESS STUDY
Bfr= sodium phosphate buffer; ACN= acetonitrile
Stability Concentration added (µg/ml) Concentration present (µg/ml)Initial Final Recovery(%)
Bench top 5 5.83±0.13 5.81±0.12 99.58
100 101.80±2.08 98.87±2.24 97.13
Freeze thaw 5 5.48±0.14 5.28±0.13 96.39
100 98.89±1.97 98.04±2.12 99.15
Aq. solution 50 51.91±0.61 52.28±0.38 100.72
Stock solution 5 5.75±0.09 5.54±0.11 96.44
100 100.79±2.04 98.85±1.78 98.08
Long term 5 5.58±0.11 5.40±0.13 96.81
100 100.31±1.72 96.82±1.26 96.53
Post-operative 5 5.29±0.12 5.21±0.14 98.45
100 97.74±0.88 97.69±1.01 99.95
TABLE 3: STABILITY STUDIES OF AZA
without compromising the stability. The stock solution of the drug was also found to exhibit long term stability. The concentration of samples stored for 40 d depicted a recovery of >96 % with respect to NC. The results of the long term stability suggested that AZA was stable and can be analysed anytime between the periods of sample collection up to its final processing. The method developed was also validated for postoperative stability, which demonstrated that AZA was stable (95-100 % of the NC).
The proposed method was explored for the determination of AZA from 3 different batches of Aziderm® cream. The results shown in Table 4 depict
508
found to be more than 97 %. The method was found to be accurate and selective, with the absence of any interference from the excipients present in the dosage form.
The current isocratic HPLC method developed for AZA analysis provides a great advantage of simplicity, easy sample preparation and absence of requirement of any pre-derivatization step. The method was fully validated according to the regulatory guidelines and was found to be accurate, precise, robust and rugged. The drug and stock solutions showed good stability under a variety of conditions with no observable evidence of degradation/instability of AZA solution. The method developed yielded a resolution peak (with acceptable recovery values) of active moiety extracted from topical cream without any interference of excipient present in the pharmaceutical preparation.
Acknowledgements:
The authors are grateful to the University Grants Commission (UGC, BSR Research fellowship scheme 2014-15 granted to Department of Pharmaceutical Sciences and Drug Research, Punjabi University, Patiala, appointment letter no. 11138) for financial support. The authors also thank the Sophisticated Instrumentation Center (SIC) and Prof. Gulshan Bansal, Punjabi University Patiala for providing facilities for successful completion of this work.
Conflict of interest:
Authors declare that there are no conflicts of interest.
REFERENCES
1. Gollnick H. Azelaic acid-pharmacology, toxicology and
mechanisms of action on keratinization in vitro and in vivo. J
Dermatolog Treat 1993;4:S3-S7.
2. Nazzaro-Porro M, Passi S. Identification of tyrosinase
inhibitors in cultures of Pityrosporum. J Invest Dermatol
1978;71:205-08.
3. Schallreuter KU, Wood JW. A possible mechanism of action for azelaic acid in the human epidermis. Arch Dermatol Res 1990;282:168-71.
4. Couteau C, Coiffard L. Overview of skin whitening agents: Drugs and cosmetic products. Cosmetics 2016;3:27.
5. Mayer-da-Silva A, Gollnick H, Detmar M, Gassmuller J, Parry A, Muller R, et al. Effects of azelaic acid on sebaceous gland,
sebum excretion rate and keratinization pattern in human
skin: An in vivo and in vitro study. Acta Derm Venereol Suppl 1988;143:20-30.
6. Leeming JP, Holland KT, Bojar RA. The in vitro antimicrobial
effect of azelaic acid. Br J Dermatol 1986;115:551-56. 7. Sieber MA, Hegel JKE. Azelaic acid: properties and mode of
action. Skin Pharmacol Physiol 2014;27:9-17.
8. Vargas-Diez E, Hofmann MA, Bravo B, Malgazhdarova G, Katkhanova OA, Yutskovskaya Y. Azelaic acid in the treatment of acne in adult females: case reports. Skin Pharmacol Physiol 2014;27:18-25.
9. Melnik BC, Schmitz G, Zouboulis CC. Anti-acne agents attenuate FGFR2 signal transduction in acne. J Invest Dermatol 2009;129:1868-77.
10. Graupe K, Cunliffe WJ, Gollnick HP, Zaumseil RP. Efficacy and safety of topical azelaic acid (20 percent cream): an overview of results from European clinical trials and experimental reports. Cutis 1996;57:20-35.
11. Reszko AE, Berson D, Lupo MP. Cosmeceuticals: practical applications. Dermatol Clin 2010;37:547-69.
12. Levai F, Liu CM, Tse MM, Lin ET. Pre-column fluorescence derivatization using leucine-coumarnylamide for HPLC determination of mono-and dicarboxylic acids in plasma. Acta Physiol Hung 1994;83:39-46.
13. Elbert W, Breitenbach S, Neftel A, Hahn J. 4-Methyl-7-methoxycoumarin as a fluorescent label for high-performance liquid chromatographic analysis of dicarboxylic acids. J Chromatogr A 1985;328:111-20.
14. Alzweiri M, Tarawneh R, Khanfar MA. Gas chromatography/ trace analysis of derivatized azelaic acid as a stability marker. J Sep Sci 2013;36:3200-05.
15. Ferioli V, Rustichelli C, Vezzalini F, Gamberini G.
Determination of azelaic acid in pharmaceuticals and
cosmetics by RP-HPLC after pre-column derivatization. Farmaco 1994;49:421-25.
16. Sarkar AB, Kochak GM. HPLC analysis of aliphatic and
aromatic dicarboxylic acid crosslinkers hydrolyzed from carbohydrate polyesters for estimation of the molar degree of
substitution. Carbohydr Polym 2005;59:305-12.
17. Gatti R, Andrisano V, Di Pietra AM, Cavrini V. Analysis of
aliphatic dicarboxylic acids in pharmaceuticals and cosmetics
by liquid chromatography (HPLC) with fluorescence detection. J Pharm Biomed Anal 1995;13:589-95.
18. Alzweiri M, Al-Hiari YM, Aburjai T, Abdel-Aldaem O. On-column approach in the HPLC-UV analysis of non-chromophoric compounds using azelaic acid as a model. Jordan J Pharm Sci 2012;5:243-51.
19. Garelnabi M, Litvinov D, Parthasarathy S. Evaluation of a
gas chromatography method for azelaic acid determination in
selected biological samples. N Am J Med Sci 2010;2:397-402.
Concentration
added (µg/ml) Calculated (µg/ml) ±SD % RSD Recovery (%)
Batch 1
50 48.93±1.02 2.08 97.86
100 97.59±1.42 1.45 97.59
200 197.31±2.72 1.38 98.56
Batch 2
50 50.24±0.99 1.96 100.48
100 99.14±1.51 1.52 99.14
200 198.36±2.21 1.11 99.18
Batch 3
50 49.18±0.98 2.05 98.36
100 98.43±1.17 1.19 98.43
200 201.11±2.98 1.48 100.5
509
May-June 2018
20. ICH, Harmonized tripartite guideline: validation of analytical procedure. Text and methodology Q2(R1); 2005.
21. Epshtein NA. Validation of HPLC techniques for pharmaceutical analysis. Pharm Chem J 2004;38:212-28. 22. Rhodes RC. Guideline on the Meaning and Use of Precision
and Accuracy Data Required by 40 CFR part 58, appendices A and B. Washington, D.C.: US Environmental Protection Agency; 1983.
23. ICH ICH Q2B: text on validation of analytical procedures: methodology. In: international conference on harmonization, Fed Reg (62 FR 27463); 1997.
24. FDA. Center for drug evaluation and research. Reviewer guidance: validation of chromatographic methods. Rockville: 1994.
25. Swartz M. HPLC detectors: a brief review. J Liq Chromatogr Relat Technol 2010;33:1130-50.
26. Destandau E, Vial J, Jardy A, Hennion MC, Bonnet D, Lancelin P. Development and validation of a reversed-phase liquid chromatography method for the quantitative determination of carboxylic acids in industrial reaction mixtures. J Chromatogr A 2005;1088:49-56.
27. Guarrasi V, Mangione MR, Sanfratello V, Martorana V, Bulone D. Quantification of underivatized fatty acids from vegetable oils by HPLC with UV detection. J Chromatogr Sci 2010;48,663-68.