1377 | P a g e
APPLICATION OF INTERPRETIVE STRUCTURAL
MODELING (ISM) FOR THE EVALUATION
OF SUSTAINABILITY ISSUES IN THE TEA-SECTOR
OF ASSAM
Soham Chakraborty
1, K.Das
2, S.Satapathy
31,2,3
School Of Mechanical Engineering, KIIT University Orissa, (India).
ABSTRACT
Tea is one of the most popular drinks in the world since ancient times and Assam tea is a globally renowned variety
of tea .For many decades, sustainability has been a major concern for the tea industry present in Assam. The
research mainly focuses on the prioritization of sustainability issues present within the tea-sector of Assam. The
sustainability issues concern a complex system taking into consideration the Social, Environmental and Economic
factors based on literature and in consultation with workers and industrial experts of the tea sector of the state .
The Interpretive Structural Modeling (ISM) qualitative analysis has been used to understand the mutual influences
amongst the Sustainability issues in the tea sector of Assam by survey. The study seeks to identify which issues are
the most dominant and the results draw attention of the stakeholders for the promotion of sustainability on a larger
and improvised scale.
I. INTRODUCTION
Tea is an ancient beverage and the second most popular drink in the world after water and the cultivation of Tea is
confined only to certain specific regions of the world due to specific requirements of climate and soil.. Since long
Assam has been recognized as a dominant player in the international tea market among all the tea producing states
of India. The first discovery of the tea plant growing in India was found in Upper Assam back in 1821, hence
becoming the first tea growing state of India. The first tea garden was opened in 1835 at Lakhimpur district of
Assam. The most notable development of the tea sector of the state is the participation of young unemployed youth
as small tea growers, as a result leading to an increase in production of tea in the state. [1] In Assam tea is considered to be the most important crop. Some of the finest teas in the world are produced in the state. Assam
produces 618,140 tonnes of tea(source: Tea Board Of India), almost 51 percent of the total tea produced in the
country and also engages nearly 17 percent of the work force present in the state . The Tea industry of Assam is
almost 180 years old. The industry has an important role to play in the state economy as well as in the national
economy. In the present day scenario, Assam tea has maintained its international standard and also commands
significant share in the world market. The Assam tea industry gives an average daily employment to more than six
1378 | P a g e
employed by the tea industry in the country. The tea growing areas in Assam is separated into two regions, viz.Assam Valley and Cachar. The Assam Valley consists of the Brahmaputra Valley comprising the districts of
Dibrugarh , Sibsagarh, Lakhimpur, Darrang, Nagaon , Kamrup , Goalpara, Karbi Anglong and North Cachar Hills
districts. Among all the tea producing districts of Assam, Dibrugarh has the largest area under tea nearly about 33
percent.[2]
Like many other tropical commodity sectors all is not well in the tea industry. The areas where tea production takes
place are some of the most beautiful places in the world but also some of the poorest. There happens to be a striking
contrast between wide mountain panoramas with luscious green fields and the existence of miserable conditions for
workers and smallholders.The production of tea is labour intensive and jobs are provided by the industry in remote
rural areas. In the last few years, the tea industry in the state is under threat as the land for tea plantations have not
grown much while on the other hand the work force has multiplied enormously which indicates vast surplus of
labour in the tea gardens. Like many other agricultural commodities, real primary producer prices have gone down
over the last few decades. The sustainability of the tea sector in the state is getting affected majorly due to the low
prices. The working conditions for pickers are poor, low wages, low income and job security, discrimination along
ethnic and gender lines etc. add to their miseries. The possibility for improvement of working conditions for the tea
plantation workers of Assam is less as a result of absence or ineffectiveness of trade unions or they do not represent
them as the workers are temporary. Apart from that, the environmental footprint of the tea sector of Assam is also
considerable with reduced bio-diversity as a result of habitat conversion, high application of pesticides etc.
Sustainability, defined as meeting the current needs of the present without affecting those of the future and the
balance of people, planet, and profit, otherwise known as the triple bottom line, is part of the ultimate goals of
sustainable development and its stakeholders. Hence, a critical analysis of the mutual relationships between the
various sustainability issues viz. Social, Environmental and Economic becomes essential to promote further growth
and sustainable development in the already well established and world renowned tea industry of Assam.
II. RESEARCH OBJECTIVE
The primary objective of the present study is the utilization of Interpretive Structural Modeling (ISM) for the
evaluation and identification of the various sustainability issues present within the tea sector of Assam. The
following section presents the review of existing literature. The Sustainability issues in the Tea-Sector of Assam are
discussed in Section 4. The model for ISM and methodology is proposed in Section 5. In the final two sections the
results and discussions are present and conclusions are drawn in the final section.
III. REVIEW OF EXISTING WORK
3.1. Sustainability
Iung and Levrat (2014) in their study have discussed the requirements of advance maintenance services for the
promotion of sustainability.[3]
Ding et al. (2014) did a case study of the Hubei Province of Central China, for measurement of regional
1379 | P a g e
environment. Their result showed that the coordinated development index of Hubei province stayed at a poor levelfor the seven years of investigation. Inspite of the fact that the coordinated development index was consistently
increasing, the average speed of sustainable development was very slow.[4]
Bilge et al. (2014) presented a model-based approach for the assessment of value creation for enhancing
sustainability in manufacturing. They concluded that the results show a positive relation between the strategic
alignment value and sustainability value.[5]
Mani et al. (2014) employed AHP methodology for the determination of supplier selection using social
sustainability in India. In their study many social sustainability criteria were identified through the Delphi process
and the AHP model helped the supply chain managers in socially sustainable supplier selection. In their model
relevant and essential social parameters were used to prioritize the suppliers.[6]
3.2. Interpretive Structural Modeling (ISM)
Hansen et al. (1979) developed three broad steps for the development of an interpretive structural model. In the first
step, ISM begins with an issue or problem. Secondly, the elements that comprised the issue context have been
identified and listed. Finally in the last step, pairs of elements have been compared either graphically or in a relation
matrix using a contextual relationship, which is mostly a verb or a verb phrase.[7]
Porter et al. (1980) have explained that ISM in the form of matrix depicts a directed (causality direction) graphic
representation of a particular relationship among each pair of elements in a set, which helps in structuring a complex
issue area.[8]
Anderson et al. (1994) have highlighted the utility of ISM further as the representation of a problematic situation as
it captures the richness and the variety of complex phenomena.[9]
Nelson et al. (2000) have described the Interpretive Structural Modeling approach in a different way, their study
shows it is relatively more efficient (in some cases) and lends itself to being replicated more effectively.[10]
Sharma et al.(2011) analysed the barriers for reverse logistics from an Indian perspective applying ISM
methodology. Their work helped to identify the hierarchy of actions to be taken for handling different barriers
hindering the implementation of reverse logistics.[11]
Chandramowli et al. (2011) analysed the barriers to development of land-filling communities by the use of ISM.
Their paper highlights the potential of using such techniques to understand and analyze urban planning issues.[12]
Satapathy et al. (2012) used ISM approach for evaluation of the important aspects of customer’s satisfaction in
service quality of E-electricity utility service.[13]
Mathiyazhagan et al. (2013) employed the ISM methodology for the barrier analysis in implementing green supply
chain management. The Interpretive Structural Modeling (ISM) qualitative analysis was used to understand the
mutual influences amongst the twenty-six barriers by survey.[14]
IV. SUSTAINABILITY ISSUES
4.1. Social Issues
1380 | P a g e
The large tea plantations of the state throughout the decades have benefited from low cost local or migrantlabourers. The wage levels are often very low, and in smallholder gardens they get paid at much lower rates than at
the estates. The wage rates of tea garden workers are fixed through a bipartite agreement between the representatives
of employers and the employees of the tea gardens under the plantation labour act (for estates).
4.1.2 Health & Safety Issues Along With Housing Problems
The art of tea-plucking is a tedious and hazardous job. Workers are on their feet for hours bearing the load of the tea
baskets on their shoulders as a result, back problems are common. Additionally they are exposed to pesticides,
mosquitoes, other insects and poisonous snakes which pose a great threat to their health and safety. The low literacy
rate and deprived health status among workers are major constraints in providing them access to major health,
educational and development initiatives and programmes of the state government. Workers in the large tea estates
are generally permanent but in some cases they may be of temporary nature as a result of which they are provided
housing facilities in the plantation as long as they work there. Living conditions in many plantations have been
found to be poor and unsanitary. Workers in tea gardens of Assam are often isolated from mainstream society and
interaction with mainstream society is very low
4.1.3 Discrimination on Various Grounds
The majority of the workers in the tea plantations of Assam are from migrant, marginal and tribal communities. The
total population of the tea tribes community is nearly 6 million which is 20 percent of the total population of the
state[15 ]. Discrimination on grounds of ethnicity and gender can be commonly seen in the plantations. Women are preferred on tea estates, as they are considered better pickers and are more docile and bonded to the tea tea
plantations (child/family care).They have often had very little education, but they have the skills for picking tea
leaves, handed down by the previous generations so they agree to working in the field accepting the very low
wages.
4.1.4 Labour Casualisation and Child Labour Issues
Tea gardens of Smallholder type depend mostly on casual( and family) labour .Casualisation of labour is a major
concern as workers are not guaranteed job security and other benefits which benefit the permanent workers such as
access to medical care for children. Use of child labour in Tea-sector is a common practice worldwide. As a result of
financial needs and lack of education facilities, women plantation workers are often required to take their children to
the tea plantations. Although efforts are made to eradicate child labour nationally (through various government
initiatives) it is highly unlikely that child labour has completely vanished from the tea plantations altogether.
4.1.5 Worker Representation
Inspite of the well organized workers of the tea plantations of Assam, there exists strong rivalry between the various
unions on the tea plantations, which is highly disadvantageous for the workers. Unrest of labour is not always
sustained and turns out to be beneficial for the management. Since plantation workers often originate from specific
1381 | P a g e
4.2. Environmental Issues
4.2.1 Energy Utilization
Tea processing is an energy intensive industry. Withering, drying, grading and packing tea requires considerable
amount of energy nearly 4-18 kWh per kg of tea produced. Various types of feedstock and energy sources such as
firewood, oil, natural gas, electricity, are put into use. The environmental impact of tea processing depends on
factor such as the use of renewable/renewed feedstock and the energy efficiency of the machinery. Drying, the most
energy-intensive phase of tea processing, is mainly carried out using firewood from natural forests as a result of
which extensive deforestation occurs.
4.2.2 Conversion of Habitat
One of the major environmental issues relating to the tea production in the state is habitat conversion. The main
reason behind such occurrence is that the habitat for cultivation is mostly located in more rugged and remote areas
which possess biodiversity of the highest order. Conversion of habitats leads to the reduction of species and due to
presence of sloping land considerable soil loss occurs before the plantations are fully established. Even after well
establishment of the tea plantations rate of soil erosion can be high.
4.2.3 Use of Agrochemicals
Use of a variety of agrochemicals throughout the growing cycle of tea in the plantations is a common practice in
order to protect tea bushes and to enhance productivity. The application of agrochemicals that are listed as
hazardous and toxic has negatively affected the local and wider environment: (severely) reduced soil biodiversity.
Some tea gardens also use pesticides which are banned in developed countries.
4.3. Economic Issues
4.3.1 Diminishing Prices
The cost of production of made tea has increased due among other things to increasing fuel prices and increased
labour costs , however real retail prices over the last two decades have remained constant. In other words, while the
real cost of tea has remained the same for consumers, sourcing costs for retailers and packers have gone down, as
has the income for producers.
4.3.2 Non-uniform Value distribution and buying power concentration
The value chain in tea comprises all the stages from green leaf production through conversion into a bulk packaged
product available for blending and sale to consumers. Value addition takes place for the tea leaves at each stage of
the supply chain, each with associated costs which includes the cost of plucking and sorting, factory packing,
internal transport, warehousing, sales charges (auction and direct), freight, insurance, interest, blending and
packaging and retailers' sales costs.The downstream stages which include blending, packaging and marketing are
the most profitable and this part of the value chain is under the control of a handful of multinational tea packers and
1382 | P a g e
buying front. A handful of companies share domination of trade and retail sales. As auction prices are referenceprices for private sales, lower auction prices result in lower prices in private/direct sales.
V. DESIGN OF RESEARCH AND MEASURES
Data collection was primarily conducted by physical interviews with around 350 workers belonging to various Tea
estates of Assam. Additionally, Industry experts were consulted by telephonic conversations and via e-mails. The
Sustainability Issues which deeply affected them were finally identified after categorization of the points they
mentioned under broad headings. Surveys with questionnaires related to Sustainability issues in the Tea sector of
Assam were also conducted in many cases linguistic barriers existing among various tea tribes in the tea gardens of
Assam did not pose a problem. Hence, measures were taken to obtain valid, reliable and relevant information useful
for the research.
VI. RESULTS AND DISCUSSION
Interpretive Structural Modeling
Interpretive Structural Modeling first proposed by J. Warfield (1973) is an computer- assisted interactive learning
technique which finds its application in the identification and summarizing a relationship among specific variables
which enables individuals or groups to develop a map of the complex relationships among various elements .[16]
The fundamental idea behind ISM is the use of experts’ knowledge and experience for the fragmentation of a
complicated system into several sub-systems (elements) and construction of a multi-level structural model.It is a
very useful tool for the provision of fundamental understanding of complex situations, and to formulation a course
of action for solving a problem.
The Notable Characteristics of ISM are:
(a) It is an interpretive process because the judgement of the group decides whether and how various elements are
related.
(b) Mutual relationship is the basis of the structure as the overall structure is extracted from the complex set of
elements.
(c) ISM is a modeling methodology, as the specific relationships and overall structure is presented in a digraph
model.
(d) The complexity of relationships among various elements of the system gets proper order and direction.
The steps involved in ISM are as follows:
1. Identification of the elements related to the problem by literature review, survey and expert opinion.
2. Establishment of a contextual relationship between the identified elements on the grounds of which pairs of
1383 | P a g e
In this study ISM was applied to thirteen items which are as follows: Low Wages
Health & safety issues along with housing problems
Discrimination on various grounds
Labour casualization and child labour issues
Worker Representation
Energy Utilization
Conversion of habitat
Use of Agrochemicals
Diminishing prices.
Non-uniform value distribution and buying power concentration
3. Development of a Structural Self-Interaction Matrix (SSIM) of the elements which will indicate the pair-wise
relationship between elements of the system. For the Structural Self Interaction Matrix(SSIM), four symbols have
been put into use for denoting the directional relationship between the criterion (i and j) which are:
V: relation from element i to element j and not in both directions.
A: relation from element j to element i and not in both directions.
X: for both directional relations from element i to j and element j to i.
O: relation between elements are not valid.
TABLE 1: Structural Self Interaction Matrix (SSIM) For Sustainability Issues.
SUSTAINABILITY ISSUES
I10 I9 I8 I7 I6 I5 I4 I3 I2
I1
O V O O O O O A AI2
V O V O V A V AI3
V O V O V AI4
O O A A AI5
X A V OI6
V A V OI7
V O OI8
V O1384 | P a g e
4. Development of a reachability matrix from the SSIM and checking the matrix for transitivity.The Structural Self Interaction Matrix gets transformed into a binary matrix, called Initial Reachability Matrix by
substitution of V, A, X, and O by 1 and 0 as per the case. The rules for the substitution of 1s and 0s are as follows:
If the (i, j) entry in the SSIM is V, then the (i, j) entry in the reachability matrix becomes 1 and the (j, i)
entry becomes 0.
If the (i, j) entry in the SSIM is A, then the (i, j) entry in the reachability matrix becomes 0 and the (j, i)
entry becomes 1.
If the (i, j) entry in the SSIM is X, then the (i, j) entry in the reachability matrix becomes 1 and the (j, i)
entry also becomes 1.
If the (i, j) entry in the SSIM is O, then the (i, j) entry in the reachability matrix becomes 0 and the (j, i)
entry also becomes 0.
Final Reachability Matrix is obtained with the basic assumption in ISM of transitivity of the
contextual relation which states if element P is related to Q and at the same time Q is related to R, then
P is also related to R.
TABLE 2. Initial Reachability Matrix
.
Sustainablity Issuues
I1 I2 I3 I4 I5 I6 I7 I8 I9 I10
I1 1 0 0 0 1 1 0 0 1 0
I2 1 1 0 1 1 1 0 1 1 1
I3 1 1 1 1 1 1 0 1 1 1
I4 0 1 1 1 1 0 0 1 0 1
I5 1 1 1 1 1 1 0 1 0 1
I6 0 0 0 1 1 1 0 1 0 1
I7 0 0 0 1 1 0 1 0 0 1
I8 0 0 0 1 1 0 0 1 0 1
I9 0 1 1 1 1 1 0 1 1 1
I10 0 1 1 0 1 0 0 1 0 1
1385 | P a g e
TABLE 3.Final Reachability Matrix
Sustainablity Issuues
I1 I2 I3 I4 I5 I6 I7 I8 I9 I10 DRIVING POWER
I1 1 0 0 0 1 1 0 0 1 0 4
I2 1 1 0 1 1 1 0 1 1 1 8
I3 1 1 1 1 1 1 0 1 1 1 9
I4 0 1 1 1 1 0 0 1 0 1 6
I5 1 1 1 1 1 1 0 1 0 1 8
I6 0 0 0 1 1 1 0 1 0 1 5
I7 0 0 0 1 1 0 1 0 0 1 4
I8 0 0 0 1 1 0 0 1 0 1 4
I9 0 1 1 1 1 1 0 1 1 1 8
I10 0 1 1 0 1 0 0 1 0 1 5
DEPENDENCY 4 6 5 8 10 5 1 8 4 9
5. The reachability matrix is then partitioned into different levels. From the final reachability matrix, the reachability
and antecedant set for each issue is found out. The reachability set comprises of criteria for itself as well as others
which it may help to achieve on the other hand, antecedent set consists of itself and other criterion which helps in
achieving it. The intersection set is subsequently derived and the variables having reachabilty and intersection sets
same are provided the top level in ISM hierarchy.
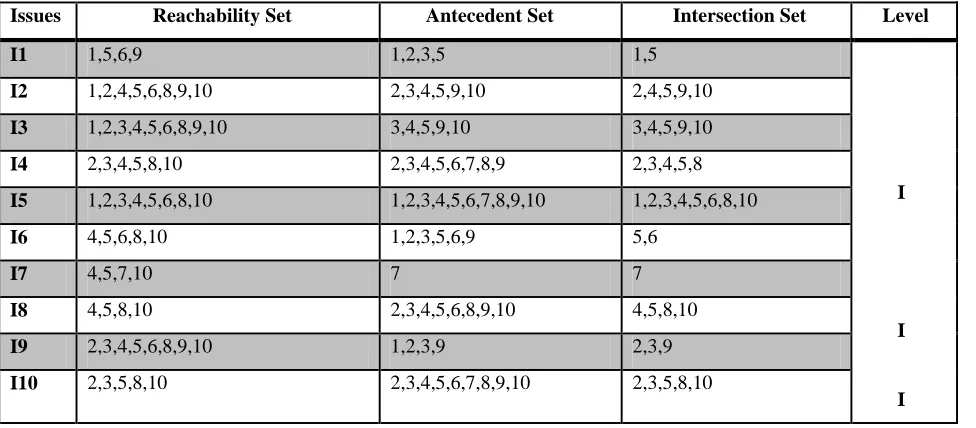
TABLE 4. Partition Of Reachabilty Matrix: Iteration 1
Issues Reachability Set Antecedent Set Intersection Set Level
I1 1,5,6,9 1,2,3,5 1,5
I
I
I
I2 1,2,4,5,6,8,9,10 2,3,4,5,9,10 2,4,5,9,10
I3 1,2,3,4,5,6,8,9,10 3,4,5,9,10 3,4,5,9,10
I4 2,3,4,5,8,10 2,3,4,5,6,7,8,9 2,3,4,5,8
I5 1,2,3,4,5,6,8,10 1,2,3,4,5,6,7,8,9,10 1,2,3,4,5,6,8,10
I6 4,5,6,8,10 1,2,3,5,6,9 5,6
I7 4,5,7,10 7 7
I8 4,5,8,10 2,3,4,5,6,8,9,10 4,5,8,10
I9 2,3,4,5,6,8,9,10 1,2,3,9 2,3,9
1386 | P a g e
TABLE 5.Partition Of Reachabilty Matrix: Iteration 2Issues Reachability Set Antecedent Set Intersection Set Level
I1 1,6,9 1,2,3 1
II
I2 1,2,4,6,9 2,3,4,9 2,4,9
I3 1,2,3,4,6,9 3,4,9 3,4,9
I4 2,3,4 2,3,4,6,7,9 2,3,4
I6 4,6 1,2,3,6,9 6
I7 4,7 7 7
I9 2,3,4,6,9 1,2,3,9 2,3,9
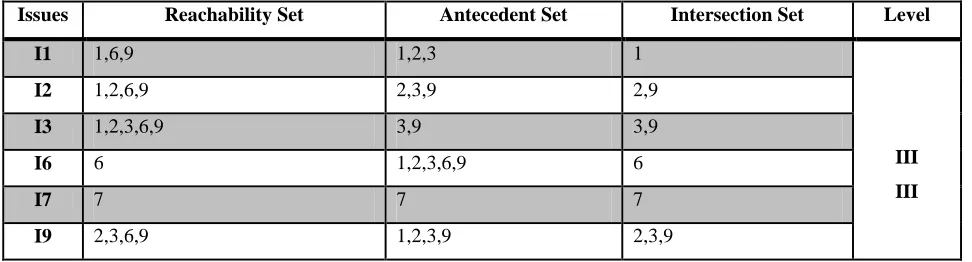
TABLE 6.Partition Of Reachabilty Matrix: Iteration 3
Issues Reachability Set Antecedent Set Intersection Set Level
I1 1,6,9 1,2,3 1
III III
I2 1,2,6,9 2,3,9 2,9
I3 1,2,3,6,9 3,9 3,9
I6 6 1,2,3,6,9 6
I7 7 7 7
I9 2,3,6,9 1,2,3,9 2,3,9
TABLE 7.Partition Of Reachabilty Matrix: Iteration 4
Issues Reachability Set Antecedent Set Intersection Set Level
I1 1,9 1,2,3 1
IV
I2 1,2,9 2,3,9 2,9
I3 1,2,3,9 3,9 3,9
1387 | P a g e
TABLE 8.Partition Of Reachabilty Matrix: Iteration 5
Issues Reachability Set Antecedent Set Intersection Set Level
I1 1 1,2,3 1 V
I2 1,2 2,3 2
I3 1,2,3 3 3
TABLE 9.Partition Of Reachabilty Matrix: Iteration 6
Issues Reachability Set Antecedent Set Intersection Set Level
I2 2 2,3 2 VI
I3 2,3 3 3
TABLE 10.Partition Of Reachabilty Matrix: Iteration 7
Issues Reachability Set Antecedent Set Intersection Set Level
I3 3 3 3 VII
6. Development of ISM Model: A digraph is drawn shown in Fig. 1 and removal of the transitive links based on the relationships given in the reachability matrix takes place. Conversion of the resultant digraph into an ISM-based
model occurs by replacement of the elements nodes with statementsThe digraphs drawn are complex in nature.The
level I barriers are assigned the top level in the hierarchy as they won’t help any other issues to achieve. The barriers
having same level are kept on the same level of hierarchy. The model is finally reviewed for
conceptual-inconsistency check and final modifications are applied.
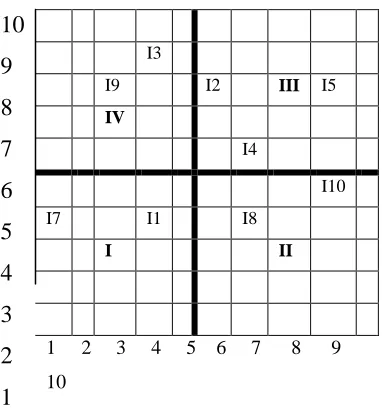
7. MICMAC Analysis:In an ISM model the relationships found are tested by MICMAC Anlysis in which the
1388 | P a g e
FIG. 1 Ism Based Model For Sustainability Issues In The Tea Sector Of Assam
Fig. 2 Driver Power and Dependence Diagram
10
9
8
7
6
5
4
3
2
1
I3
I9 I2 III I5
IV
I4
I10
I7 I1 I8
I II
1 2 3 4 5 6 7 8 9
1389 | P a g e
The four clusters into which enablers are classified in this method are-a) Cluster I: Weak driving power and weak dependence-This group is also known as Autonomous or Excluded
Enablers.
b) Cluster II: Weak driving power and strong dependence- This group of enablers are called as Depending Enablers
c) Cluster III: Strong driving power and strong dependence- These enablers are simultaneously very influent and
very dependent.
d) Cluster IV: Strong driving power and weak dependence- Enablers in this group are altogether very influent and
little dependent.
VII. CONCLUSION
The proposed methodology in this particular research helps in the identification of the hierarchy of actions to be
implemented for dealing with the sustainability issues faced by the workers in the tea sector of Assam. Some of the
sustainability issues have been identified and put into the ISM model for the analysis of interaction between them.
The driver dependence diagram provides with much valuable insight regarding the relative importance and
interdependencies among the sustainability issues. From Fig.2. it can be clearly visualised that discrimination on
various grounds and diminishing prices are the driver variables which are Issues 3 and 9 while on the other hand low
wages and conversion of habitat are autonomous barriers namely Issues 1 and 7. These issues are termed as
autonomous because they have very few links with the system and are to some extent out of line with the system.
Sustainability issues such use of agrochemicals and non-uniform value distribution and buying power concentration
have a weak driving power, but show strong dependency on other issues. This is the indication that all other issues
are required to come together for overcoming the threats related to sustainability issues in the tea sector of Assam.
Issues such as health & safety issues along with housing problems, worker representation and labour casualization
act as linkage variables. They possess strong driver power as well as strong dependency power. These enablers
should be studied with greater attention than the others. From the analysis it can be concluded that three issues
discrimination on various grounds and diminishing prices act as Independent enablers possessing the maximum
driving power. It can be further concluded that these variables are the key issues of sustainability in the tea sector of
Assam.
The Tea sector of Assam is facing many more new challenges in the field of Sustainability due to market changes
and other environmental reasons hence there is a greater requirement of development of new models to keep a
check on the issues affecting the sustainability of the precious industry of the nation. The ISM model proposed in
this research for the identification of sustainability issues in the tea sector of Assam can also be translated to other
sectors belonging to diverse fields for further promotion of sustainable development in the country. The model
suggested will provide authorities with a realistic representation of the problem in the course of successful
1390 | P a g e
ACKNOWLEDGEMENTS
The author would like to thank four anonymous referees for their excellent suggestions and valuable advice in this
paper.
REFERENCES
[1] S. Roy, Historical Review of Growth of Tea Industries in India: A Study of Assam Tea,International Conference
on Social Science and Humanity IPEDR vol.5,Singapore, 2011, 166-170
[2] N. Arya, Growth and Development Of Tea Industry in Assam, International Journal of Scientific & Engineering Research, 4(7), 2013,
[3] J.V. Hansen, L.J. Mckell, L.E. Heitger ISMS: computer-aided analysis for design of decision-support systems, Management Science, 25(11), 1979, 1069–1081.
[4] B. Iung, E. Levrat, Advanced Maintenance Services for Promoting Sustainability, Procedia CIRP, 22, 2014, 15-22.
[5] Y. Ding, B. Vries, Q. Han, Measuring regional sustainability by a coordinated development model of economy, society, and environment: A case study of Hubei Province, Procedia Environmental Sciences, 22, 2014, 131-137.
[6] P. Bilge, F. Badurdeen, G. Seliger, I.S. Jawahir, Model-based approach for assessing value creation to enhance sustainability in manufacturing, Procedia CIRP, 17, 2014, 106-111.
[7] V. Mani, R. Agrawal, V. Sharma,Supplier selection using social sustainability: AHP based approach in India, INTERNATIONAL STRATEGIC MANAGEMENT REVIEW, 2, 2014, 98-112.
[8] A.L. Porter, F.A. Rossini, S.R. Carpenter, A.T. Roper (1980), A guide book for technology assessment and impact analysis, vol 46. North Holland series in system science and engineering, Elsevier, New York.
[9] Nelson K, Nadkarni S, Narayanan VK, Ghods M (2000) Understanding software operations support expertise: a
revealed causal mapping approach, Management Information System Q J, 24(3), 475–507.
[10] J.C. Anderson, M. Rungtusanthanam , R.G. Schroeder A theory of quality management underlying the Deming
management method. Academy Of Management Review, 19(3), 1994, 472–509.
[11] V. Anantatmula, S. Kanungo Establishing and structuring criteria for measuring knowledge management. In: Proceedings of the 38th Hawaii international conference on system sciences, 26, 2005.
[12] S.K. Sharma, B.N. Panda, S.S. Mahapatra , S. Sahu Analysis of Barriers for Reverse Logistics: An Indian Perspective, International Journal of Modeling and Optimization, 1(2), 2011, 101-106.
[13] S. Chandramowli, M. Transue, F.A. Felder, Analysis of barriers to development in landfill communities using interpretive structural modeling, Habitat International, 35(2), 2011, 246-253.
[14] S. Satapathy, S.K. Patel, A. Biswas, P. Mishra, Interpretive structural modeling for E-electricity utility service Service Business An International Journal, 6(3), 2012, 349-367.
[15] K. Mathiyazhagan, K. Govindan, A. NoorulHaq, Y. Geng, An ISM approach for the barrier analysis in
implementing green supply chain management, Journal of Cleaner Production, 47, 2013, 283-297.
1391 | P a g e
BIBILOGRAPHY
Soham Chakraborty
is a research scholar in School of Mechanical Engg in KIIT University,he has currentlypublished two papers in various conferences and journals.His interest area of research is TQM,Sustainability
MGMT etc.
Karishma Das
is a research scholar in School of Mechanical Engg in KIIT University,She has currently publishedtwo papers in various conferences and journals.Her interest area of research is TQM,Sustainability MGMT,Service
operation MGMT. etc
S Satapathy is a research scholar in School of Mechanical Engg in KIIT University,She has currently published
three papers in various conferences and journals.Her interest area of research is TQM,Sustainability MGMT,Service