1170
Development and Validation of a Stability-indicating
Method for the Simultaneous Estimation of Sofosbuvir
and Ledipasvir by RP-HPLC
JAHNAVI BANDLA* AND S. GANAPATY1
Department of Pharmaceutical Analysis and QA, Faculty of Pharmacy, Vishnu Institute of Pharmaceutical Education and Research, Narsapur, Medak-502 313, 1Department of Pharmacognosy and Phytochemistry, GITAM Institute of Pharmacy GITAM University, Rushikonda, Visakhapatnam-530 045, India
1171
sodium hydroxide used were of AR grade and were purchased from Merck Specialties Pvt. Ltd., India and S. D. Fine-Chem Limited, Mumbai. Acetonitrile and water used were of HPLC grade. Tablets (Hepcinat LP) were procured from a local pharmacy. The chromatographic system used was Waters HPLC Alliance 2695 with a PDA detector and equipped with Empower 2 software. The other instruments used were pH meter (EI), digital balance (Infra Instruments), ultrasonic bath (Wadegati), hot air oven (Cisco). OPA (0.1 %) was prepared by diluting 0.1 ml of 85 % OPA in 100 ml of distilled water and pH was adjusted to 2.8 with dilute sodium hydroxide.0.1 % OPA buffer and acetonitrile in the ratio 45:55 % v/v was used as mobile phase. Mixture of water and acetonitrile in the ratio 50:50 % v/v was used as diluent. Standard solutions were (400 µg/ml sofosbuvir and 90 µg/ml ledipasvir) prepared by accurately weighed amount of sofosbuvir (40 mg) and ledipasvir (9 mg) standard drugs were dissolved in 10 ml of diluent. One milliliter of standard stock solution was diluted to 10 ml with diluent. Average weight was calculated for 20 tablets (Hepcinat LP) and an amount equivalent to 40 mg of sofosbuvir was taken into 10 ml volumetric flask. The sample was dissolved in 10 ml of diluent. The above solution was filtered using 0.22 µm filter paper and an aliquot of 1 ml of the solution was diluted to 10 ml with the diluent.
Sofosbuvir[1-4], isopropyl (2S)-2-[[[(2R,3R,4R,5R )- 5-(2,4-dioxopyrimidin-1-yl)-4-fluoro-3-hydroxy- 4-methyl-tetrahydrofuran-2-yl]methoxy-phenoxy-phosphoryl]amino]propanoate (fig. 1A), is a white crystalline solid, slightly soluble in water and has a pKa value of 9.38. It is an antiviral drug acts by inhibiting NS5B polymerase, used in the treatment of hepatitis C. Ledipasvir[5-7], methyl N-[(2S )-1-[(6S)-6-[5-[9,9-Difluoro-7-[2-[(1S,2S,4R)-3-[(2S )-2-(methoxycarbonylamino)-3-methyl butanoyl]-3-azabicyclo[2.2.1]heptan-2-yl]-3H -benzimidazol-5-yl]fluoren-2-yl]-1H-imidazol-2-yl]-5-azaspiro[2.4] heptan-5-yl]-3-methyl-1-oxobutan-2-yl]carbamate (fig. 1B), is white to off-white crystalline solid, slightly soluble in water and has pKa values of 4.0 and 5.0. It is also an antiviral drug acts by inhibiting viral phosphoprotein NS5A, which is involved in viral replication, assembly and secretion. It is used to treat chronic hepatitis C. Literature survey[8,9] reveals that, only ultra-performance liquid chromatography-tandem mass spectrometer method and liquid chromatography with tandem mass spectrometry method were developed for the simultaneous determination of sofosbuvir and ledipasvir. As no reversed-phase high-performance liquid chromatography (RP-HPLC) method has been reported, the present method aimed to develop and validate a stability indicating RP-HPLC method for the simultaneous estimation of sofosbuvir and ledipasvir in bulk and pharmaceutical dosage form.
Sofosbuvir and ledipasvir were supplied as gift samples by Mylan Pharmaceuticals Pvt. Ltd., India with purity 99.9 %, on dried basis. Placebo was also procured from Mylan Pharmaceuticals Pvt. Ltd., India. O-phosphoric acid (OPA), hydrogen peroxide, hydrochloric acid and
*Address for correspondence
E-mail: [email protected]
This is an open access article distributed under the terms of the Creative Commons Attribution-NonCommercial-ShareAlike 3.0 License, which allows others to remix, tweak, and build upon the work non-commercially, as long as the author is credited and the new creations are licensed under the identical terms
Accepted 28 October 2018 Revised 14 April 2018 Received 02 March 2017 Indian J Pharm Sci 2018;80(6):1170-1176
A stability-indicating reversed-phase high-performance liquid chromatography method was developed
and validated for simultaneous quantification of sofosbuvir and ledipasvir in tablets. The chromatographic separation was done in an isocratic mode using the Discovery C18 (250×4.6 mm, 5 µ particle size) column. The mobile phase 0.1 % ortho phosphoric acid and acetonitrile 45:55 (% v/v) at a flow rate of 1.0 ml/min and at ambient temperature was used. The wavelength used for detection was 270 nm. The retention time for sofosbuvir was found to 2.08 min and that of ledipasvir was 3.06 min. Sofosbuvir and ledipasvir were linear in the concentration ranges of 100 to 600 µg/ml and 22.5 to 135 µg/ml, respectively. The developed method was validated and found to be accurate, specific and robust. Both the drugs were subjected to the stressed conditions like acidic, basic, oxidative, photolytic and thermal conditions. The degradation results were found satisfactory. This method could be applied for the simultaneous estimation of sofosbuvir and ledipasvir in tablets.
1172
November-December 2018
System suitability parameters were noted by injecting the standard solution five times into HPLC system. The results were summarized in Table 1. The specificity study was conducted using placebo method. Placebo solution was injected twice into the column and its interference with that of standard solution was observed[10-12].
Precision (% RSD) of the method was determined by injecting six sample solutions and peak areas were noted. For determination of accuracy of the method, samples were prepared by spiking method at 50, 100 and 150 % of the target concentration. The average
percent recoveries of sofosbuvir and ledipasvir were determined.
A series of standard solutions (25 to 150 %) were prepared and peak areas were noted. A graph was plotted “peak area” versus “concentration” in linearity section. The results and linearity plots are shown in Table 1 and fig. 2A and B. Limit of detection (LOD) and limit of quantification (LOQ) were determined by using the formula mentioned in ICH guideline.
A
B
Fig. 1: Chemical Structure of A. sofosbuvir and B. ledipasvir
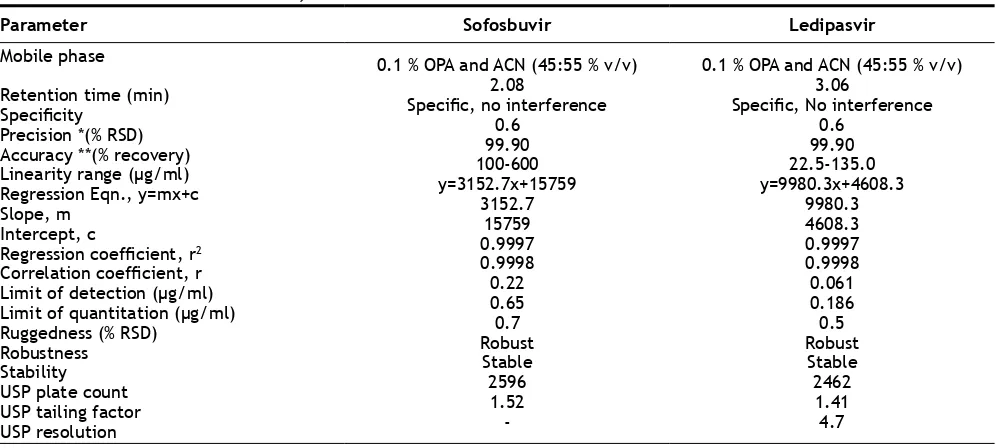
Parameter Sofosbuvir Ledipasvir
Mobile phase
Retention time (min) Specificity
Precision *(% RSD) Accuracy **(% recovery) Linearity range (µg/ml) Regression Eqn., y=mx+c Slope, m
Intercept, c
Regression coefficient, r2
Correlation coefficient, r Limit of detection (µg/ml) Limit of quantitation (µg/ml) Ruggedness (% RSD)
Robustness Stability USP plate count USP tailing factor USP resolution
0.1 % OPA and ACN (45:55 % v/v) 2.08
Specific, no interference 0.6
99.90 100-600 y=3152.7x+15759
3152.7 15759 0.9997 0.9998 0.22 0.65 0.7 Robust
Stable 2596 1.52
-0.1 % OPA and ACN (45:55 % v/v) 3.06
Specific, No interference 0.6
99.90 22.5-135.0 y=9980.3x+4608.3
9980.3 4608.3 0.9997 0.9998 0.061 0.186 0.5 Robust Stable 2462 1.41 4.7
*Mean of six estimations, **mean of three estimations, OPA: ortho phosphoric acid, ACN: acetonitrile
TABLE 1: SYSTEM SUITABILITY, VALIDATION PARAMETER AND LINEARITY RESULTS A
B
y = 3152.7x + 15759 R² = 0.9997
0 500000 1000000 1500000 2000000 2500000
0 100 200 300 400 500 600 700
Concentration (µg/ml)
Pe
ak
A
re
a
y = 9980.3x + 4608.3 R² = 0.9997
0 200000 400000 600000 800000 1000000 1200000 1400000 1600000
0 50 100 150
Concentration (µg/ml)
Pe
ak
A
re
a
1173
Ruggedness (% RSD) was conducted by analyzing the samples on different days. Robustness was evaluated by varying the optimum conditions with ±5 % of organic phase, ±0.2 ml/min of flow rate and ±5° of the column oven temperature. System suitability parameters were checked and if any parameter fails, the variations were narrowed and the allowable ranges of variations were established. The results were summarized in Table 2. The stability of drugs in solution was determined by analyzing the samples during the course of experimentation on the same day and also after storage of drug solution for 24 h. The results were summarized in Table 3.
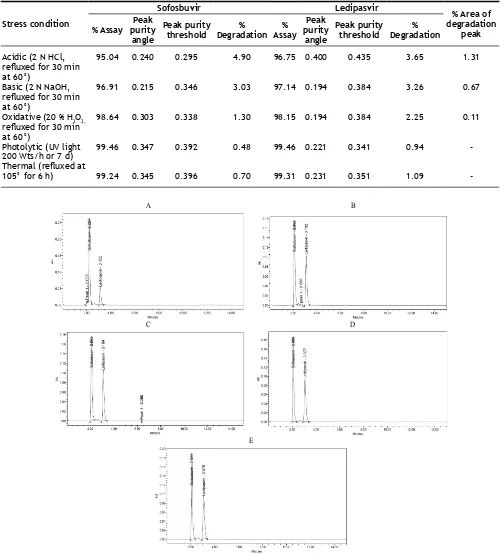
Forced degradation studies[13-15] were performed under different stress conditions using standard stock solution (Table 4). Each 1 ml of standard solution was taken into three 10 ml volumetric flasks. Then 1 ml of hydrochloric acid (2 N), 1 ml of sodium hydroxide (2 N) and 1 ml of hydrogen peroxide (20 %) was added to each volumetric flask and refluxed for 30 min at 60°. These solutions were diluted to obtain concentration of standard solutions and their chromatograms were
Drug Parameters 50 Variation of organic phase (%v)55 60
Sofosbuvir Retention time (min)Tailing factor
% RSD USP plate count
2.07 1.54 0.2 2542 2.08 1.52 0.4 2596 2.11 1.54 0.3 2538 Ledipasvir
Retention time (min) Tailing factor
% RSD USP plate count
USP resolution 2.91 1.46 0.4 3095 4.4 3.07 1.41 0.3 2462 4.7 3.45 1.41 0.3 3163 6.4
Drug Parameters Variation in flow rate (ml/min)
0.8 1.0 1.2
Sofosbuvir Retention time (min)Tailing factor
% RSD USP plate count
2.08 1.52 0.7 2465 2.08 1.52 0.4 2596 1.88 1.62 0.4 2413 Ledipasvir
Retention time (min) Tailing factor
% RSD USP plate count
USP resolution 3.09 1.41 0.6 2469 4.7 3.07 1.41 0.3 2462 4.7 2.79 1.44 0.6 2550 4.7
Drug Parameters 20Variation in column oven temperature (°)25 30
Sofosbuvir Retention time (min)
Tailing factor % RSD USP plate count
2.08 1.52 0.3 2511 2.08 1.52 0.4 2596 2.08 1.53 0.7 2561 Ledipasvir
Retention time (min) Tailing factor
% RSD USP plate count
USP resolution 3.09 1.45 0.5 3053 5.0 3.07 1.41 0.3 2462 4.7 3.09 1.41 0.9 2498 4.7
TABLE 2: ROBUSTNESS RESULTS
recorded to assess the stability of sample (fig. 3A-C). To assess the stress testing for thermal conditions standard solution was placed in oven at 105° for 6 h and for the photolytic conditions, the drug solution was exposed to UV light by keeping in UV chamber for 7 d or 200 Watt h/m2 in photo stability chamber. Then the resultant solutions were diluted to obtain concentration of standard solution and their chromatograms were recorded to assess the stability of sample (fig. 3D and E). The results are summarized in Table 2.
1174
November-December 2018
Stress condition
Sofosbuvir Ledipasvir
% Area of degradation
peak % Assay purity Peak
angle
Peak purity
threshold Degradation% Assay% Peak purity
angle
Peak purity
threshold Degradation%
Acidic (2 N HCl, refluxed for 30 min at 60°)
Basic (2 N NaOH, refluxed for 30 min at 60°)
Oxidative (20 % H2O2,
refluxed for 30 min at 60°)
Photolytic (UV light 200 Wts/h or 7 d) Thermal (refluxed at 105° for 6 h)
95.04
96.91
98.64
99.46
99.24
0.240
0.215
0.303
0.347
0.345
0.295
0.346
0.338
0.392
0.396
4.90
3.03
1.30
0.48
0.70
96.75
97.14
98.15
99.46
99.31 0.400
0.194
0.194
0.221
0.231
0.435
0.384
0.384
0.341
0.351
3.65
3.26
2.25
0.94
1.09
1.31
0.67
0.11
-TABLE 4: FORCED DEGRADATION DATA
Drug Parameter Day 1 Day 2
Sofosbuvir
Ledipasvir
% Assay* % RSD** % Assay* % RSD**
100.45 0.6 100.20
0.6
99.90 0.7 99.92
0.5
TABLE 3: SOLUTION STABILITY RESULTS
*Mean of three estimations, **mean of six estimations
A B
C D
E
Fig. 3: Degradation study chromatograms
1175
Fig. 4: Individual and overlain UV spectra of sofosbuvir and ledipasvir
Individual UV spectra of A. sofosbuvir (▬▬) B. ledipasvir (▬▬) and C. Overlain UV spectra of sofosbuvir and ledipasvir
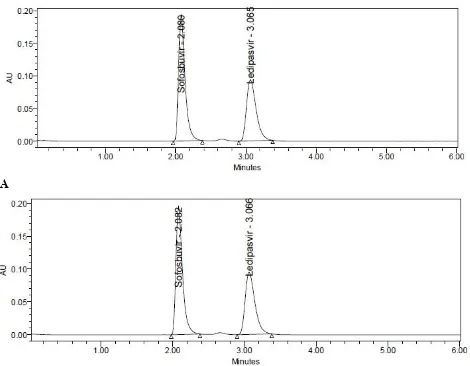
A
B
Fig. 5: Chromatograms of standard and sample analytes Chromatograms of A. standard sofosbuvir and ledipasvir and B. of the test samples of sofosbuvir and ledipasvir
using Discovery C18, 250×4.6 mm, 5 µ column. The mobile phase 0.1 % OPA and acetonitrile (45:55 v/v) run in isocratic mode and flow rate 1.0 ml/min was selected. The retention times of sofosbuvir and ledipasvir were found to be at 2.08 and 3.06 min, respectively (fig. 5A-B).
The calibration curve of peak area versus concentration was plotted with the optimized chromatographic conditions, stock solution of sofosbuvir and ledipasvir using mobile phase and various concentration ranges of 100 to 600 µg/ml and 22.5 to 135 µg/ml were prepared and the chromatograms were recorded. The linearity plots were drawn by taking concentration on x-axis and peak area on y-axis. Correlation coefficients 0.999 indicate that the concentrations of sofosbuvir and ledipasvir have given good linearity and obey Beer-Lamberts law. The method was accurate and was confirmed by recovery studies, percent recovery of sofosbuvir was found to be 99.90 % and that of ledipasvir was found to be 99.90 %. For precision study, 10 µl of six sample solutions were injected. The % RSD value for sofosbuvir and ledipasvir was found to be 0.6 and 0.6, respectively, indicating the method to be precise. The LOD for sofosbuvir and ledipasvir were found to be 0.22 and 0.061 µg/ml, respectively and LOQ for sofosbuvir and ledipasvir were found to be 0.65 and 0.186 µg/ml, respectively. Ruggedness of the proposed method was determined and the % RSD reported was found to be less than 2. The robustness was determined and the values indicated that the method was quite robust. The results from the solution stability study confirmed that drugs were stable up to 24 h. Forced degradation studies indicated that the samples were stable under different stress conditions
such as acidic, basic, oxidative, photolytic and thermal conditions. The net degradation was found to be within the limits.
In the proposed study, stability-indicating RP-HPLC method was developed for the simultaneous determination of sofosbuvir and ledipasvir in bulk drug and tablet form. The method was validated according to ICH guidelines and was found to be linear, precise, accurate, specific and robust. From the degradation studies conducted it is concluded that sofosbuvir and ledipasvir were more stable at more concentrations of acid, base, peroxide, thermal and UV stress study. The run time was 6 min, which enables rapid quantitation of many samples in quality control analysis of tablet formulations.
Acknowledgements:
The authors thank the Mylan Laboratories Pvt. Ltd., Hyderabad for providing sofosbuvir and ledipasvir as gift samples. They also thank the Spectrum labs, Hyderabad for providing required facilities to carry out this work.
Conflict of interest:
There is no conflict of interest, financial or otherwise associated with this project.
REFERENCES
1. Turker M. FDA Approves ‘Game Changer’ Hepatitis-C Drug
Sofosbuvir. Available from: https://www.medscape.com/ viewarticle/817371.
1176
November-December 2018
oral agent for chronic hepatitis-C. Ann Gastroenterol 2014;27(4):331-7.
3. Gilead Sciences, Inc. Harvoni (ledipasvir and sofosbuvir) tablets prescribing information. Available from: https:// www.gilead.com/-/media/files/pdfs/medicines/liver-disease/ harvoni/harvoni_pi_old.pdf?la=en.
4. Kowdley KV, Gordon SC, Reddy KR. Ledipasvir and Sofosbuvir for 8 or 12 weeks for chronic HCV without cirrhosis. N Engl J Med 2014;370:1879-88.
5. Kumari R, Nguyen M. Fixed-dose combination of sofosbuvir and ledipasvir for the treatment of chronic hepatitis C genotype 1. Expert Opin Pharmacother 2015;16(5):739-48.
6. Younossi ZM, Stepanova M, Marcellin P, Afdhal N, Kowdley KV, Zeuzem S, et al. Treatment with ledipasvir and sofosbuvir improves patient-reported outcomes: Results from the ION-1, -2, and -3 clinical trials. Hepatology 2015;61(6):1798-808. 7. Waheed Y. Ledipasvir and sofosbuvir: Interferon free therapy
for hepatitis C virus genotype 1 infection. World J Virol 2015;4(1):33-5.
8. Pan C, Chen Y, Chen W, Zhou G, Jin L, Zheng Y, et al. Simultaneous determination of Ledipasvir, Sofosbuvir and its metabolite in rat plasma by UPLC-MS/MS and its application to a pharmacokinetic study. J Chromatogr B Analyt Technol Biomed Life Sci 2016;1008:255-59.
9. Rezk MR, Bendas ER, Basalious EB, Karim IA. Quantification of Sofosbuvir and Ledipasvir in human plasma by UPLC-MS/ MS method: Application to fasting and fed bioequivalence studies. J Chromatogr B Analyt Technol Biomed Life Sci 2016;1028:63-70.
10. ICH, Q1A, Stability Testing of New Drug Substances and
Products. Available from: http://www.ich.org/products/ guidelines/quality/quality-single/article/stability-testing-of-new-drug-substances-and-products.html.
11. ICH, Q2A, Harmonized Tripartite Guideline, Test On Validation of Analytical Procedures. Available from: https:// www.ich.org/fileadmin/Public_Web_Site/ICH_Products/ Guidelines/Quality/Q2_R1/Step4/Q2_R1__Guideline.pdf. 12. ICH, Q2B, Harmonized Tripartite Guideline, Validation of
Analytical Procedure: Methodology. Available from: https:// www.ich.org/fileadmin/Public_Web_Site/ICH_Products/ Guidelines/Quality/Q2_R1/Step4/Q2_R1__Guideline.pdf. 13. Ngwa G. Forced degradation studies. Forced degradation
as an integral part of HPLC stability indicating method development. Drug Deliv Technol 2010;10(5):1-4.
14. Kats M. Forced degradation studies: regulatory considerations and implementation. BioPharm Int 2005;18(7):1-7.
15. Iram F, Iram H, Iqbal A, Husain A. Forced Degradation Studies. J Anal Pharm Res 2016;3(6):00073.
16. Synder LR, Galjch JL, Kir Kland JL. Practical HPLC method development. 2nd ed. Hoboken, New Jersey, United States: John Wiley and Sons; 1997.
17. Swartz ME, Jone MD, Fowler P, Andrew MA. Automated HPLC method development and transfer. LC GC N Am 2002;75:49-50.
18. Synder LR, Kirkland JJ, Glajach JL. Practical HPLC Methods Development. New York: John Wiley; 1997. p. 643-712. 19. Swartz M, Murphy MB. New Fronties in Chromatography.