What Is Important When Shopping Online?
Kaye McKinzie, University of Central Arkansas, USAKen Griffin, University of Central Arkansas, USA Pat Cantrell, University of Central Arkansas, USA
Vicky Chen, Acxiom Corporation, USA
ABSTRACT
Shoppers have many avenues on where to purchase products, one of which is online. Many online retailers do not apply state and local sales taxes on products they sell, thus allowing them to sell their products cheaper than can be found at local retailers. If the physical presence nexus rule is altered and Internet sales tax is applied for all online transactions, it could potentially change online shopping. The results of a survey of 154 persons are presented, discussing the potential impact of the changing of the physical presence nexus rule and requiring Internet sales tax.
Keywords: E-commerce; taxation; Internet; nexus
INTRODUCTION
ince the U.S. Supreme Court’s 1992 decision in Quill v. North Dakota, the taxability of online transactions has been governed by the physical presence nexus rule: If an online retailer has a physical presence (such as a store, business office, or warehouse) in a particular state, it must collect sales tax from customers in that state. If a business does not have a physical presence in a state, it is not required to collect sales tax for sales from customers in that state. This rule has recently been called into question by various organizations. There is a move to alter this rule which calls for Internet tax to be collected for all online transactions. This tax rate would be applied exactly as sales tax would be for a local store at the point of delivery. The Internet Tax Freedom Act of 2007 extended the moratorium on no new Internet taxes until 2014. While this might reduce the pressure to tax commerce on the Internet in the short run, it is still a national problem. Those in favor of Internet taxation point to the loss of tax revenue regardless of whether it is bricks and mortar sales or transactions over the Internet. Those opposed to Internet taxation point to increasing taxes and fees that will result in more expense for the consumer and thus will restrict the growth of Internet use and e-commerce (Griffin, Smith, and Watson, 2009). It is estimated that by 2012, the revenue loss from non-taxation of e-commerce will be 12.65 billion dollars per year (Bruce, Fox and Luna, 2009). This estimate is a tremendous force driving the efforts to tax e-commerce. Any effort to tax remote vendors must address the requirements of the Due Process Clause of the Commerce Clause of the United States Constitution. The current tax collection system is not viable for e-commerce and the The Streamlined Sales Tax and Use Agreement is an effort to minimize the confusion of e-commerce sales tax collections and would bring some certainty to tax collections.
Any attempt to tax Internet commerce has the potential to change the way shoppers currently shop online and it prompted the implementation of this survey. We were concerned in finding out not only how people use the Internet for shopping, but potentially how it might change if local sales taxes were applied to all online purchases.
THE SURVEY
This portion of the analysis focuses on who the survey respondents were and what motivated them to shop online. Specifically, this paper analyzes who uses the Internet for online shopping and why they shop online. This survey (Appendix) was designed and distributed electronically via Survey Monkey (www.surveymonkey.com) from May 2010 until November 2010 with a total of 161 responses. Of those, seven were blank, leaving 154 valid responses. Statistical analysis and comparisons of the demographics are followed by an analysis of why they shop online. This paper ties the two together to make conclusions about the potential impact of applying Internet sales tax to all online purchases.
RESPONSE DATE/SAMPLE SIZE
The survey began in May 2010 by being distributed via an e-mail link to lists provided by the authors. Recipients of that e-mail were encouraged to further distribute the survey link for two months. This resulted in 83 responses. The survey was then distributed to students at the University of Central Arkansas (UCA) College of Business who were taking either Data Analysis or Statistics in the fall term. This increased the sample size to a total of 154, as indicated in Figure 1.
Figure 1: Survey Responses
RESPONDENT DEMOGRAPHICS
There were almost an equal number of men (74) and women (79) responding, with only one respondent not identifying their gender or marital status. Also, two of the women did not identify their marital status. Of the 151 respondents who did identify their marital status, most were single (75) with the next largest category being married (60). The makeup of the entire sample is shown in Figure 2.
The age brackets in this survey roughly correspond to commonly defined ages for retirees (65+), baby boomers (45-64), Generation X (31-44), and Generation Y (18-30). As shown in Figure 3, most of our respondents were Generation Y (72) and had some college (62), which was understandable since many of our respondents were currently undergraduate students. The same respondent did not identify their gender, marital status, age, education, or income bracket.
Figure 3: Age/Education
Income categories were set to roughly resemble income brackets used on the United States Income Tax categories. Two baby boomer married women with post-graduate degrees did not reply to the income question, and the previously-mentioned respondent, who did not identify their gender/marital status/age/education, did not mention their income. The other 151 respondents did. The largest income group was between $100,000 and $169,000 (37). Most of these respondents submitted their survey in May, indicating they were not UCA students (Figure 4).
Figure 4: Income
0 10 20 30 40 50 60 70
Blank
65 and older
45 to 64
31 to 44
Most of the respondents own their own home (Figure 5). Since most of these home owners responded in May and June, they are probably not current students at UCA. Of the 18 who responded "other", all but one responded to the survey in September – November, indicating they are most likely students at UCA. The person who responded in May is a married man 65 or older and living in Florida.
Figure 5: Own/Rent
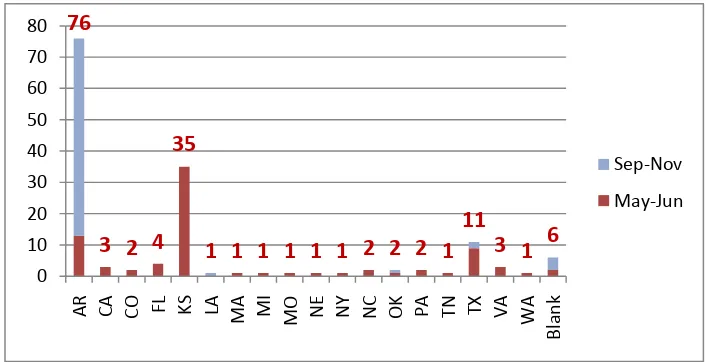
Seventy-six of the respondents currently live in Arkansas (Figure 6) and 63 of them submitted their survey in the Sep-Nov time frame. A total of 83 submitted their surveys in May-June and 71 in Sep-Nov. Of those that submitted in the Sep-Nov time frame, 63 came from Arkansans, along with four others who live in LA, TX and OK and four who did not disclose. Of these eight, seven are in the 18-30 age bracket and one is in the 31-44 age bracket, lives in OK and responded in Oct. Since one of the UCA Statistics classes is offered online, it is feasible that in fact all 71 of the respondents in Sep-Nov are students.
Figure 6: Where They Currently Live
These demographics clearly show a wide range of respondents who live in geographically dispersed regions of the US and have a wide range of income and education. In addition, different genders, marital status and
76
3 2 4
35
1 1 1 1 1 1 2 2 2 1
11
3 1
6
010 20 30 40 50 60 70 80
AR CA CO FL KS LA MA MI MO NE NY NC OK PA TN TX VA WA
Blan
k
Sep-Nov
home ownership are represented. Although a significant majority of respondents live in the central part of the US (AR and KS), there is no reason to presume that this biases their survey responses.
CHANGE IN INTERNET USAGE
Respondents were given a 5-point Likert scale with options ranging from Decreased Significantly to Increased Significantly and were asked how their Internet usage changed in the past five years. As shown in Figure 7, most respondents indicated that their Internet usage had increased significantly (92, 59.4%) and none indicated a decrease.
Figure 7: Internet Usage
Statistical testing showed that all three categories had a sufficient number of responses to pass the Sample Size test to use the Central Limit Theorem and conclude the data as Normal. Confidence Interval (CI) testing showed that the proportion of respondents whose Internet usage increased significantly was statistically significantly higher than the other categories. No conclusion was possible for Increased Slightly and No Change as their CI's overlapped each other. One-sided hypothesis tests were also inconclusive for these two categories.
Further analysis was attempted by comparing the change in Internet usage between each age group; however, the sample size was only sufficient to compare the 18-30 and 45-64 age groups. For both these age groups, their Internet usage change was statistically shown to be in the same order as shown in Figure 7. This proves that for these two age groups, Internet usage is significantly increasing.
HOW DO YOU SHOP ONLINE
Figure 8: Purpose of Shopping Online
Confidence intervals (Table 1) were established using an alpha of 0.05, resulting in the Cheapest category being statistically and significantly different from the others with overlaps in the other two categories.
Table 1: Primary Reason for Online Shopping
Do Not Quickest Delivery Cheapest p-hat Lower 0.0420 0.1069 0.6290
p-hat 0.0774 0.1548 0.6903
p-hat upper 0.1128 0.2028 0.7516
Further testing of the difference between proportions for Do Not and Quickest Delivery showed that the confidence intervals of the differences between these proportions included zero, again rendering inconclusive that one is preferred over the other. Finally, a one-sided hypothesis test was conducted for these variables to determine the value at which we could be 95% confident that their proportion was less. Each of these tests also proved inconclusive.
This data was further analyzed by breaking down each category by age group and testing to see if the relationship between Cheapest and the others was maintained. Only the youngest (18-30) and the 45-64 age categories had enough respondents to pass the Sample Size Condition to assume a Normal distribution based on the Central Limit Theorem (but not in the Research category). Both of these age groups confirmed that Cheapest remained the top reason for shopping online and showed no distinction between Do Not and Quickest Delivery.
Although not all age groups could be tested separately, the 18-30 and 45-64 age groups mirrored the all ages assessment statistically, showing that the primary reason for shopping online was price.
IMPORTANCE IN CHOOSING TO SHOP ONLINE
Figure 9: Box-Whiskers for Importance in Shopping Online
Since the other categories were statistically inconclusive in this Box-Whiskers plot, we conducted additional statistical tests on them to determine any differences. Each category was evaluated using Sample Size Condition tests and determined to be approximately Normal due to the Central Limit Theorem. Using a 95% confidence interval (CI), each category was assessed against each other with the results shown in Table 2.
No CIs overlap that for Overall Cost, confirming the previous Box-Whiskers. In addition, where previously inconclusive under the Box-Whiskers test, using the stronger CI test, it was now evident that Time For Product to Arrive is clearly the second most important reason for online shopping. It is also clear from the CI testing that Delivery Methods is not one of the top four reasons of importance.
Table 2: CI for Importance in Shopping Online Overall
Cost
Time for Product to Arrive
Time Expended in
Product Selection Variety
Product Research Comparisons
Delivery Methods Lower 1.53 2.90 3.40 3.46 3.74 4.03
Mean 1.90 3.13 3.65 3.71 4.04 4.25
Upper 2.28 3.36 3.89 3.95 4.34 4.47 The relative ranks of the other reasons for shopping online were indistinguishable with confidence intervals as there was overlap with Selection and Variety, with Variety and Research, and with Research and Delivery. Each of these reasons was tested against each other with one-sided hypothesis testing using alpha = 0.05. The results showed no distinction between Selection and Variety and none between Research and Delivery. However, there were statistically significant differences showing that Selection and Variety were more important than Research and Delivery.
This survey question confirms the results of the previous survey question that Item Cost is the most important reason when choosing to shop online. It further shows that the second most important reason is the Time to Get the Product in the hands of the consumer.
1
3 3
4 4 4
Figure 10: Shopping Priorities
CONCLUSION
This research statistically shows that Overall Product Cost is the most important reason for people to shop online. It also statistically shows that there is no distinction between how respondents in the 18-30 year old age group and those in the 45-64 age group view their priorities in why they shop online, which is the same as that when all age groups are combined.
Since Overall Cost was clearly the most important factor and Time for Product to Arrive the second most important factor, any increase in cost of the item could have repercussions in online shopping. If applying local sales taxes to products purchased online causes those products to no longer be cheaper, consumers may reduce their preference of online shopping. The potential to tax online shopping may cause the most important factor to be how quickly the customer can get the item in their possession, causing the customer to purchase the items locally as they might get them sooner.
AUTHOR INFORMATION
Dr. Kaye McKinzie is a Visiting Professor of MIS at the University of Central Arkansas. She has taught at the US Army War College and the US Army Logistics Management College. Dr. McKinzie is a graduate of the United States Military Academy, Naval Postgraduate School and has a Ph. D. from the University of Texas at Austin in Operations Research.
Dr. Ken Griffin is Professor and Chair of the MIS Department at the University of Central Arkansas. He has degrees in Electrical Engineering, MBA and DBA all from Louisiana Tech University. Dr. Griffin has over 40 years experience in MIS and his research has been published in more than 50 journal articles.
Dr. Pat Cantrell is Dean of the College of Business Administration at the University of Central Arkansas. She has a BA, MA and Ph. D. degree in Economics from Southern Methodist University. She serves on numerous boards and community organizations while maintaining a research agenda.
Ms. Vicky Chen is a graduate of the University of Central Arkansas with degrees in Computer Science and a MBA. She is currently employed by Acxiom Corporation as a Software Developer. Ms. Chen is experienced in maintaining databases.
Cost
Arrival
Selection &
Variety
REFERENCES
1. Bruce, Donald, Fox, William and Luna, LeAnn (2009). State and Local Government Sales Tax Revenue Losses from Electronic Commerce. Center for Business and Economic Research, University of Tennessee. 2. Griffin, Ken, Smith, LeaAnn, and Watson, Stephanie. (2009) Caught in a Web of Jurisdiction: Foreign and
Domestic Taxation of the Internet. Business Research Yearbook. International Academy of business Disciplines.
3. McKinzie, K, Griffin, G, and Cantrell, P. (2010). Internet taxation survey. Survey Monkey, http://www.surveymonkey.com/s/3W8TBWP.
APPENDIX
Survey Questions Analyzed 1. Gender:
Male
Female 2. Marital Status:
Single
Married
Divorced
Widowed 3. Age:
18 and under
19 to 30
31 to 44
45 to 64
65 and older 4. Level of education:
Did not complete high school/GED
Completed high school/GED
Some college/Trade school
College/Trade school graduate
Postgraduate degree 5. Gross family income:
Under $10,000
$10,000 to $19,999
$20,000 to $29,999
$30,000 to $39,999
$40,000 to $49,999
$50,000 to $59,999
$60,000 to $69,999
$70,000 to $79,999
$80,000 to $89,999
$90,000 to $99,999
$100,000 to $169,999
$170,000 to $372,999
$373,000 and over 6. What state do you live in?
7. Do you own or rent your home?
Own
Rent
8. Please select the answer that best fits your online shopping:
I do not purchase items online.
I research items on line, but always purchase at "brick and mortar" stores.
I purchase items based on quickest delivery.
I purchase items based on where they are cheaper: "brick and mortar" or online (to include shipping and handling).
9. Which are the most important when you choose to shop online? Rank order.
Overall cost.
Time expended in product selection.
Time for product to arrive.
Delivery methods.
Variety.