http://www.sciencepublishinggroup.com/j/wjac doi: 10.11648/j.wjac.20190403.11
ISSN: 2637-5966 (Print); ISSN: 2637-5982 (Online)
Evolution of the Romanian Pharmaceutical System in the
Period 1990-Present
Toma Elena Cristina
Emergency University Hospital, Clinic Pharmacy, Bucharest, Romania
Email address:
To cite this article:
Toma Elena Cristina. Evolution of the Romanian Pharmaceutical System in the Period 1990-Present. World Journal of Applied Chemistry. Vol. 4, No. 3, 2019, pp. 30-34. doi: 10.11648/j.wjac.20190403.11
Received: August 28, 2019; Accepted: September 9, 2019; Published: September 27, 2019
Abstract:
In this study I present the evolution of the number of Pharmacies, Pharmacists, Pharmacy graduates, Pharmacy/Population ratio, Pharmacist/Population after 1990. If in 1990 there were 1948 pharmacies, in 2017 their number reached 7945. And the number of pharmacists increased in a fast pace, in 1990 were 6286 to a population of 23206720 inhabitants, in 2017 their number reached 17833 in a population of 19588146 inhabitants. In 2017 the Pharmacy/Population ratio is 2465 and the Pharmacist/Population ratio is 1098. This increase in the number of pharmacists was due to the establishment of new Pharmacy Faculties in different cities of the country after 1990. I also succinctly present the Legislation that has undergone a number of changes over time and has influenced the evolution of these indicators: Law No. 95 of 14 April 2006 on Health Reform, Order of the Minister of Health No. 2234 of 1994, Order of Health Minister No. 201 of 1999, Order of the Minister of Health and Family No. 626 of 2001, Order of Health Minister No. 1199 of 2004, Order of Health Minister No. 962/2009, Law No. 266 of 2008 of the Pharmacy, Law No. 266 of 2008 of the Pharmacy, Reprocessed, Law No. 46 of 21 January 2003 on Patients' Rights.Keywords: Pharmaceutical System, Pharmacies, Pharmacists, Pharmaceutical Indicators
1. Introduction
When we speak of the Romanian pharmaceutical system, of course we all think about its efficiency, the costs of providing the medicine to the population, the quality of the pharmaceutical act and, last but not least, to the beneficiary for whom this system is organized: the patient.
The transition to the market economy also meant a permanent debate on the criteria and conditions for the establishment and functioning of the pharmacy [1].
Pharmacists are considered an integral part of the health services system, because from these patients can obtain accessible information in a relaxed environment without needing programming. Law No. 95 of 2006 on Health Reform, establishes the activities which the holder of the official title of pharmacist carries out, including the provision of information and advice on medicinal products, cooperation with the physician for the establishment and monitoring of patient therapy [2].
2. Objective
Evolution of human and materials resources from the Romanian Pharmaceutical System and Pharmaceutical Legislation after 1990.
3. Materials and Method
For the realization of this article I studied Statistical Yearbook, Literature, Legislation, I used the statistic method. The statistical method is based on the collection, processing and valorisation of data on the elements taken in the study. In order to achieve the proposed objective, we have studied the following elements: human and materials resources (pharmacists, pharmacist graduates, pharmacies).
4. Results and Discussions
If the census of 1990 Romanian population counted 23206720 inhabitants, in 2017 their number reached 19588146.
The number of pharmacies has steadily increased, changing the existing property type. In Table 1 I regive the number of pharmacies in the period 1990-2017 [3].
Table 1. Number of pharmacies in the period 1990-2017.
Year Pharmacies Year Pharmacies Year Pharmacies
1990 1948 2000 4267 2010 6686
1991 1748 2001 4268 2011 6975
1992 1226 2002 4285 2012 7226
1993 3058 2003 4428 2013 7560
1994 3028 2004 4772 2014 7825
1995 3332 2005 5071 2015 7758
1996 3603 2006 5347 2016 7802
1997 3757 2007 5902 2017 7945
1998 3969 2008 6127 - -
1999 4052 2009 6502 - -
Source: Statistical Yearbook of Romania 1991-2018
If in 1990 there were 1948 pharmacies, in 2012 their number reached 7226 (increase of 3.71 times), and in 2017 they reach 7945 (increase of 4.07 times).
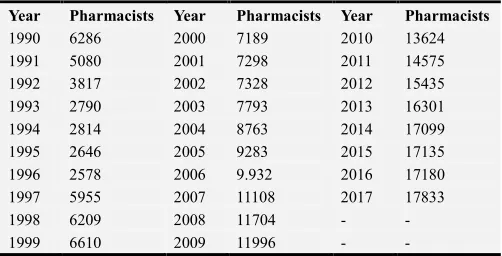
In Table 2 we extracted from the Yearbook the number of pharmacists in the period 1990-2017:
Table 2. Number of pharmacists in the period 1990-2017.
Year Pharmacists Year Pharmacists Year Pharmacists
1990 6286 2000 7189 2010 13624
1991 5080 2001 7298 2011 14575
1992 3817 2002 7328 2012 15435
1993 2790 2003 7793 2013 16301
1994 2814 2004 8763 2014 17099
1995 2646 2005 9283 2015 17135
1996 2578 2006 9.932 2016 17180
1997 5955 2007 11108 2017 17833
1998 6209 2008 11704 - -
1999 6610 2009 11996 - -
Source: Statistical Yearbook of Romania 1991-2018
And the number of pharmacists increased: if in the year 1990 there were 6286 pharmacists, in 2012 their number reached 15435 (increase of 2.45 times), and in 2017 to 17833 (increase of 2.84 times). This is also the consequence of the establishment of Pharmacy Faculties in different cities of the country after 1990. It is observed from the table a decrease in the number of pharmacists after 1992 due to pensioners in the system and also an increase in their number after 1996.
In the following Table we calculated the
Pharmacy/Population ratio in the period 1990-2017:
Table 3. Pharmacy/Population ratio in the period 1990-2017.
Year Pharmacy/Population Year Pharmacy/Population Year Pharmacy/Population
1990 11913 2000 5258 2010 3205
1991 13021 2001 5250 2011 3062
1992 18588 2002 5086 2012 2781
1993 7441 2003 4908 2013 2643
1994 7507 2004 4542 2014 2544
1995 6807 2005 4264 2015 2555
1996 6275 2006 4037 2016 2525
1997 6001 2007 3649 2017 2465
1998 5669 2008 3510 - -
1999 5542 2009 3302 - -
Source: Statistical Yearbook of Romania 1991-2018
If in the year 1990 a pharmacy returned to 11913 inhabitants, in 2012 their number decreased to 2781 inhabitants, and in 2017 to 2465 inhabitants.
In Table 4 I calculated the Pharmacist/Population ratio in the period 1990-present.
Table 4. Pharmacist/Population ratio in the period 1990-present.
Year Pharmacist/Population Year Pharmacist/Population Year Pharmacist/Population
1990 3692 2000 3121 2010 1573
1991 4480 2001 3070 2011 1465
1992 5970 2002 2974 2012 1302
1993 8156 2003 2789 2013 1226
1994 8078 2004 2473 2014 1164
1995 8572 2005 2329 2015 1157
1996 8769 2006 2173 2016 1147
1997 3786 2007 1939 2017 1098
1998 3624 2008 1837 - -
1999 3398 2009 1790 - -
Regarding the Pharmacist/Population ratio it decreased from 3692 to 1990 to 1302 in 2012 and 1098 in 2017.
Pharmacy Faculties constitute the primary source of scientific and professional knowledge of the pharmacist, the skills necessary to practice, values, attitudes and behaviours, related to the social and cultural norms required of the profession. These educational institutions are the major source of specialised workforce and as such they play a
critical role in determining the quality and quantity of the profession members [4].
It is therefore compulsory to have a good correlation between the needs of the society on pharmaceutical knowledge, the aspirations of the profession in general, the possibilities of Pharmacy Facultaties and the number of pharmacists.
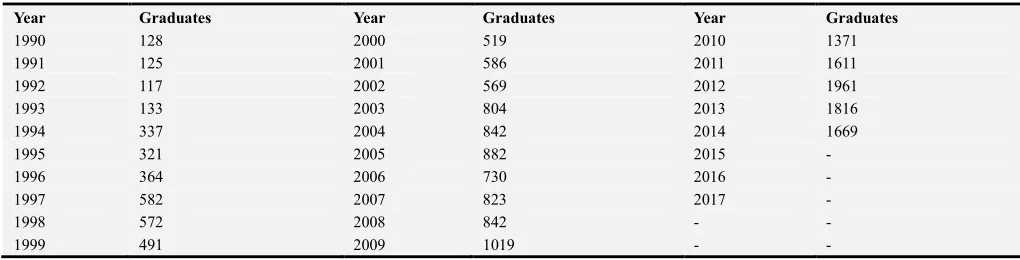
Table 5. Number of pharmacy graduates in the period 1990-2014.
Year Graduates Year Graduates Year Graduates
1990 128 2000 519 2010 1371
1991 125 2001 586 2011 1611
1992 117 2002 569 2012 1961
1993 133 2003 804 2013 1816
1994 337 2004 842 2014 1669
1995 321 2005 882 2015 -
1996 364 2006 730 2016 -
1997 582 2007 823 2017 -
1998 572 2008 842 - -
1999 491 2009 1019 - -
Source Statistical Yearbook of Romania 1991-2015
Indication: The number of pharmacy graduates appears in the yearbook until the Yearbook of 2014, after this year appears cumulated-Health and social assistance
In the table we can see that the number of graduates of Pharmacy Faculties from 1990 to 2012 increased 13 times, after which followed a decrease in the number of pharmacy graduates in 2013 and 2014.
And Legislation in the pharmaceutical field has undergone several modifications.
In summary: If from 1990 to 1998 pharmacy owner was the pharmacist, from 1998 to today pharmacy owner can be anyone, hiring a chief pharmacist; on the demographic criterion, from 1991 to 1999, a pharmacy could be established at 7000 inhabitants, from 1999 to 2004 a pharmacy to 5000 inhabitants, from 2004 to 2009 a pharmacy to 3000 inhabitants in Bucharest, a pharmacy to 3500 inhabitants in the cities of county residence, a pharmacy at 4000 inhabitants in other cities. The rural environment being disadvantaged, local distribution oficins could be established where there are no pharmacies, including in the villages of cities; if by 1994 the geographical criterion was not specified in the rules, from 1994 to 1999 a pharmacy could be established at 500 m from another pharmacy, and from 1999 to 2001 a pharmacy at 250 m from another pharmacy. From 2001 the geographical criterion is eliminated [5-9].
It should be said that in most European countries pharmacies operate according to the ethical model.
The health policy in Romania is reflected in the Law No. 95 of 2006 on Health Reform, as amended. By its magnitude, the law is a real public health code where pharmaceutical
assistance is naturally addressed. The law harmonises many aspects of the health system with existing European legislation and is in a continuous update, interventions and amendments to the content over the years being countless.
Pharmacy Law No. 266 of 2008, in its original form, contained contradictory and inapplicable provisions. It was found that the institutions and professional associations involved in the process of authorisation, endorsement, inspection, control and sanctioning of pharmaceutical units belonged to different administrative areas and lacked competence and capacity administrative burden to carry out the activities assigned to them by the law of pharmacy or are in conflict of interest [10].
Law No. 236 of 2009 is the Legislative Act amending and supplementing Law No. 266 of 2008 known as the Law 266 republish [11].
Law No. 46 of 2003 on the rights of the patient comprising the component elements of the realization of this projection, the foundation necessary for the elaboration of health legislation. The law states that "patients are entitled to the highest quality medical care that the company has, in accordance with human, financial and material resources" (article 2) [12]. For the pharmaceutical sector this means a high training of specialist staff, adequate patient counselling, flawless services in an appropriate ambient environment [13-15].
Figure 1. Evolution of the Pharmacy/Population and Pharmacist/Population ratio in the period 1990-2017.
In accordance with the legislation in continuous change (not necessarily for the better!), we observe from the graphic an increase in the Pharmacy/Population ratio after 1999 immediately, after which a steep decrease in 1993, then this indicator continues to decline.
And the Pharmacist/Population ratio has undergone changes over time, initially there was an increase after 1990, then a decrease in 1997 (due to the establishment of
Pharmacy Faculties after 1990, migration of the population), then follows its allure as in the case of the Pharmacy/ Population ratio.
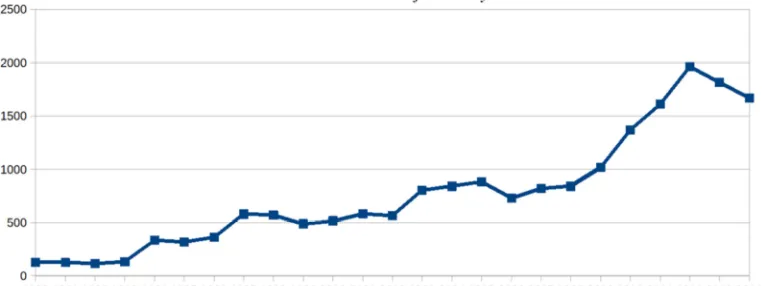
In Figure 2 I present the evolution of the number of Pharmacy Graduates, as observed in the two figures the increase in the number of Pharmacy Graduates after 1997 resulted in the decrease of the Pharmacist/Population ratio while decreasing the population [3].
Figure 2. Evolution of the number of Pharmacy Graduates during the period 1990-2014.
5. Conclusions
With regard to the main synthetic pharmaceutical indicators we see profound changes, even if they have occurred amid a decrease in the number of inhabitants: if in 1990 a pharmacy returned to 11913 inhabitants, in 2017 it reaches 2465 inhabitants. The Pharmacist/Population report dropped from from 3692 to 1990 to 1098 in 2017.
Pharmaceutical regulations during the period analysed were numerous. There were many Orders of the Minister who changed the conditions of organization and functioning of pharmaceutical units, and a Law of Pharmacy was adopted only in 2008 with numerous amendments from the
occurrence to date.
We have noticed over the years the increase in the number of Phamacies, Pharmacists, Pharmacy Graduates and we ask ourselves whether this growth has also led to increased pharmaceutical act over time.
References
[1] Toma Elena-Cristina, Ana Carată, Priority objectives in the field of population’s support with medicines. Note I. Study of pharmacists’ opinions, Farmacia, 2014, Vol. 62, 4, p. 803-810.
[3] Romanian Statistical Yearbooks, Editions 1991-2018 ։ Pharmacies, Pharmacists, Pharmacy graduates, Population.
[4] Vasev N., Vrangbæk K., Transposition and national level resources – Introducing the Cross Border Health Care Directive in Eastern Europe. West European Politics, 2014; 37 (4): 693-710. 33.
[5] Order of the Minister of Health No. 2234 of 1994, on the modification and completion of the Order of the Minister for Health No 141/1992 for Approving the Rules on the Issuance of Authorization to operate the Pharmaceutical Units, as well as the regulation on the organisation and operation of these units, Official Gazette No. 44 of 08 March 1995, Annexes 1-5.
[6] Order of Health Minister No. 201 of 1999, on the modification and completion of the Order of the Minister for Health No 2234/1994 for the Approval of the Rules on the Authorization to operate the Pharmaceutical Units, as well as the technical rules on the functioning of Pharmacies, Pharmaceutical deposits and Drugstores, Official Gazette, part I, No. 278 of 17 June 1999, Annexes 1-2.
[7] Order of the Minister of Health and Family No. 626 of 2001, on the modification and completion of the Order of the Minister for Health No 201/1999 for Approval of the Rules on the Establishment and Authorization of Pharmaceutical Units and the Conditions of their Organisation and Operation, Official Gazette No. 629 of 08 October 2001, Annexes 1-2.
[8] Order of Health Minister No. 1199 of 2004, on the modification and completion of the Order of the Minister for
Health and Family No. 626 of 2001 for the Approval of the Rules on the Establishment and Authorisation of Pharmaceutical Establishments and the Conditions of Organisation and Operation, Official Gazette, part I, No. 904 of 05 October 2004, Annex 2.
[9] Order of Health Minister no 962 of 29 July 2009 published in the Official Gazette Nr. 538 of 3 August 2009 with subsequent modifications and additions and repealing any otherwise.
[10] Law No. 266 of 2008 of the Pharmacy, Official Gazette, part I, no. 765 of 13 November 2008, Chapter II, Community Pharmacy.
[11] Law No. 266 of 2008 of the Pharmacy, Reprocessed in the Official Gazette, part I, no 448 of 30 June 2009, Chapter II Community Pharmacy.
[12] Law No. 46 of 21 January 2003 on Patients ' Rights, Official Gazette No. 51 of 29 January 2003, art. 2.
[13] De Oliveira LTDDG, da Silva CP, Guedes MD, de Oliveira Sousa ACD, The good pharmacy practice on Einstein Program at Paraisopolis Community. Einstein-Sao Paolo, 2016; 14 (3): 415-419.
[14] Minarikova D, Malovecka I, Foltan V, Patient choice of pharmacy and satisfaction with pharmaceutical care – Slovak regional comparison. Farmacia, 2016; 64 (3): 473-480.