INFLUENCE
OF SILICON
ON GROWTH
AND SALT UPTAKE
IN WHEAT
UNDER
SALINITY
HETAL B. TRIVEDI, T.V. RAMANA RAO, D.L. BAGDI AND G. GURURAJA RAO*
Department ofBiosciences, Sardar Patel University, Vallabh Vidyanagar 388 120, Gujarat. *Central Soil Salinity Research Institute, Regional Research Station, Bharuch 392 012, Gujarat.
Recieved on 14 Aug., 2003, Revised on 6 Nov., 2004
SUMMARY
The effect of silicon on growth and physiological process was studied in wheat seedlings grown under NaCl
salinity. Salinity stress decreased the root and shoot length, chlorophyll content, leaf tissue tolerance, total
sugars, starch and potassium, while sodium content was found to be higher in wheat seedlings grown in
half-strength Hoagland nutrient medium. The magnitude of decrease was less in tolerant cultivar GW -1 compared
to KRL 1-4. Conversely, addition of silicon to the nutrient medium reversed the salt inhibited growth mainly
by reducing the sodium uptake into the shoot. It enabled the plant to restore chlorophyll content and the
concomitant increase in sugar and starch levels. Silicon also enhanced the leaf tissue tolerance to sodium.
Relevance of these changes in relation to salt tolerance is discussed.
Key words: NaCI salinity, silicon, salt uptake, tissue tolerance, wheat
INTRODUCTION
Bread wheat (Triticum aestivum L.) is one of the
most important cereal crops grown extensively throughout the world. It is an important staple food for more than one-third of the human population in India (Anonymous 1998). Among the wheat growing countries ofthe world, India ranks second both in area and production. It is an important crop of the Rabi season, particularly in Western and North western parts ofIndia, where soil salinity is a major constraint in crop production. Reclamation of salt affected lands by leaching and drainage are expensive and at times not feasible for want of large quantities of good quality water. A possible approach to increase the
productivity of wheat is to improve salt tolerance of
plants. Silicon has been used effectively to increase the
tolerance of plants against biotic and abiotic stress
conditions (Epstein 1994, Marschner 1995). The soil
contains silicon mainly as silicic acid that ranges from 0.1-0.6 mM (Epstein 1994). Silicon has been found to minimize
* Corresponding author
360
the salinity effects and transpiration rate in plants (Tisdale
et al. 1993, Epstein 1994, Marschner 1995), Na+ uptake
in rice under salinity (Yeo et al. 1998, Gururaja Rao
2001). It protects leaves from UV radiation damage by filtering the harmful UV rays (Tisdale et al. 1993) and increases the leaf erectness and seed yield in paddy (Yoshida et al. 1969). Silicate supplementation has been found to increase the stomatal conductance of salt treated
plants, photosynthesis and reduce the sodium uptake by
the partial blockage of the transpirational bypass flow, the pathway by which large portion of the uptake of sodium
occurs in rice (Yeo et al. 1998, Gururaja Rao 2001).
Keeping in view the use of silicon based fertilizers as an
important management strategy to mitigate the stress
effects, the present study has been made to understand the effect of silicon on growth and certain physiological processes, viz. ion uptake, tissue tolerance, chlorophyll content, photosynthetic assimilation and carbohydrates in wheat seedlings grown under NaCl salinity.
INFLUENCE OF SILICON UNDER SALINITY IN WHEAT
MATERIALS AND METHODS
The experiment was conducted during 2002-2003 in the polyhouse of the Department of Biosciences, Sardar Patel University, Vallabh Vidyanagar, Anand (Gujurat). Viable seeds of wheat (cvs. GW-l (tolerant) and KRL
1-4 (moderately sensitive) were surface sterilized with
0.1 % HgC12 for 2-3 min and washed repeatedly with
distilled water. The seeds were allowed to germinate in plastic trays lined with moistened filter paper and to grow
in dark for 7 days. On 7th day, healthy and uniform
seedlings were transplanted in to plastic boxes of 2 litre capacity containing half strength Hoagland solution, the composition of which is given in Table 1. Four sets of boxes were maintained with eight seedlings per box. The
seedlings were subjected to the treatments, viz.
Tl-Hoagland solution (nutrient medium); T2-Hoagland
solution +50mM NaCl; T3-Hoagland solution +50mM
NaCl +2mM Si; and T4 - Hoagland solution +50 mM
NaCl +mM Si given seven days after transferring to the boxes.
NaCl solution was added to the nutrient medium
raising the final concentration to 50 mM. The silicon
treatment was given by adding sodium silicate (25.5
-28.5%, SiO) solution to the growth medium to produce a final concentration of2 mM and 4 mM, slightly in excess of the solubility of silicic acid in water. The plants were harvested 7 and 14 days after the treatments for various
Table 1. Composition of Hoagland culture solution*
analyses. The conditions in the polyhouse were l2h
photoperiod with 20-25 °C as day temperature. The dark period had 18°C temperature.
Shoot and root lenghts of seedlings were measured
on 7 and 14 days after the treatment. Plant samples
were harvested, oven-dried at 70°C and extracted in
100 mol m-3acetic acid at 90°C for 2 h in hot water bath and sodium and potassium contents were measured Flame
Photometrically. Chlorophyll content of the leaves was
determined according to Amon (1949). For Chlorophyll
and sodium estimations, fresh leaves were collected,
sliced and chlorophyll was extracted in 80% ethanol in a boiling hot water bath for 20 min. Glacial acetic acid
was added to the tubes (with chlorophyll extract and
sliced leaf samples) raising the final concentration to 100 mol m,3 and boiled for 2 h, cooled and sodium
determined. The leaf tissues were dried and alcohol
insoluble dry weight determined which forms the basis
for expressing the sodium and chlorophyll contents.
Correlations were worked out between leaf Naf and
chlorophyll and LDso was determined by calculating the mean sodium concentration of individual leaves at which
the chlorophyll is reduced by 50 per cent compared to
that of control plants. Total sugars were estimated in
leaf dry powder according to Highkin and Frankel (1962) and starch was estimated by the method of (Mc Cready
et al. 1950). Three replications were maintained for
each treatment.
Salts
KNo]
Ca (N0J)2
NH4Hl04
MgS04·7Hp
Concentration (gl'l)
1.02
0.492
0.23
0.49
Salts
HJBO]
MnCI2.4Hp
CuS04·5Hp
ZnS04·7H20
H2Mo4·H
P
FeS04·7Hp(0.5%)
Tartaric acid (0.4%)
Concentration (mg 1'1)
2.86
1.81
0.08
0.22
0.09
0.6mll'l
(3x weekly)
*Source: Hoagland and Amon (1950)
Fig 1. Changes in shoot sodium in wheat cultivars as influenced by silicon under NaCI salinity (DAT: Days after treatment)
1-4, whereas the reduction ranged from 31-35% in GW-1 under T4. Silicon supplementation to the culture medium was found to alleviate the salinity effects by minimizing the uptake of sodium thereby augmenting the growth of the plants. Salt damage in wheat seedlings is caused due
to the excessive transport of sodium, which caused
damage to the leaves by pigment derangements. The
data given in Fig. 2 indicate that potassium was found to
T4 T3
tI: 7 OAT;.D: 14 OAT
KRt. 1-4
o
1200 1200
GW-l
900
"i
."
'b,
"0 600
E a E
::l )GO
'is
0
Ul
0
n T2
Growth parameters i.e., shoot and root length on 7
and 14 days of treatment are given in Table 2. The data suggest that shoot length was more in control plants (Tl) at 2nd sampling stage. Salinity induction showed slight
reduction in shoot length, but significant differences were noticed between the salinized plants (T2) and 4 mM silicon treated plants in KRL 1-4 at second sampling stage. In contrast to the shoot length, the root length was found to increase in KRL 1-4 when compared to that of GW -1 under salinity. Silicon treated plants were also found to produce higher root volume (number of roots), root biomass than the salinized plants, which facilitate uptake of water and nutrients from the medium resulting in better growth of plants (unpublished).
The data (Fig. 1) suggest that the shoot sodium content of both the cultivars was significantly less in T1, while KRL 1-4 showing more Na than GW-1 under T3 and T4. Sodium silicate added to the culture medium lowered the shoot sodium when compared to that of salinized plants (T2) indicating silicon has reduced the sodium transport into the shoot. Sodium, however, was found very high under salinity in both the cultivars on both the days of sampling (7 and 14 days). Of the two cultivars, GW-1 showed higher shoot sodium when compared to KRL
1-4, indicating higher salt uptake. Addition of silicon
(2 mM) reduced shoot sodium content by 24% in GW-1 while in KRL 1-4, the reduction occurred to a tune of 27%.2 mM silicon (T3) significantly reduced the uptake of sodium in that KRL 1-4 showed more reduction. A reduction of 41 % in sodium uptake was noticed in KRL
RESULTS AND DISCUSSION
Table 2. Root and shoot length of wheat cultivars as influenced by silicon under salinity
Treatments Root Length (em) Shoot length (em)
GW 1 KRL 1-4 GW 1 KRL 1-4
SI S2 SI S2 SI S2 SI S2
Control (Tl) 7.69 8.54 10.12 9.88 23.16 24.93 21.34 23.47
50 mM NaCl (T2) 8.53 9.15 12.32 12.29 20.43 21.43 20.01 20.32
50 mM NaCl+2mM Si (T3) 7.23 8.03 10.86 11.86 21.86 22.40 20.19 21.87
50 mM NaCl+4mM Si (T4) 7.31 8.26 8.21 7.93 21.20 22.56 19.02 22.32
C.D·o.os 0.98 NS NS NS NS NS NS 1.57
SI and S2 represent, 7 and 14 days after the treatment, respectively NS: Non-significant.
INFLUENCE OF SILICON UNDER SALINITY IN WHEAT
Treatments
tf. 1 OAT;a: 14 OAT
'i
'C 20
bl
Cl .§.
:c 15
>.
c.
e
~ 10 o
2S GW-1 0: Chl.a;B: Chl.b; _: ChI. a+b
5
o
T4 T3
12 10
"i' 8 "
'"
'0 6
~
E
"
'iii 4
<II
.•
15
0..
2
0
T1
Fig 2. Changes in shoot potassium in wheat cultivars as influenced by silicon under NaCI salinity (DAT: Days after treatment)
T4 T3
T2
11
5
bl
Cl 15 .§.
>.
-a
10 o l5 :co
Tre.tments
Fig3. Changes in shoot chlorophyll in wheat cultivars as influenced by silicon under NaCI salinity (14 Days after treatment)
25
KRt 1-4 0: Chl.a;0: Chl.b; _: ChI. a+b 20
'i
'C
T4 0: 1 OAT;0: 14 OAT
T3 Tr •• tments 10
KRt 1-4
"i' 8
"
'"
'0~ I
E
"
'iii
<II 4
.•
15
0..
2
0
T1 12
be more in controls of both the cultivars. Salinization (T2) had reduced the potassium content drastically by 65% over Tl in GW-l. Silicon, however, enhanced shoot K+ content of the salinized plants. 2 mM silicon treated plants showed more K+ content when compared to 4 mM silicon in GW-1, showing 41% and 38%, respectively, over the salinized ones. In KRL 1-4, the decrease in K+ was much more severe under salinity when compared to
GW -1. Silicon supplementation, however enhanced the
Kr levels in the shoot.
The total chlorophyll content was found to be higher in controls (Tl) in both the cultivars (Fig. 3). Chlorophyll content was reduced drastically under salinity in both the cultivars, the reduction being more in KRL 1-4. Silicon supplementation, however, did not show much variation in chlorophyll content. The chlorophyll content of both
the cultivars was significantly high in salinized plants
supplemented with silicon than the salinized ones. The
decrease in chlorophyll content could be due to the
salinity induced weakening of pigment-protein-lipid
complex (Strogonov 1964). High sodium concentration in
the leaves reduced the chlorophyll content, which is
evident from the combined chlorophyll and sodium
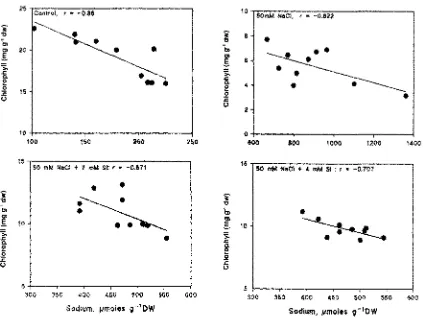
estimations (tissue tolerance). It is evident from the
scattered diagrams (Fig. 4a and 4b) that as the sodium
concentration increased chlorophyll concentration
decreased in both the cultivars. An inverse relationship between sodium and chlorophyll content was noticed in both the cultivars. The relationship was more prominent
in KRL 1-4 when compared to GW -1. The LD50value for
sodium is defined as the mean sodium concentration of individual leaves at whieh chlorophyll is reduced by 50 per cent compared to that of control plants (Tl). The
25
j'
"C
b>
C) 20
.§.
10 50mMNIlCI, r. -0.1l22
•
•
10
100 150 200 250
o
600 800 1000 1200 1400
15
'-y---,
50 mM N.CI •. 2 mM $1: r • -0,&11
•
HI SO mM NIlCI •. .( mM$i :r • -0.107
j'
"C
b>
C)
.§. 10
>.
..c:
Co
e
0
:;:
(.)
•
:~.
.~
•
j'
"C
b>
C)
.§. 10
>.
..c:
Co
e
0
:;:
(.)
•
~
5+---r----,---r----,..----.---l
300 350 400 450 500 550 600
Sodium. iJmoles ,,-lOW
5+---,..---,--.,.--...,....---.,---1
300 350 400 450 500 550 $00
Sodium, jJmoles ,,-lOW
Fig 4. Relation between sodium and chlorophyll in wheat cultivar GW-l as influenced by sodium under salinity
LD50value for GW -1 was about 450 llmoles whereas for KRL 1-4 it was about 43511moles of sodium.
The representative scatter diagrams (Figs. 4 and 5) and the high degree of scatter could be due to variations in the ability of the leaves to store the sodium ions. A fitted linear regression accounts for 47% variability in GW-l and 73% variability in KRL 1-4, indicating the sensitive nature ofthe latter cultivar. Ahmed et al.(1992) working with wheat reported a possible interaction between sodium and silicon ion forming a complex, thus reducing the uptake. This was evidenced by low silicon levels in the leaves under salinity when compared to high silicon levels
under normal conditions. Silicon, like lignin plays an
important role as a structural component of the cell walls (Epstein 1994) deposition in the cell walls could account for reduction in apoplastic transport of sodium. Formation of hydrophilic gel with sodium could also block leakage pathways in the apoplast. As a structural element, silicon
is found mostly in the shoot and predominantly in the
364
terminus in the transpirational pathway. However, silicon has been found in the endoderm is of the roots of some
species where it is confined principally to the inner
tangential wall (Yeo and Flowers 1984).
Silicon, while reducing the Nat uptake, lowered the reduction of chloropyll. This would have facilitated the plants in higher photosynthetic carbon fixation and better growth. The total sugar and starch contents indicated that silicon treatment enhanced the sugar content over salinized plants in both the cultivars. KRL 1-4 had higher sugars than GW-1 (Fig. 6). Salinized plants of both the cultivars showed about 29% decrease in sugar content over controls (Tl). While 4 mM silicon (T4) showed about] 0% increase in sugars in GW-l, the cultivar KRL 1-4 showed about 26% increase in sugar content. Contrary to the sugars, the starch content in KRL 1-4 was found to be less when compared to GW -1 in all the treatments. Addition of silicon had increased the starch content of the salinized plants (Fig. 6). The increase in chlorophyll, higher tissue
INFLUENCE OF SILICON UNDER SALINITY IN WHEAT
2SCentrel. r" ~o.n 10 SOmlll "'eCI, r" -0.a6 'i
't:l
b> Cl 20
.s
>.
..c:
a. 2 0
15
:c
u
'i 8
't:l
b> Cl
.s
8>. ..c:
g- 4
5 :c
u
•
•
10 100 15
150 200 o800 800 1000 1200 1400
50 IllM HeCI .•. 2 mill $1: r •• -0.94 lllM HeCI .•. 4 /liM $1 : r •• -0.89
'i
't:l
~b> Cl
.s
10 >. ..c:a. o 5 :c
u
'i
't:l 14
b> Cl
.s
>...c:
g- 10
5 :c
u
•
5
300 400 500
Sodium, ",mole. g-10W
600
&
300 350 400 450 500
Sodium, ",mole. 9-10W
SSO
Fig 5. Relation between sodium and chlorophyll in wheat cultivar KRL 1-4 as influenced by sodium under salinity
Fig. 6. Changes in carbohydrates in wheat cultivars as influenced by silicon under Nli.CI salinity (14 Days after treatment)
tolerance, starch and sugars due to silicon application in
salinized plants were associated with better plant
establishement. Earlier reports in rice indicated that salt sensitive cultivar like GR 4 responded well to silicon application and showed performance at par with the tolerant cultivar, CSR 10. (Gururaja Rao 2001). This is clearly evident in the present study where in KRL 1-4 where in the reduction in sodium uptake is coupled with higher potassium, sugars suggesting the positive and beneficial effects of silicon under salinity. Higher potassium might favour stomatal opening and possible hormone synthesis.
The above studies indicated that the silicon application lowered the sodium transport into the shoots resulted in higher chlorophyll (by minimizing sodium toxicity) and
tissue tolerance that in tum helpful in carbohydrate
synthesis. Of both the cultivars examined under the present study, KRL 1-4, a moderately sensitive variety, responded to silicon better than GW -1 under salinity.
Indian J Plant Physiol., Vol. 9, No.4, (N.S.) pp. 360-366 (Oct.-Dec., 2004)
3S
'i 30 "
't:l n
b> Cl .<>
.s
15l!!
'" 10
Cl ::l VI
<> n
4$
'i 40
't:l
$5 b> 30 Cl
.s
2.'5l!! 2Q
'"
••
Cl ::l VI 10
"
'1"1~ GW-I; Ill: KRt 1-4
0: GW--l; 0: KRl 1"4
12
Treatments:
REFERENCES Marschner, H. (1995). Mineral Nutrition of Higher Plants. Academic Press, London.
Ahmad, R., Zaheer, S.H. and Ismail, S. (1992). Role of silicon in salt tolerance of wheat (Triticum aestivumL.). Plant Sci.
85:43-50.
Anonymous (1998). 37thAll India Wheat Workers' Meeting of All India Coordinated Wheat Improvement Project, Directorate of Wheat Research, Kamal, India.
Amon, D.l. (1949). Copper enzymes in isolated chloroplasts: polyphenoloxidase in Beta vulgaris. Plant Physiol. 24:
1-5.
Epstein, E. (1994). The anomaly of silicon in plant biology. Proc. Nat. A cad. Sci., (U.S.A.) 91:11-17.
Gururaja, Rao (2001). Studies on salt tolerance in rice: Role of silicon. J. Plant BioI. 27:57-60.
Highkin, H.R. and Frankel, F. (1962). Studiesongrowthandmetabolism of barley mutant lacking chlorophll b.Plant Physiol.
37:314-320.
Hoagland, D.R and Amon, D.l. (1950). The water culture method for growing plants without soil. Calif. Agr. Stat., Exp., Circular No. 47. University of California, Berkely.
366
McCready,RM., Guggole,J., Silviera, V. and Owens, H.S. (1950). Determination of starch and amylase in vegetables: Application to peas. Anal. Chern.29: 1156-1158.
Strogonov, B.P. (1964). Physiological Basis of Salt Tolerance of Plants. Israel. Progr. Sci., Transl., Jerusalem.
Tisdale, S.L., Nelson, W.J., Beaton, J.D. (1993). Soil Fertility and Fertilizers. McMillan Publishing Company, New York.
Yeo, AR. and Flowers, T.J. (1984). Non-osmotic effects of polyethylene glycollilponsodium transport and sodium-potassium selectivity by rice roots. Plant Physiol. 75: 298-303.
Yeo, AR., Flowers, S.A, Rao, G.G., Welfare, K., Senanayake, N. and Flowers, T.J. (1999). Siliconreduces sodium uptake in rice in saline conditions and this is accounted for by a reduction in the transpirational bypass flow. Plant Cell Environ. 22:559-565.
Yoshida, S.,Navsera, S.A andRamirez,E.A (1969). Effects of silica and nitrogen supply on some leaf characters of rice plant.Plant Soil.31:48-56.