The Role Of Contested And Uncontested
Passes In Evaluating Defensive
Basketball Efficiency
James T. Bartholomew, Florida Gulf Coast University, USADavid. A. Collier, Florida Gulf Coast University, USA
ABSTRACT
The global economic impact of basketball is measured in tens of billions of dollars and requires the efficient use of resources to maximize success on and off the court. Today, coaches, players, investors, and owners need to take full advantage of modern analytical methods and digital video software capabilities to make the most efficient use of a team’s resources. This research is the first in a series that makes full use of modern analytic methods and begins to define new defensive and offensive criteria to supplement the decades old game box score performance information. Data envelopment analysis and statistical methods are used to evaluate two new defensive performance metrics on defensive efficiency. The two new defensive metrics are contested and uncontested passes that are fully defined in the article’s appendix. Future research will expand the sample size and allow for more comprehensive models of basketball team defensive efficiency.
Keywords: Sports Analytics; Statistics; Data Envelopment Analysis; New Basketball Defensive Performance Metrics; Benchmarking
INTRODUCTION
he economic impact of Division I NCAA basketball exceeds $14 billion in the United States. During the 2009-2010 season the NCAA signed a 14 year $10.8 billion dollar contract with CBS television to cover the NCAA tournament through 2024. In addition, more than $3 billion changed hands with gamblers during the 2010 NCAA tournament alone. On the women’s side, Brown and Jewell (2006), for example, determined the marginal revenue product of a college basketball player.
In terms of operating budgets, Duke University led the nation by spending $13.87 million for its six-coach and 13-player men’s roster in 2008-09. Louisville led the nation in basketball-generated revenues with $25.5 million. Of the top 12 highest spending men’s teams from the 2009-2010 season, 10 have been to the final four at least once since 2003.
Similar economic statistics document the importance of the National Football League (NFL), National Basketball Association (NBA), Major League Baseball (MLB), NASCAR, and the National Hockey League (NHL). The USA is a ―sports nation‖ and global events like the Olympics and World Cup Soccer demand that we analyze the performance of these sports organizations as rigorously as world-class corporations analyze their goods, services, processes, people, and supply chains.
Despite huge television contracts, sizable operating budgets, large payrolls, and expansive gambling economies, many coaches, fans, investors, owners, and gamblers use subjective judgments and ―box-score‖ information to measure team and player performance in basketball. Meanwhile, in other sectors of the U.S. economy we see, for example, revenue management systems, which use complex optimization and simulation models to do forecasting, allocation, overbooking, and pricing of perishable assets across many market segments for airlines and hotels (Baker and Collier, 2003, 2005). Enterprise resource planning and customer relationship
management systems collect real-time data about global supply chains, vendors, markets, and customers and use advanced empirical and optimization methods to manage these systems (Shin, Collier and Wilson, 2000; Wilson and Collier, 2000). To date, basketball stakeholders are just beginning to take full advantage of today’s analytical methods and software capabilities in order to evaluate basketball performance and return on investment.
With so much at stake every year it’s important to have effective means of evaluating basketball performance. The ―box score‖ documents traditional performance metrics such as points, field goal percentage, fouls, blocked shots, assists, steals, turnovers, minutes played, and offensive and defensive rebounds. In addition, shot charts, rebound charts, play-by-play serial data, and motion-capture video and analysis (Bloomberg Business Week, 2011) are used to supplement traditional criteria. The technical capability is currently available to capture any amount of sports performance data you want. Today, the critical question is ―how to analyze these data‖ in order to maximize performance and owner’s returns for minimal cost.
The objective of this research is to examine defensive processes in basketball to see how they impact outcomes using traditional and a few preliminary new metrics. Defensive prowess is an undervalued basketball asset that tends to be highlighted mainly during tournament play. The adage ―defense wins championships‖ can be tested analytically.
LITERATURE REVIEW
Coaches, owners, and players all have the ability to influence the processes inherent in a basketball game. Basketball processes are the controllable behaviors that players and teams practice and choose to execute in a game. They form the identity of a team through offensive plays, defensive schemes, and individual skills that impact winning or losing a game. Business organizations have similar motivations and design controllable goods-producing or service-providing processes to maximize revenue and customer service while minimizing costs (Collier and Evans, 2011-12. If the processes are inefficient, resources are wasted, mistakes are made, and internal and external improvement opportunities are lost. The game of basketball is similar to business processes in terms of allocating resources effectively and achieving desired outcomes. For this research, we divide the literature into the following two categories: (a) data envelopment analysis and (b) statistical methods.
Data Envelopment Analysis
Data envelopment analysis (DEA) can be used to assess the comparative multi-factor efficiency of players and teams, and thereby, provide the first step toward improving the efficiency of coaches, players, and owner’s decisions. Charnes et al. (1978) are credited with pioneering the concept of DEA. Foundation books and articles that encompass DEA methods and assumptions include Charnes et al. (1994), Cooper et al. (2000), Petroni and Bevilacqua (2002), and Thanassoulis, E. (2001). Seiford (1996) presented a comprehensive literature review of theoretical and application-oriented DEA articles and traced the evolution of the field. Popular DEA software programs include BANXIA Frontier Analyst (2010) and PIM DEA Soft-V3 (2010).
The basic idea behind DEA is the ―relative‖ measurement of performance, which is generally defined as the effectiveness of a set of homogenous decision-making units (DMUs) in realizing output(s) created through the utilization of input(s). DEA requires a small number of observations for effective use compared to parametric statistical methods. DEA is also a deterministic numerical method that makes minimal assumptions (Charnes et al., 1978, 1994; Cooper, et al. 2000; Emnouznejad and Witte, 2010; Thanassoulis, 2011).
Statistical Methods
Statistical methods can be used to document value and extrapolate performance levels, behavioral patterns, and the likelihood of outcomes in sports. The strong attachment that coaches, players, and fans have to statistics in sports is well documented, and the usefulness of statistical methods for evaluating performance in sports is evolving. Popular statistical software programs include Minitab (2011) and LISREL (2011).
For example, Gilovich, Vallone, and Tversky (1985) authored one article on the misperception of random sequences in basketball commonly known as streakiness and the hot hand theory. This work investigates the validity of a commonly held belief that making a shot increases the probability of making the next shot. This is referred to as streaky shooting. The study examined the shooting records of the players on the Philadelphia 76ers, the foul-shooting records of the Boston Celtics, and a controlled experiment using basketball players from Cornell. In these cases, no statistically significant evidence was found to demonstrate an improved shooting ability resulting from the successful outcomes of previous shots.
Albert and Williamson (1999) propose a Bayesian method for detecting streakiness in basketball shooting and in hitting a baseball based on simulation. Connolly and Rendlemen Jr. (2006) examined a similar phenomenon in golf by investigating the degree of skill, luck, and streaky play on the PGA tour. Reich, Hodges, and Carlin (2006) proposed a spatial analysis of basketball shot chart data using a Markov chain Monte Carlo methods and hierarchical spatial models. Their goal was to improve the understanding of shot outcomes based on location and other covariates like the personnel on the floor. Kvam and Socol (2006) propose a Logistic Regression/Markov Chain model for predicting Division 1 NCAA Basketball Tournament wins and loses.
DEFENSIVE CRITERIA
The goal of defense in basketball is to frustrate and antagonize the offense in a way that encourages a change of possession and the lowest probability of the defense giving up points. The new defensive performance criteria introduced here are contested and uncontested passes. These new criteria focus on the degree of antagonism by the defense on the offense’s ability to initiate a play or complete a scoring opportunity. The two criteria are defined in Appendix A along with the basketball player’s respective behaviors and actions. These standards guide motion-capture video analysis in counting various performance criteria. A second innovative aspect of this research is we use DEA efficiency scores as the dependent variable in simple regression analysis.
DATA COLLECTION METHODS & SOFTWARE
After the defensive performance criteria were defined, we used digital video recording and specialized software called Gamebreaker (2011) to gathered performance data on a college basketball team from the 2010-2011 season. A total of eight basketball halfs were coded. GameBreaker records this video data as the game progresses on a continuous time frame by player, team, and type of basketball event (i.e., button). For this article, we counted defensive metrics based on the criteria in Appendix A for contested and uncontested passes.
RESULTS
Table 1: Correlations Of Variables
N = 8 CP UCP FTO FG% TOP
Contested Pass (CP) X
Uncontested Pass (UCP) .766 X
Forced Turnover (FTO) -.009 -.140 X
Field Goal % (FG%) -.327 -.269 -.469 X
Total Opponent Points (TOP) -.001 .006 -.636 .712 X
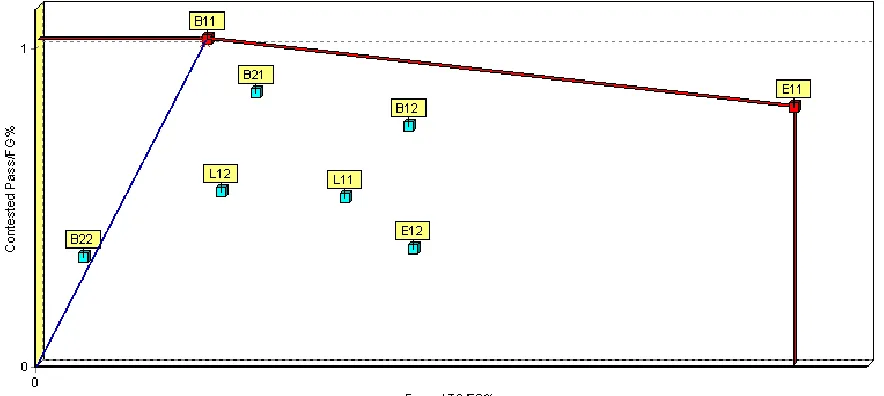
A DMU is defined as one half of a basketball game. Table 2 and Figure 1 summarize the results of the DEA analysis. DEA efficiency is based on two defensive output performance metrics—contested passes and forced turnovers and one input metric field goal percentage. Based on three criteria, CP, FTO, and FG%; the two halfs, B11 and E11, are 100 percent efficient. The DEA efficiency scores range from 100% to 32.94% with the B22 half being this team’s worst half of defensive basketball. Each half of basketball is coded in Table 1 by opponent letter (B, L, or E), the next number is the first or second game, and the last number is the first or second half.
Table 2: Basketball Game DEA Efficiencies
Half CP FTO FG% FTO/FG% CP/FG% DEA Eff%
B11 51 3 50.0 0.060 1.020 100.0
B12 34 6 45.5 0.132 0.747 81.55
B21 33 3 38.7 0.078 0.853 86.18
B22 21 1 62.5 0.016 0.336 32.94
L11 24 5 45.8 0.109 0.524 58.77
L12 25 3 46.2 0.065 0.541 56.17
E11 33 11 40.9 0.269 0.807 100.0
E12 19 7 52.4 0.134 0.363 49.67
Banker, et al. (1989) suggests an approximate rule of thumb regarding an adequate DEA sample size. That is, if p is the number of inputs and q is the number of outputs used in the DEA analysis, then the sample size n
Figure 1 based on the performance data in Table 2 defines the DEA efficiency frontier where B11 and E11 were our ―best practice‖ defensive halfs. B22 and E12 are non-efficient candidates for our worst defensive performance. Non-efficient halfs aspire to improve by reaching the efficiency frontier. We use these DEA efficiency scores as dependent variables later in simple regressions.
Non-linear effects are evident when contested pass (CP) is used in a quadratic regression model with DEA efficiency as the dependent variable as shown in Equation [1]. To save space, we do not show the diminishing returns graph documented by the quadratic equation below.
Quadratic Regression Equation: DEA Eff% Min = -82.1726 + 7.87242*CP - 0.0840036 CP**2 [1]
S = 11.1279 R-Sq = 85.5 % R-Sq(adj) = 79.7 %
Analysis of Variance
Source DF SS MS F P
Regression 2 3657.51 1828.76 14.76 0.008 Error 5 619.15 123.83
Total 7 4276.66
Source DF Seq SS F P
Linear 1 3065.02 15.18 0.008 Quadratic 1 592.49 4.78 0.080
For example, over the relevant range when contested passes increase from 15 to 20, DEA defensive efficiency increases from 17% to 41.7%; yet, when CP increases from 40 to 45, DEA defensive efficiency increases from 98.3% to 100%. We can conclude that emphasizing contested passes is an important component of a defensive strategy and game plan. This preliminary result with a small sample size also indicates that performance relationships in basketball may be non-linear. This finding, if it is confirmed repeatedly by other researchers, indicates that modelers must be careful to check for and model non-linear effects.
Our preliminary results with the new defensive basketball criteria, contested and uncontested passes, found uncontested passes to include too many scenarios. For example, an uncontested pass could be an inbound pass that the defensive player allows, passes around the perimeter of the zone that the defensive player does not want to contest, any pass in the backcourt with no desired defensive pressure or pressing, hand-offs away from the basket and scoring area, backward passes by guards to set up a play, and so on. Therefore, we did not use uncontested passes (UCP) in our analytical models. However, our data analysis confirms strong performance relationships for all of the other variables.
CONCLUSION
Once coaches understand these performance relationships they can better develop their defensive game plan, practice it before the game, and adjust defensive strategies to maximize their team’s effectiveness. DEA is an effective tool for benchmarking performance levels and determining how to improve play. Notice how we used the DEA efficiency scores, as defensive efficiency scores, and then used them in our regression analyses as the dependent variable. One contribution of this research is how we use the DEA results and integrate them into our statistical (regression) models. Another contribution of this research is an attempt to expand the criteria for defensive basketball efficiency using new criterion like contested passes.
AUTHOR INFORMATION
James T. Bartholomew is a fifth year college basketball coach who recently spent two years as Director of Basketball Operations at Florida Gulf Coast University where he also earned his master’s degree in business administration. Prior to that Mr. Bartholomew has worked for Northwood University, the University of the Science, and has been a player on the Washington Generals. E-mail: [email protected]
David A. Collier is the Eminent Scholar, Alico Chair in Operations Management, at the Lutgert College of Business, Florida Gulf Coast University, Fort Myers, Florida. Dr. Collier is the recipient of five awards for outstanding journal articles and he has over eighty refereed publications. He is the author of five books; his latest being OM3 published by Cengage. Professor Collier was an examiner for the Malcolm Baldrige National Quality Award and has been the faculty leader for Six Sigma Black Belt programs. He has worked with many organizations such as Chase Bank, Naples Community Hospital, and Emery Worldwide. E-mail: [email protected]
REFERENCES
1. Al-Shammari, M. (1999), A multi-criteria data envelopment analysis model for measuring the productive efficiency of hospitals, International Journal of Operations and Production Management, 19 (9), pp. 879-890.
2. Albert, J., & Williamson, P. (1999), Using Model/Data Simulations to Detect Streakiness. pp.1-21. 3. Baker, T.K. and Collier, D.A. (2003) The benefit of optimizing prices to manage demand in hotel revenue
management systems, Production and Operations Management, 12 (4), pp. 502-518.
4. Baker, T.K. and Collier, D.A. (2005) The economic payout model for service guarantees, Decision Sciences, 36(2) pp. 197-220.
5. BANIX Frontier Analyst, (2010) Banxia Software, Ltd. (www.banxia.com), United Kingdom. 6. Barros, C. P., & Leach, S. (2006), Performance evaluation of the English Premier Football League with
data envelopment analysis, Applied Economics, p. 1449.
7. Blose, J. E. and Tankersley, W.B. (2004), Linking dimensions of service quality to organizational outcomes, Managing Service Quality, 14 (1), pp. 75-89.
8. Boudway, I., (April 4-10, 2011), Running the numbers, Bloomberg Business Week.
9. Brown, R. W., & Jewell, R. T. (2006), Marginal revenue product of a women's college basketball player,
Industrial Relations, 45 (1), pp. 96-101.
10. Charnes, A., Cooper, W. W., and Rhodes, E. (1978), Measuring the efficiency of decision making units,
European Journal of Operational Research, 2, pp. 429-444.
11. Charnes, A., Cooper, W. W., Lewin, Y. A., and Seiford, M. L. (Eds) (1994), Data Envelopment Analysis: Theory, Methodology and Application, Kluwer Academic Publishers, Norwell, MA.
12. Collier, D.A. and Evans, J. R., OM3, South-Western Cengage Learning, Mason, Ohio, (www.cengage.com).
13. Connolly, R.A. and Rendleman, R.J. Jr., (2008), Skill, Luck, and Streaky Play on the PGA Tour, The Journal of the American Statistical Association, 103 (481), pp. 74-88.
14. Cooper, W. W., Seiford, M. L., and Tone, K. (2000), Data Envelopment Analysis: A Comprehensive Text with Models, Applications, References and DEA-Solver Software, Kluwer Academic Publishers, Norwell, MA.
15. Emrouznejad, A. and Witte, K.D. (2010) COOPER—framework: A unified process for non-parametric projects, European Journal of Operations Research, pp. 1573-1586.
16. Gamebreaker, (2011) Sportstec, (www.sportstec.com).
17. Kvam, P., & Sokol, J. S. (2006, July 14), Logistic Regression/Markov Chain Model for NCAA Basketball. Wiley InterScience (www.interscience.wiley.com).
18. LISREL, (2011) Scientific Software, Inc. Chicagor, IL (www.ssicentral.com).
21. Petroni, A., and Bevilacqua, M. (2002), Identifying manufacturing flexibility best practices in small and medium enterprises, International Journal of Operations and Production Management, 22 (8), pp. 929-947.
22. PIM DEA Soft-V3, (2010) Performance Improvement Management, Ltd. (www.DEAsoftware.co.uk). 23. Reich, B. J., Hodges, J. S., Carlin, B. P., & Reich, A. M. (2006, February), A Spatial Analysis of Basketball
Shot Chart Data, The American Statistician, pp. 3-12.
24. Seiford, L.M. (1996), Data envelopment analysis: The evolution of the state of the art, The Journal of Productivity Analysis, 7, pp. 99-137.
25. Shin, H., Collier, D.A., Wilson, D.D. (2000) Supply Management Orientation and Supplier-Buyer Performance, Journal of Operations Management, 18, pp. 317-333.
26. Soteriou, A. and Zenios, S. A. (1999), Operations, quality, and profitability in the provision of banking services, Management Science, 45 (9), pp. 1221-1238.
27. Thanassoulis, E. (2001), Introduction to the Theory and Application of Data Envelopment Analysis, Kluwer Academic Publishers, Norwell, MA.
28. Wilson, D.D., and Collier, D.A. (Spring 2000) An Empirical Investigation of the Malcolm Baldrige National Quality Award Causal Model, Decision Sciences, 31 (2), pp. 1-30.
APPENDIX A
DEFINITION OF NEW DEFENSIVE CRITERIA and STANDARDS
Traditional defensive criteria are not defined in this appendix to save space and include: defensive rebounds, fouls, forced turnovers, blocked shots, and steals. These definitions and others can be found on the NCAA’s website by downloading the free 2010 & 2011 NCAA Men’s and Women’s Basketball Rules. For more information visit http://www.ncaapublications.com/p-3941-2009-2011-mens-womens-basketball-rules-2-year-publicaton.aspx
A Contested Pass:
Contesting a pass is a controllable defensive process. The defense must demonstrate a willful intent to disrupt the offense. The behaviors that evidence a contested pass are as follows:
1) A defender is close enough (0 – 36 inches torso to torso) to the offensive player to affect his pass and does so by extending his hand (or hands) into the flight path of the ball. The player must also move his body in the direction that the ball is intending to be thrown.
2) A defensive player obstructs an offensive player for more than 0.5 seconds causing the offensive player to hesitate.
3) A defensive player causes an offensive player to stop from making a pass and is forced to make an alternative decision such as a different pass, shot or dribble.
4) A defensive player causes an offensive player to change the direction of an intended pass or causes a delay of more than 0.5 seconds.
5) A defensive player causes an offensive player to throw a pass off target such as behind, in front of, at the feet of, or above the intended receiver.
6) A defensive player causes an offensive player to throw a pass that is deflected by the defender guarding the passer. This hinders the plays momentum of the play.
7) A defensive player causes an offensive player to throw a pass that is stolen by the on-ball defender. 8) A defensive player causes an offensive player to throw a pass that is deflected by a player guarding the
receiver.
9) A defensive player causes an offensive player to throw a pass that is stolen by the defender guarding the receiver.
10) A defensive player causes an offensive player to throw a lob pass to a receiver resulting from the offensive player being off balance, having to pass at a distance greater than 20 feet across the court, or having to jump in the air.
11) A defensive player restricts the movement of the offensive players pivot foot by crowding his space and sealing him in an off-balanced position or stationary position. The defensive player must hold his space or continue to encroach upon the offensive player so that the offensive player cannot ―square-up‖ and face the defensive player without excessive physical contact. (Determined by the Expert Judgment of the video analyst)
Uncontested Pass:
An uncontested pass results from the willful inaction of a defensive player. Not contesting a pass is a controllable process that results from a lack of effort by the on-ball defense. The behaviors that evidence an uncontested pass are as follows:
1) The defender is not within 3 feet of the offensive player when a pass is made 2) The defender does not attempt to reach his hand into the flight path of the ball
3) The defender does not attempt to obstruct the vision of the offensive player or crowd the offensive player by being less than 12 inches away, chest to chest, from the player he is guarding.
4) The defender does not jump for a pass thrown above his head.
6) The defensive player does not make physical chest-to-chest contact with the offensive player after the offensive player has picked up his dribble.
7) The defensive player does not encroach upon the offensive players space when, after the offensive player has picked up his dribble and he pivots backwards.