CROWD BEHAVIOR DETECTION USING OPTICAL
FLOW AND CLUSTERING
Gudibandi Ravi Teja
1, Shreedarshan K
21,2
Dept. of ECE ,MSRIT , Bengaluru, (India)
ABSTRACT
In a visual surveillance, cameras are often used to observe dense crowds. The examination of this data is done manually. Computer vision methods were used to assist observers in detecting crowd behaviors. Method based on optical flow can examine high density crowds with cluttering and occlusion without increasing computing costs. A method is proposed for identifying five behaviors namely bottlenecks, fountainheads, lanes, arches/rings and blocking in visual scenes. Each frame is overlaid by grid of particles and moving particles calculated by optical flow. Behavior classification is provided by the jacobian matrix. The algorithm is repeated over sequential frames of a video in order to record changes the values of jacobian matrix, which may imply changes in behavior. We also compared results with low resolution videos. The method was tested over 20 crowd videos
.
Keywords: Crowd Behavior, Optical Flow, Clustering
I INTRODUCTION
The analysis of crowd is a complex problem and it is very much dependent on the concentration of the observer to camera ratio. Since there is a much data feeds, computer vision methods are being used to assist an observer in doing his or her task. Optical flow is tackling the problem of cluttering, occlusion and computing cost. High object – densities in real world situations make individual object recognition and tracking impractical. Understanding behaviors without knowing the action of individuals is advantageous. With respect to public safety, interesting behavior patterns to detect crowd behavior are blocking, bottleneck, lane, blocking and fountainhead. Bottleneck be caused by doorways exceeding their capacity, blocking by stumbling person and fountainhead by is opposite action to bottleneck. The method proposed by Solmaz et al. is able to detect these behaviors [1] [2]. We proposed a method that combines low-level local features, computed by optical flow. It performs well in various crowd scenes as it does not involve object detection and tracking. It is able to identify multiple behaviors in single scene.
II METHOD BASED ON OPTICAL FLOW
Optical flow is the pattern of apparent motion of objects in a visual scene caused by relative motion between an observer and the scene. The optical flow calculates the motion between two image frames which are taken at time t and t+ Δt at every pixel position. There are different methods exit to compute optical flow, they are 1. Lucas–Kanade method
3. Fleet and Jepson 4. Heeger
Out of these most commonly used methods are Lucas-Kanade and Horn-Schunck. In horn-schunck algorithm is more sensitive to noise. So in this paper we have chosen Lucas-Knade method.
2.1
Clustering
Clustering is grouping set of objects in such a way that objects in the group are more similar than other groups. In this paper we made clusters based on centroid models, example is the k-means algorithm which represents each cluster by a single mean vector. The k-means algorithm is a simple and fast method for partitioning data points into clusters. Here k represents the number of clusters which is to be specified in advance. The clustering is done by using three steps as given in implementation.
2.2
Stability analysis
The critical point is determined by Eigen values of jacobian matrix
J
F. The∆ and
τ
determined in every cluster of a frame. We represent the behavior of each cluster and repeated for entire video scenes. The threshold value is determined empirically.III IMPLEMENTATION
3.1
Lucas-Kanade Method
The Lucas-Knade method is a widely used for computing optical flow. It calculates the flow by using least square criterion. Let us assume two images I(x,y,tₒ) and I(x,y,t1) then the optical flow is apparent motion of each pixel between images taken at different times. The apparent motion is computed by make assumption of brightness constancy i.e. pixel intensity is same for both images. Therefore
I
(x, y, t) =
I
(x+δx, y+δy, t+δt)
(1)
Where δx and δy are the small movement along x and y directions respectively. Assuming movement to be small, the image at I(x,y,t) with Taylors series can develop to get
(2) The higher order terms are removed. Divide the eq.2 by δt throughout the equation, we get
(3)
u and v are horizontal and vertical velocities along x and y directions respectively.
3.2
K-Means Clustering
Let X = {x1, x2 …xn} be a set of points in D dimensional. After set of k centers c1, c2 …. ck in D dimensional, the algorithm partitions these points into clusters as
2. For each i ϵ {1,2, …, k}, set cᵢ be the center of all points in Cᵢ : (3)
3. Repeat steps 1 and 2 until cᵢ and Cᵢ no longer change.
High density peaks are found and marked as accumulation points and trajectories of attributing Particles are clustered and classified as small or big clusters.
3.3
Jacobian Matrix
Jacobian matrix is a matrix of all first order partial derivatives of a vector valued function. Find the jacobian stability in the region of points after clustering, resulting in detection of one of five behaviors.
(4)
The determinant and trace are given by,
∆ = λ1λ2
andτ = λ1+λ2
.Where λ1 and λ2 are Eigen values of JF.∆ < 0
implies w̽ is a saddle, and particle trajectories are pulled toward the point in two directions but pushed away in other direction.∆ = 0
implies at least one Eigen value is zero, and critical points are non-isolated.∆ > 0
implies Eigen values are real with same sign. Ifτ < 0
, then w̽ is stable , acting as a sink for nearby trajectories. Ifτ >0
, then w̽ is unstable.τ=0
is purely imaginary.Now we have to found out the behavior of each cluster from that behavior of entire video based on conditions given in table.1. It depicts the behaviors of crowd by checking the ∆ and τ conditions. The optical flow for entire sequence or frame is denoted by (ū, v̄ ). Using δx and δy to denote difference operators in each spatial direction, we compute the ∆ and τ using
∆ = δxū.δyv̄ ― δyū.δxv̄
(5)
τ = δxū + δyv̄
(6)
3.4
Performance Analysis
Some videos contain multiple behaviors. So in order to identify entire video behavior we proposed performance analysis. The performance analysis (L) is taken as the ratio of number of frames that contain one of five behaviors (B) in a video to number of frames tested in a video (N). Threshold value empirically is 0.5. If two behaviors have threshold value then the video contains two behaviors.
3.5
Comparison between 360p and 144p quality videos
While computing the results we observed that the time taken to obtain results is less when the video quality reduces. So we did compare the performance 360p verses 144p quality video. Unfortunately most of the videos give the performance analysis more than 50%. But few frames in a video we got wrong behavior i.e. for example instead of getting bottleneck we may get any other behavior out of remaining four.
IV FIGURES AND TABLES
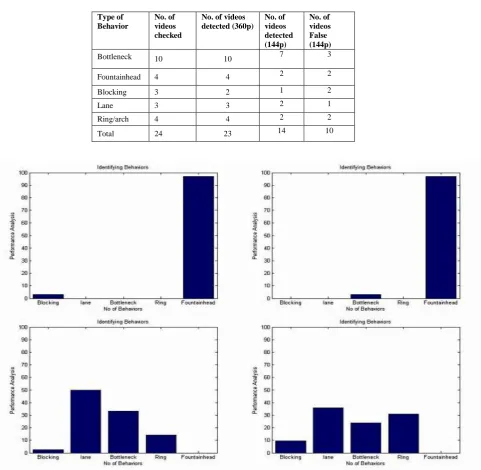
The proposed method was tested on real video sequences downloaded from YouTube, UMN dataset and BBC motion gallery. The frame rate, resolution and duration were different for variety of videos. Performance was tested over 24 videos contains single or multiple behaviors as shown in fig1 and fig2. Behaviors are shown in Bar graphs and tabulated in Table1. We were tested the videos with low resolution (144p) compared behaviors with original video behaviors and results are shown in Table3.
Table I. Conditions for Different Behaviors
Behaviors Conditions
Bottleneck
∆ > 0 ,
τ
< 0
Blocking∆ < 0
Fountainhead∆ > 0,
τ
> 0
Lane
∆ = 0
Arch/ring
∆ > 0,
τ
= 0
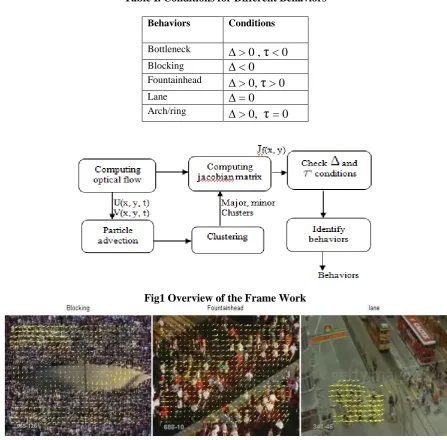
Fig1 Overview of the Frame Work
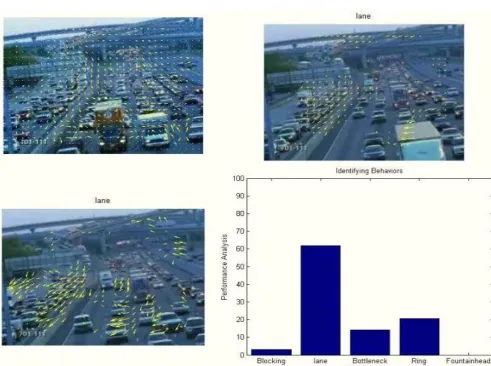
Fig3 Upper left depicts the optical flow of two consecutive frames, upper right and lower left shows the clusters of corresponding frame. Bar graph shows the behavior of video (in above graph it shows Lane).
Table I. Performance Analysis
Type of behavior
Performance analysis
No. of videos checked
No. of videos detected
No. of videos false
Performa nce analysis
above 50%
Bottleneck 10 10 0 10
Fountainhead 4 4 0 4
Blocking 3 3 1 2
Lane 3 3 1 2
Ring/arch 4 4 0 4
TABLE II. Behavior comparison of 360p and 144p quality video
Type of Behavior
No. of videos checked
No. of videos detected (360p)
No. of videos detected (144p)
No. of videos False (144p)
Bottleneck 10 10 7 3
Fountainhead 4 4 2 2
Blocking 3 2 1 2
Lane 3 3 2 1
Ring/arch 4 4 2 2
Total 24 23 14 10
Fig4 Upper left depicts the 360p and upper right depicts 144p bar graph of same video. Lower left depicts the 360p and Lower right depicts 144p bar graph of same video.
IV CONCLUSION AND FUTURE WORK
not useful for abnormal behavior in a crowd i.e. if an object moving in different direction (or) moving fast in a crowd. Social force model by Helbing et al. [11] can be used to calculate the interaction forces between the objects in each frame. Hence existence of abnormal behavior in a frame can be identified.
REFERENCES:-
[1] Berkan Solmaz, Brain E. Moore, And Mubarak Shah., “Identifying Behaviors in crowd scenes using stability analysis for dynamical systems”, IEEE Transaction on Pattern Analysis and Machine Intelligence, 2012.
[2] Sepher Aslani, Homayoun and Mahdavi-Nasab., “Optical flow based moving object detection and tracking for traffic surveillance”, International journal of Electrical, computer, Energetic, Electronic and communication engineering vol:7, No:9, 2013.
[3] Francesco Santoro, Sergio Pedro, Zheng-Hua Tan and Thomas B. Moeslund., “Crowd Analysis By Using Optical Flow And Density Based Clustering”, 18th European Signal Processing Conference,2010.
[4] Jean-Yves Bouguet., “Pyramidal Implementation of the Lucas Kanade Feature Tracker Description of the algorithm”, Intel Corporation Microprocessor Research Labs.
[5] Dhara Patel, Saurabh Upadhyay., “Optical Flow Measurement using Lucas kanade Method”, International Journal of Computer Applications (0975 – 8887) Volume 61– No.10, January 2013.
[6] Constance S. Royden and Michael A. Holloway., “Detecting moving objects in an optic flow field using direction-and speed-tuned operators”, Department of Mathematics and Computer Science, College of the Holy Cross, United States,2014.
[7] Kardi Teknomo,PhD., “K-Means Clustering Tutorial”, Kardi Teknomo – K Mean Clustering Tutorial. [8] Temujin Gautama and Marc M. Van Hulle., ”A Phase-Based Approach to the Estimation of the Optical
Flow Field Using Spatial Filtering”, IEEE TRANSACTIONS ON NEURAL NETWORKS, VOL. 13, NO. 5, SEPTEMBER 2002.
[9] Li Xu, Jiaya Jia and Yasuyuki Matsushita.,“Motion Detail Preserving Optical Flow Estimation”, IEEE Transaction On Pattern Analysis and Machine Intelligence, vol. 34, no. 9, September 2012.
[10] Ramin Mehran, Alexis Oyama and Mubarak Shah., “Abnormal Crowd Behavior Detection using Social Force Model”, 2010