A grochem ophysi a 13, 37-41 (1981)
A COMPARISON OF BUFFER METHODS FOR DETERMINING LIME
REQUIREMENT OF ACID SOILS OF THE HIGHVELD REGION*
P. E. H A U M A N N , Highveld R egion, D ep artm en t o f A griculture and Fisheries, Private Bag X804, P otchefstroom 2520
Ab s t r a c t Key w ords: Soil acidity; lim e req u irem en t; buffer m ethods.
Lime requirem ents o f 90 top- a n d subsoil sam ples o f the H u tto n , A valon a n d Clovelly form s were determ ined using the follow ing buffer m eth o d s: the W o o d ru ff (1948) m eth o d ; the 1961 SM P m ethod (S hoem aker, M cL ean & P ra tt, 1961); tw o m odifications o f the 1961 S M P m eth o d viz., the H ighveld Region S M P m ethod (H V R S M P m eth o d — H a u m a n n & Volschenk, 1979) an d the 1966 S M P m ethod (M cL ean, D u m fo rd & C oronel, 1966); the A dam s & E vans (1962) m eth o d and the 1978 S M P m ethod (M cL ean, E ckert, R eddy & Trierw eiler, 1978) w hich is a newly developed double buffer m eth o d . T h e lime requirem ents o b tain ed by these m ethods were c o m p ared w ith th e lime requirem ent indicated by C a C 0 3 incubation.
A ll the m ethods were highly significantly correlated w ith the incubation m ethod. T he 1966 SM P m ethod gave the highest correlatio n (r= 0 ,9 2 1 9 ) closely follow ed by the H V R S M P m eth o d (r = 0,9 1 8 9 ) and the W o o d ru ff m ethod gave the lowest correlatio n (r= 0 ,7 6 9 0 ).
R egression e q u atio n s a n d g raphs revealed th at the 1978 S M P m ethod gave the m ost accurate direct ap p ro x im atio n o f incu b atio n lime requirem ent o f all the m ethods. T he conclusion, how ever, w as th a t th e 1966 a n d H V R S M P m ethods being twice as rapid as the 1978 S M P m eth o d , w ould be preferable for ro u tin e lab o ra to ry analysis after adjustm ent w ith the ap p ro p ria te regression e q u atio n .
U ittreksel
'N V E R G E L Y K IN G V A N B U F F E R M E T O D E S O M K A L K B E H O E F T E V IR S U U R G R O N D E V A N D IE H O E V E L D S T R E E K T E B E P A A L
K alkbehoeftes van 90 bo- en ondergrondmonsters van die H utton-, Avalon- en Clovellyvorms is m et die volgende bufferm etodes bepaal: die W oodruff (1948)-m etode; die 1961 S M P -m eto d e (Shoe m aker, M cL ea n & Pratt, 1961); twee modifikasies van die 1961 SM P -m eto d e naam /ik die H oeve/d-streek S M P -m eto d e (H V S S M P -m eto d e — H aum ann (6 Volschenk, 1979) en die 1966 SM P -m eto d e (M cL ea n , D u m ford & Coronet, 1966); die A dam s & Evans (1962)-m etode en die 1978 SM P -m eto d e (M cL ean, E ckert, R eddy & Trierweiler, 1978) wat ’n nuutontw ikkelde dubbelbuffer-metode is. Die kalkbehoeftes wat m et hierdie m etodes verkry is, is vergelyk m et die kalkbehoefte wat m et behulp van inkubasie van die gronde m et C aC O3 (A R ) verkry is.
A ! die metodes het hoogs betekenisvo! m et die inkubasiemetode gekorreleer. D ie 1966 S M P -m etode het die hoogste korrelasie (r =0,9219) getoon gevolg deur die H V S S M P -m eto d e (/■ —=0,9189) en die W oodruff-m etode het die laagste korrelasie (/■=0,7690) getoon. Regressievergelykings- en grafieke het getoon dat die 1978 S M P -m eto d e die akkuraatste direkte beraming van inkubasiekalk-behoefte van a! die m etodes gegee het. D aar is egter tot die slotsom g eko m dat aangesien die 1966 en H V S SM P -m eto d es twee m aal vinniger as die 1978 S M P -m eto d e is, hulle voorkeur behoort te geniet vir roetinelaboratoriumontledings nadat hulle kalkbehoeftes m et behulp van die nodige regressiever gelykings aangepas is.
Resum e
U N E C O M P A R A IS O N D E S M E T H O D E S T A M P O N S P O U R L A D E T E R M I N A T I O N D E S N E C E S S I T E S E N C H A U X D E S S O L S A C ID E S D E L A R E G IO N D U H IG H V E L D Les necessites en chaux de 90 echantillons de sot e t sous-sol des fo rm e s H utton, A valon et Clovelly ont e te determ inees en utilisant les m ethodes tampons suivautes: la m ethode W oodruff (1943); la m etliode S M P 1961 (Shoem aker, M cL ea n & P ratt, 1961); deux m odifications de la m ethode S M P 1961 a savoir, la m ethode S M P de !a Region du H ighveld (H V R S M P m ethod— H aum ann & Volschenk, 1979) et la m ethode S M P 1966 (M c L e a n , D um ford (6 Coronel, 1966); ta m ethode A dam s (6 Evans (1962) et la m ethode 1978 (M c L e a n , E ckert, R eddy & Trierweiler, 1978) qui est une m ethode a double tam pon, nouvellement developpee. L e s necessites en chaux obtenues avec ces m ethodes ont e te com-parees avec la necessite de chaux indiquee p ar incubation C aC O s.
Toutes les m ethodes fu re n t hautem ent significatives en correlation avec la methode d ’incubation. L a m ethode S M P 1966 donna la correlation la plus etevee ( r —0,9219) suivie de p res p a r la m ethode H V R S M P (r= 0 ,9 1 8 9 ) et la m ethode W oodruff donna la correlation la p lu s fa ib le (r= 0 ,7 6 9 0 ).
D es equations de regression e t des graphiques revelerent que ta m ethode S M P 1978 donna I'approxi mation directe la plus precise de la necessite de chaux d'incubation, de toutes les m ethodes utilisees. Cependant, la conclusion f u t que les m ethodes H V R S M P et 1966 etant deux fo is aussi rapides que la m ethode S M P 1978, seraient preferables pour les analyses routinieres de laboratoire apres ajustage prealable avec I'equation de regression appropriee.
In t r o d u c t i o n
A study com paring different m ethods for determ in ing lime requirem ent was conducted by H au m an n & Volschenk (1979). It was a prelim inary investigation, however, and was largely confined to soils w ith a lime requirem ent o f less th a n 2 t C a C 0 3 h a-1, indi cating th a t they were n o t strongly acid. It was th ere
* P art of an M Sc. Agric. thesis subm itted by th e a u th o r to the U niversity o f the O range F ree State, B loem fontein 9301
See Fig. 2 for ex p lan atio n o f the H ighveld Region Received 9 Ja n u a ry 1981; approved 21 A ugust 1981
fore decided to extend this com parison to soils with higher lime requirem ents th a n those used by H au m an n & V olschenk (1979) and m ore representa tive o f soils w ith pH (H 20 ) values lower th a n 5,5 . The newly developed double buffer SM P m ethod, claim ed by M cLean, Eckert, R eddy & Trierw eiler (1978) to be an im provem ent on the m ethod o f Shoem aker, M cL ean & P ra tt (1961) especially for soils w ith lime requirem ents lower th an 4 ,0 t C a C 0 3 h a -1, was also evaluated in this study. The C a C 0 3 incubation m ethod (M cL ean, D um ford & C oronel, 1966) was used as stan d ard reference m ethod to com pare several buffer m ethods fo r determ ining
ce
d
by
S
ab
in
et
G
at
ew
ay
u
nd
er
li
ce
nc
e
gr
an
te
d
by
th
e
Pu
bl
is
he
r (
da
te
d
20
12
lime requirem ent o f soils. The incubation m ethod is regarded as being reliable b u t is not used in routine la b o rato ry analysis because it is too tim e consum ing (M cL ean et al., 1966).
M a t e r i a l s a n d p r o c e d u r e
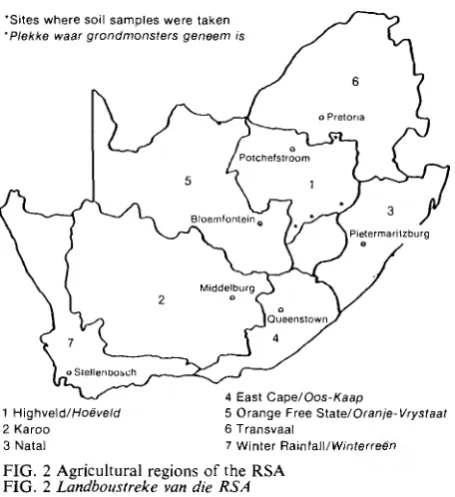
T hirty top- and subsoil sam ples o f each o f the H u tto n , A valon and Clovelly form s (M acV icar, D e Villiers, L oxton, Verster, L am brechts, M erry- w eather, Le R oux, Van Rooyen & H arm se, 1977) w ith pH (H 20 ) values ranging from 4 ,4 to 6 ,3 and clay content from 3 ,0 to 2 9 ,0 % were selected for this study. The samples were taken during July and A ugust o f 1978 in the D elm as, Ficksburg, C locolan and H arrism ith m agisterial districts. A fter sam pling, the soils were dried and passed th ro u g h a 2 mm sieve. T he soils sam pled represent a fairly wide acidity range and any deductions th a t are m ade should be generally applicable to acid soils in the H ighveld R egion (see Fig. 2 for H ighveld R egion). The fol low ing soil properties were determ ined:
(i) pH (H 20 and K C 1) in a soil to solution ratio o f 1 :2 ,5 (Jackson, 1958).
(ii) C ation exchange capacity (CEC) and exchange able bases at pH 7 ,0 using 1 m ol N H 4OAc dm -3 (Jackson, 1958).
(iii) O rganic m atter according to the m ethod o f W alkley & Black (Jackson, 1958).
(iv) Clay percentage according to the pipette m ethod (D ay, 1965).
(v) Exchangeable A l and M n in 0 ,2 m ol N H 4C1 dm -3 . Percentage A l-sa tu ra tio n was calculated as
C-a + M g + K + A ! ^ 0 * ’ 1 9 ” >
(vi) Percentage base u n satu ratio n was calculated as 100—percentage satu ratio n ( = % B unsat.).
(vii) E xtractable acidity in 0 ,5 m ol K„SO.,+ 5 g C H 3 C O O K d m - 3 (Eksteen, 1969).
(viii) Exchangeable acidity in 1 m ol KC1 d m -3 (K am p rath , 1967).
(ix) R-values (Eksteen, 1969) were also calculated. ( R = 0 ,1 m o l H C l-e x tra c ta b le C a + M g divided by extractable acidity).
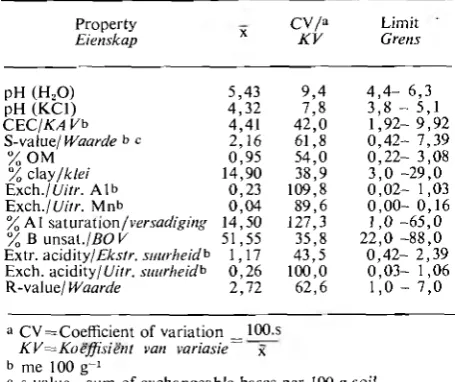
T he d a ta are sum m arised in T able 1 in term s of average values (x), coefficient o f variation (CV) and highest and low est values.
T A B L E 1 S tatistical analysis o f soil properties TA B E L 1 S ta tistiese verwerking van grondeienskappe
P ro p erty
Eienskap X
C V /a K V
Lim it Grens
pH (H 20 ) 5 ,4 3 9 ,4 4 , 4 - 6 ,3
pH (K C 1) 4 ,3 2 7 ,8 3 ,8 - 5,1
C E C /K A Vb 4,41 4 2 ,0 1 ,9 2 - 9 ,9 2 S-value/ IVaarde b c 2 ,1 6 61,8 0 ,4 2 - 7 ,3 9
7 „ O M 0 ,9 5 5 4 ,0 0 ,2 2 - 3,08
/ clay /k le i 14,90 3 8 ,9 3 ,0 - 2 9 ,0
E x c h ./Uitr. A lb 0 ,2 3 109,8 0 ,0 2 - 1,03 E x ch.jU itr. Mnb 0 ,0 4 8 9 ,6 0 ,0 0 - 0 ,1 6 % A 1 s&iuraXion/versadiging 14,50 127,3 1 ,0 - 6 5 ,0 % B unsal J B O V 51,55 35,8 2 2 ,0 - 8 8 ,0 Extr. acidity/E kstr. suurheidb 1,17 4 3 ,5 0 ,4 2 - 2 ,3 9 Exch. a cid ity /Uitr. suurheidb 0 ,2 6 100,0 0 ,0 3 - 1,06
R -value/ Waarde 2 ,7 2 6 2 ,6 1 ,0 - 7 ,0
a C V = C o efficien t o f varia tio n _ lOO.s K V = K o e ffisie n t van variasie~ x b me 100 g ' 1
c s-v a lu e= su m o f exchangeable bases per 100 g soil s-w aarde—som van uitruilbare basisse per 100 g grand
D uplicate 500 g sam ples of each soil were treated with precipitated C a C 0 3 (A R ) equivalent to 0; 1; 2; 4; 8 and 16 t/h a 150 m m -1 and thoroughly m ixed. The soils were m oistened to field capacity and kept in the dark at room tem p eratu re fo r fo u r m onths, and then air-dried and crushed. All lim e requirem ents are based on the assum ption th a t 1 h a soil 150 mm deep has a m ass o f 2 400 tons (viz. a bulk density o f 1 600 kg m -3).
A fter incubation there was a range o f six levels o f neutralization for each soil. G raphs of p H (H 20 ) versus tons C a C 0 3 h a-1 150 m m -1 were com piled for each soil. These graphs were used to determ ine incubation lime requirem ent fo r p H (H 20 ) 6 ,5 . In cubation lime requirem ent was co m p ared w ith those obtained by the various buffer m ethods.
T he follow ing buffer m ethods were used to d e te r m ine lime requirem ent o f the soils: W o o d ru ff (1948) as m odified by “ Iow a State U niversity Soil T esting L ab o ra to ry ” (H aum ann & V olschenk, 1979); Shoe m aker et al. (1961-1961 SM P m eth o d ); 1966 SM P m e th o d 1 (M cLean et al., 1966); Highveld R egion SM P m ethod (H V R SM P m e th o d 2) (H aum ann & Volschenk, 1979); A dam s & Evans (1962) and the d o u b le buffer SM P m ethod (1978 SM P m ethod) o f M cLean et al. (1978). All these m ethods were used to d eterm ine lime requirem ent for attain in g a soil p H (H 20 ) o f 6 ,5 .
Re s u l t s a n d d is c u s s io n
Because the soils were selected according to p H , they are all in the acid p H range (Table 1). Lowest soil reaction values were pH 4 ,4 ( H 20 ) and pH 3 ,8 (KC1). Lowest values for exchangeable bases (S-value) and R-value o f 0 ,4 2 me 100 g-1 and 1,0 respectively, and highest value o f 1,06 and 1,03 me 100 g ^1 for exchangeable acidity and A l respectively, indicate the need to lime. A l-sa tu ra tio n values ranging from 1,0 to 6 5 ,0 % w ith an average o f 1 4 ,5 % are an indication o f p ro b ab le severe A 1-toxicity in m ost o f the soils. A n A l-sa tu ra tio n o f greater than 12% is, according to Fox (1979), d e trim en tal to m aize
T A B L E 2 Statistical analysis o f lime requirem ents (t C a C 0 3) h a - 1 150 m i r r 1 for p H (H 20 )6 ,5 determ ined by different m ethods
T A B E L 2 Statistiese verwerking van kalkbehoeftes (t C a C 0 3) h a - 1 150 m m '1 vir p H (H X )) 6 ,5 wat bepaal is m et
verskillende metodes
M e th o d/M eto d e X C V /K V* Lim it/G re«i'
Incubation//«fc«6att'e 2 , 8 6 4 ,0 0 , 4 - 8 , 0
1961 SM P 2 ,9 100,0 0 ,0 - 9 , 9
1966 S M P 4 ,2 7 1 ,0 0 , 0 - 9 , 9
H V RjH V S SM Pb 3 ,7 5 9 ,0 0 , 0 - 9 , 0
1978 SM P 2 ,7 6 3 ,0 0 , 0 - 9 , 9
A d am s & Evans 5 ,2 5 2 ,0 1 ,1 - 9 ,9
W o o d ru ff 3 ,7 5 4 ,0 0 ,0 - 9 , 9
a C V = C o efficien t o f v a ria tio n __ lOO.s K V = K o e ffisie n t van variasie' x
b T his m ethod was referred to by H au m an n & V olschenk (1979) as the SM P-1 m ethod
H ierdie m etode is na verwys as die S M P A -m e to d e deur H aum ann & Volschenk (1979)
1 T he procedure for this m eth o d is the sam e as th a t o f the 1961 S M P m ethod except th a t the buffer p H is adjusted to 7 ,3 instead o f 7 ,5
2 T h is m ethod is referred to by H a u m an n & V olschenk (1979) as the SM P-1 m ethod. T h e SM P-2 m ethod referred to by H a u m an n & V olschenk (1979) was replaced by the 1966 SM P m ethod in this study.
d
by
S
ab
in
et
G
at
ew
ay
u
nd
er
li
ce
nc
e
gr
an
te
d
by
th
e
Pu
bl
is
he
r (
da
te
d
20
12
P. E. H A U M A N N
production. Values fo r exchangeable acidity and exchangeable A1 are o f the same order and the deduction can be m ade th a t exchangeable acidity represents mostly exchangeable A l.
The lime requirem ents indicated by the different m ethods are sum m arised in T able 2 in term s o f average values (x) coefficient o f variation (CV) and highest and lowest values.
T he soils used in this study have a fairly wide variation in lime requirem ent as evidenced by the coefficient o f variation o f 64% for incubation lime requirem ent. Lime requirem ents determ ined by the o ther m ethods show the sam e trend. The SM P and W oodruff m ethods indicate no lime requirem ent in certain cases where the incubation and other m ethods do indicate lime requirem ent. The interpretation can be m ade th a t the SM P and W oodruff m ethods lack sensitivity for soils o f low lime requirem ent and require adjustm ent to accom m odate these soils. The m ethods are arranged as follows according to average lime requirem ents:
A dam s & E v an s> 1 9 6 6 S M P > W o o d ru ff= H V R S M P > 1961 S M P > In c u b a tio n > 1978 SM P.
C orrelation and regression analyses o f incubation lime requirem ent versus lime requirem ent determ ined by the buffer m ethods were conducted and the results tab u lated in Table 3 in term s o f correlation coefficient (r), standard erro r o f determ ination (sy.x) for the regression equation and regression equations.
T A B L E 3 Sim ple linear correlatio n and regression o f in cu b a tion lim e requirem ent versus lime requirem ents determ ined by o th er m ethods
T A B E L 3 Enkelvoudige lineere korrelasie en regressie van inkubasiekalkbehoefte m et kalkbehoeftes wat m et ander m etodes bepaal is
M ethod
M etode r a Sy.x
R egression e q u atio n /b
Regressievergely-kin g /b
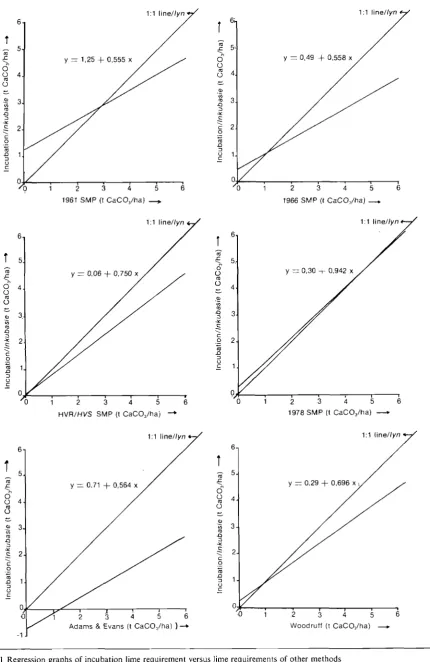
1966 SM P 0,9219 0 ,7 0 y — 0 ,4 9 + 0 ,5 5 8 x
H V R /H V S S M P 0,9189 0,71 y = 0 ,0 6 + 0 ,7 5 0 x
1978 SM P 0,8984 0 ,7 9 y = 0 ,3 0 + 0 ,9 4 2 x
1961 SM P 0,8817 0 ,8 5 y = 1 ,2 5 + 0 ,5 5 5 x
A dam s & E vans 0,8336 0 ,9 9 y = —0 , 7 1 + 0 , 564x
W oodruff 0,7690 1,15 y = 0 ,2 9 + 0 ,6 9 6 x
a r > 0 ,2 0 5 0 and 0,2673 significant a t P = 0 , 0 5 and 0,01 respec tively
/■^C-,2050 en 0,2673 betekenisvol by ,P = 0 ,0 5 en 0 ,01, respektiew elik
b y = calculated lime requirem ent (t C a C 0 3 h a ' 1 150 m m - 1) y= b erek en d e kalkbehoefte(t C aC O s ha” 1 150 m m r 1)
x = lime requirem ent (t C a C 0 3 h a ' 1 150 m m '1) o f other m ethods
\= k a lk b e h o e fte ( t C a C 0 3 ha-1 150 m m r 1) van ander m etodes
All the m ethods correlated highly significantly w ith the incubation m ethod. The m ethods are arranged as follows according to correlation w ith the incuba tion m ethod: 1966 S M P > H V R S M P > 1 9 7 8 S M P > 1961 S M P > A dam s & E v a n s> W oodruff.
T he regression equations in Table 3 are graphically illustrated in Fig. 1
The 1966 SM P and W o odruff m ethods attained m axim um accuracy a t an in cubation lime requirem ent o f approxim ately 1 ,0 t C a C 0 3 ha-1 . Below this value these m ethods underestim ated incubation lime requirem ent and above this value they overestim ated incubation lime requirem ent. The H V R SM P m ethod slightly underestim ated incubation lime requirem ent below 0 ,2 t C a C 0 3 ha-1 and overestim ated incubation lime requirem ent above this value. The 1961 SM P m ethod attained m axim um accuracy at an incubation lime requirem ent o f approxim ately 3 ,0 t C a C 0 3 ha-1 . Below this value the 1961 SM P m ethod u nder estim ated incubation lime requirem ent and above this value overestim ated incubation lime requirem ent. The A dam s & Evans m ethod consistently overesti m ated incubation lime requirem ent. The 1978 SM P m ethod slightly underestim ated incubation lime requirem ent below 5 ,0 t C a C 0 3 ha-1 and attained m axim um accuracy between 5 ,0 and 6 ,0 t C a C 0 3 ha-1 . It was the only m ethod investigated, however, th a t gave a regression line nearly parallel to the 1:1 line. This m ethod is therefore the m ost accurate o f all the m ethods fo r direct prediction o f incubation lime requirem ent. Lime requirem ents indicated by the different buffer m ethods a t incubation 1 me require m ents o f 0 ,0 ; 1 ,0 ; 2 ,0 ; 3 ,0 ; 4 ,0 ; 5 ,0 and 6 ,0 are given in Table 4.
A lthough the 1966 SM P m ethod does n o t give an accurate direct prediction o f incubation lime require m ent it can be used to m ake a relatively accurate calculation of incubation lime requirem ent w ith the aid o f the following regression equation (Table 3). y = 0 ,4 9 + 0 ,5 5 8 x
(r = 0 ,9 2 1 9 ; sy.x= 0 ,7 0 )
W here
y = c a lc u la te d lime requirem ent (t C a C 0 3 h a -1 150 m m -1)
x = 1 9 6 6 SM P lime requirem ent (t C a C 0 3 h a-1 150 m m -1)
As m entioned by H aum ann & Volschenk (1979) the tim e required for determ ination of, am ongst others, lime requirem ent is im p o rtan t fo r routine analysis. The 1978 SM P m ethod is m ore th an twice as long as the single buffer SM P and W oodruff m ethods (Table 5).
TA B L E 4 Lim e requirem ents o f the different m ethods at certain incubation lime requirem ents TA B E L 4 K alkbehoeftes van die onderskeie m etodes b y sekere inkubasiekalkbehoeftes
M e th o d/M eto d e Lim e requirem ent* /K alkbehoefte (t C a C 0 3 h a -1 150 m m '1)1
Incu b atio n/In ku b a s ie... ... 0 ,0 1 ,0 2 ,0 3 ,0 4 ,0 5 ,0 6 ,0
1966 S M P ... 0 ,9 2 ,8 4 ,5 6 ,3 8,1 9 ,9
H V R /tf K S ... 1,2 2 ,6 3 ,9 5 ,2 6 ,6 7 ,9
1978 S M P ... 0 ,8 1,8 2 ,9 3 ,9 5 ,0 6 ,0
1961 S M P ... - 0 , 5 1,3 3,1 5 ,0 6 ,8 8 ,6
A dam s & E v an s... 3 ,0 4 ,8 6 ,6 8 ,4 10,2 11,9
W o o d ru ff... 1 ,0 2 ,4 3 ,9 5 ,3 6 ,7 8 ,2
a All lime requirem ents are aim ed at a ttain in g a soil p H (H .O ) o f 6 ,5
A lle kalkbehoeftes is gebaseer op die verkryging van ’n g r o n d p H ( / f 20 ) van 6 ,5
39
ce
d
by
S
ab
in
et
G
at
ew
ay
u
nd
er
li
ce
nc
e
gr
an
te
d
by
th
e
Pu
bl
is
he
r (
da
te
d
20
12
F IG . 1 R egression graphs o f incubation lime requirem ent versus lime requirem ents o f other m ethods F IG . 1 Regressiegrafieke van inkubasiekalkbehoefte teen ka lkbehoeftes van ander metodes
d
by
S
ab
in
et
G
at
ew
ay
u
nd
er
li
ce
nc
e
gr
an
te
d
by
th
e
Pu
bl
is
he
r (
da
te
d
20
12
P. E. H A U M A N N
2 K a ro o 6 T ra n sva a l
3 N a ta l 7 W in te r Ra\nt a\\/Winterreen
F IG . 2 A gricultural regions o f the RSA F IG . 2 Landboustreke van die R S A
T A B L E 5 T im e required fo r lime requirem ent determ in atio n T A B E L 5 T yd benodig vir kalkbehoeftebepaling
M ethod M etode
T im e req u ire d 2 T y d benodiga
In cu b atio n /Inkubasie 4 j m o n th s/m a a n d e 1961, 1966 an d H V R /en H V S SM P 35 min
1978 SM P 80 min
A dam s & E vans 90 min
W oodruff 40 min
a T im e required for the entire procedure T y d benodig vir die hele prosedure
A lthough the 1978 SM P m ethod gives a better direct prediction o f incubation lime requirem ent than the o ther m ethods, the H V R and 1966 SM P m ethods can, w ith the aid o f their regression equations (Table 3), give a better indication o f incubation lime requirem ent than the 1978 SM P m ethod. It is obvious th at a com prom ise between accuracy and speed of determ ination should be made. It is, however, a sim pler o peration to correct an obtained value than to use a m ethod which involves twice the effort to gain a slightly m ore accurate value fo r lime require ment.
It is interesting to note th a t the H V R SM P m ethod showed a better correlation w ith incubation lime requirem ent and the m ethods o f A dam s & Evans (1962) and W oodruff (1948) showed w eaker correla tion w ith incubation lime requirem ent in this study th an in the study o f H aum ann & V olschenk (1979). The m ethod o f A dam s & Evans was form ulated for soils w ith low lime requirem ents and Shoem aker et al. (1961) found th a t the W oodruff m ethod was suitable for soils low in exchangeable A l. T he 1961 SM P m ethod, on the o ther hand was form ulated for soils w ith “ appreciable” am ounts o f exchangeable A l. The logical deduction th a t can be m ade is th a t the soils in this study are m ore acid than those used by H aum ann & Volschenk (1979) and th a t the claims o f the authors regarding the above-m entioned m ethods are probably valid.
Co n c l u s i o n
A lthough the 1978 SM P m ethod gives a slightly m ore accurate direct prediction o f incubation lime require m ent than any o f the o th e r m ethods, it is nevertheless a relatively tim e-consum ing m ethod com pared to the single buffer 1961, 1966 and H V R SM P and W oodruff m ethods. It would therefore be advisable to use a correction factor (regression equation) to adjust the lime requirem ent tables o f either the 1966 or the H V R SM P m ethods rath er th an to use the 1978 SM P m ethod for ro u tin e analysis.
As m entioned by H au m an n & V olschenk (1979) a draw back o f the above-m entioned buffer m ethods is th a t they are aim ed at attain in g a soil pH (H aO) o f 6 ,5 which is not necessarily ideal for all crops (O rchard, 1972). T herefore, an evaluation o f m ethods o f determ ining lime requirem ent based on acid and base saturation and applicable to specific crops rem ains an object for fu rth er investigation.
Lime requirem ent obtained by C a C 0 3 incubation cannot be directly applied to field conditions. A so- called “ lim ing fa c to r” (Russell, 1973) which can vary from 1 to 2 and even higher depending inter alia on the quality o f the agricultural lime used in practice, is used to increase incubation lime requirem ent in order to arrive at a field recom m endation. Lim ing trials conducted in order to verify the findings o f this study and to calibrate the lime requirem ent determ ination m ethods for field conditions and different qualities o f agricultural lime rem ain a priority.
Re f e r e n c e s
A D A M S , F. & E V A N S, C. E., 1962. A rapid m eth o d for m easuring lime requirem ent o f red-yellow podzolic soils. Proc. S o il Sci. Sac. A m . 26, 355-357.
D A Y , P. R ., 1965. Particle fractio n atio n an d particle-size analysis. C h ap te r 43. In: M ethods o f soil analysis (Ed. C. A. Black) M ad iso n : A m . Soc. A gron., 545-567.
E K S T E E N , L. L., 1969. T he determ ination o f lim e require m ents o f soils for various crops in the W inter R ainfall Region. Fert. Soc. S. Afr. J. 2, 13-14.
F O X , R. H ., 1979. Soil pH , alum inium satu ratio n a n d corn grain yield. Soil Sci. 127, 330-334.
H A U M A N N , P. E. & V O L S C H E N K , J. E., 1979. K alk- behoeftes van gronde in die H oeveldstreek. 1. ’n Vergelyking van verskillende m etodes om k alk b eh o efte te bepaal. Agro-chemophysica. 11, 33-36.
JA C K S O N , M. L., 1958. Soil chem ical analysis. L o n d o n : C onstable & Co. Ltd.
K A M P R A T H , E. J., 1967. Soil acidity a n d response to liming. In tern atio n al soil testing. T echnical bulletin N o. 4. M A C V IC A R , C. N ., D E V IL L IE R S , J. M ., L O X T O N , R. F.,
V E R S T E R , E., L A M B R E C H T S , J. J. N ., M E R R Y - W E A T H E R , F. R „ LE R O U X , J., V A N R O O Y E N , T. H., & H A R M S E , H. i . VON M „ 1977. Soil classification. A B inom ial system for S outh A frica. Sci. Bull. 390. P reto ria : D ep artm en t o f A gricultural T echnical Services.
M C L E A N , E. O., D U M F O R D , S. W. & C O R O N E L , F. A., 1966. C om parison o f several m ethods o f determ ining lime requirem ents o f soils. Proc. S o il Sci. Soc. A m . 30, 26-30. M C L E A N , E. O., E C K E R T , D . J., R E D D Y , G . Y. & T R IE R -
W E1LER , J. F ., 1978. A n im proved SM P soil requirem ent m ethod in co rp o ratin g double-buffer an d quick test features. J. Soil. Sci. Soc. A m . 42, 311-316.
O R C H A R D , E. R ., 1972. Som e thoughts on soil acidity a n d lim ing Fert. Soc. S. A fr. J. 1, 5-9.
R U S S E L L , E. W ., 1973. Soil con d itio n s a n d plant grow th. 10th E dition. L o n d o n : L ongm an.
S H O E M A K E R , H. E., M C L E A N , E. O. & P R A T T , P. F., 1961. Buffer m ethods for d eterm ining lim e requirem ent o f soils with appreciable a m o u n ts o f extractable alum inium . Proc. Soil Sci. Soc. A m . 25, 274-277.
W O O D R U F F , C. M ., 1948. Testing soils fo r lime requirem ent by m eans o f a buffered solution an d the glass electrode. Soil. Sci. 66, 53-63.
41