INTRODUCTION
Acute pulmonary embolism (PE) is a life-threatening car-diovascular disease that has an incidence rate of 60–70 cases per 100,000 individuals and is associated with significant morbidity and mortality [1]. PE usually occurs secondary to deep vein thrombosis (DVT), and the mortality rate is partic-ularly high in patients with multiple comorbidities and poor hemodynamics [2,3]. A previous study reported that PE is responsible for about 300,000 deaths per year in Europe [4], and the all-cause short-term mortality rate of PE varies signifi-cantly, from 2% to 95%, depending on disease severity [5]. Due to this uncertainty about the prognosis of PE patients, new risk classification methods and biological markers are being
investigated for determining the optimal treatment strategy and estimating the prognosis of disease.
The current research suggests that the progression of vein thrombosis is associated with inflammation. Thrombus formation is a result of abnormalities of blood flow, the vas-cular wall, and blood components. Inflammation both causes endothelial damage and affects blood components by increas-ing procoagulants and inhibitincreas-ing anticoagulant pathways and fibrinolytic activity [6]. Therefore, inflammation-related mark-ers in the circulation have emerged as promising prognostic factors in thrombosis associated diseases. Among these bio-markers, the neutrophil-lymphocyte ratio (NLR) and plate-let-lymphocyte ratio (PLR) were suggested to be useful in prognosis of PE patients [7]. However, the results of different studies on the prognostic value of NLR and PLR in PE have been controversial [8]. Based on this background, we aimed to evaluate the prognostic value of NLR, PLR, and lympho-cyte-monocyte ratio (LMR) in PE patients in relation to their demographic and clinical characteristics.
MATERIALS AND METHODS
Patients and study design
A total of 103 PE patients hospitalized and treated in a department of cardiology between 2011 and 2015 were included in the study. The risk categories of the patients were determined according to the Wicki and Wells criteria. 1 Department of Cardiology, Private Mugla Yucelen Hospital, Mugla,
Turkey
2 Department of Cardiology, Faculty of Medicine, Balikesir University,
Balıkesir, Turkey
3 Department of Cardiology, Faculty of Medicine, Mugla Sitki Kocman University, Mugla, Turkey
*Corresponding author: Nuri Köse, Department of Cardiology, Private Mugla Yucelen Hospital, Kotekli Mevkii, Marmaris Street, No:1, 48000 Mugla, Turkey. Phone: +90 - 252 213 11 77. E-mail: drnurikose@hotmail.com
DOI: http://dx.doi.org/10.17305/bjbms.2019.4445
Submitted: 08 September 2019/Accepted: 07 November 2019 Conflict of interest statement: The authors declare no conflict of interests
Prognostic role of NLR, PLR, and LMR in patients with
pulmonary embolism
Nuri Köse1*, Tarık Yıldırım2, Fatih Akın3, Seda Elçim Yıldırım3, İbrahim Altun3
ABSTRACT
Pulmonary embolism (PE) is associated with significant morbidity and mortality. New biological markers are being investigated for estimating the prognosis of PE patients. Since PE is closely associated with inflammatory status, the neutrophil-lymphocyte (NLR), platelet-lymphocyte (PLR), and lymphocyte-monocyte (LMR) ratios were suggested to be useful in predicting patient outcomes. This study aimed to evaluate the prognostic role of NLR, PLR, and LMR in PE. A total of 103 PE cases from a cardiology department were included in the study. We retrospec-tively evaluated demographic and clinical characteristics, treatments, laboratory and imaging findings, and outcomes of patients. The median follow-up of PE patients was 39 months, and the 5-year overall survival probability was 73.8%. Out of 103 patients, 20 were classified as high risk PE cases (19.4%). Thrombolytic treatment was administered to 23 patients (22.3%). Systolic pulmonary arterial pressure was measured during one year, showing a significant decrease from 51.7 ± 15.7 mmHg at admission to 26.6 ± 4.0 mmHg at first year assessment. Age (OR: 1.06,
p < 0.001) and NLR (OR: 1.52, p < 0.0019) were significantly associated with the disease status. The independent prognostic factors in moder-ate-low and low risk PE groups were NLR (HR: 1.17, p = 0.033) and LMR (HR: 1.58, p = 0.046). In moderate-high and high risk PE patients, the independent prognostic factors were age (HR: 1.07, p = 0.014) and PLR (HR: 1.01, p = 0.046). NLR, PLR, and LMR were associated with the prognosis of PE patients. The clinical severity of PE should be considered when utilizing these markers to assess patient outcomes.
KEYWORDS: Pulmonary embolism; neutrophil-lymphocyte ratio; NLR; platelet-lymphocyte ratio; PLR; lymphocyte-monocyte ratio; LMR; prognosis; patient outcomes
High-risk patients had a systolic blood pressure <90 mmHg or at least 40 mmHg decrease in systolic blood pressure for at least 15 min, developed cardiogenic shock, or had a right atrial thrombus accompanying PE. Moderate-high risk patients were in PE severity index (PESI) class III-V or had a simplified PESI (sPESI) score >1, had right ventricular failure in echocar-diography, and increased cardiac troponin T levels. Patients with hematological, oncological, collagen tissue, inflam-matory, congenital heart, or severe renal/liver disease were excluded from the study.
Control group consisted of 102 patients selected from out-patient clinics other than cardiology, cardiovascular surgery, and chest diseases.
Treatment protocol
Routine biochemistry, complete blood count (CBC), acti-vated partial thrombin time (aPTT), international normalized ratio (INR), arterial blood gas analysis, troponin T and plasma D-dimer levels were analyzed, and electrocardiography and bedside echocardiography were performed in all cases. Contrast-enhanced chest computed tomography (CT) and/or lower extremity venous Doppler ultrasonography (USG) were performed based on the clinical profile of patients.
The thrombolytic treatment was administered to selected cases in the coronary intensive care unit. An infusion of 100 mg tissue plasminogen activator (tPA, alteplase) was administered for 2 hours. If aPTT levels were lower than two times of the normal value following alteplase administration, intravenous infusion of unfractionated heparin at 18 U/kg/hour after 80 U/kg heparin bolus dose was administered. aPTT assess-ment was performed every 6 hours during the first 24 hours and every 24 hours afterwards, and heparin dose was adjusted to maintain the aPTT level between 60 to 80 seconds. Warfarin (10 mg) was added to the treatment after the first day. The hep-arin treatment in combination with warfhep-arin was continued for at least 5 days. When an INR level >2 was maintained for 2 consecutive days, heparin was stopped and warfarin dose was continued for 3 months in patients without any underlying dis-ease and for 6 months in patients with DVT or recurrent PE.
Statistical analysis
Descriptive statistics included a mean ± standard devia-tion for numerical variables and frequencies and percentages for categorical variables. Comparisons of numerical variables between dependent groups were done using the Friedman test. The survival analyses were conducted using the Kaplan-Meier method. The association of the prognostic indicators with disease presence was analyzed using logistic regression analysis. The logistic regression model fit was evaluated using the Hosmer and Lemeshow test. The prognostic value of
factors for predicting mortality in patient group was assessed using Cox proportional-hazards model. A p value <0.05 was considered to be statistically significant. IBM SPSS Statistics for Windows, Version 21.0. (IBM Corp., Armonk, NY, USA) was used for the analyses.
RESULTS
A total of 103 PE patients were included in the study. Fifty-seven patients were female (55.3%) and 46 were male (44.7%). The mean age of patients was 67.6 ± 13.1 years, and the mean body mass index (BMI) was 28.6 ± 3.9 kg/m2.
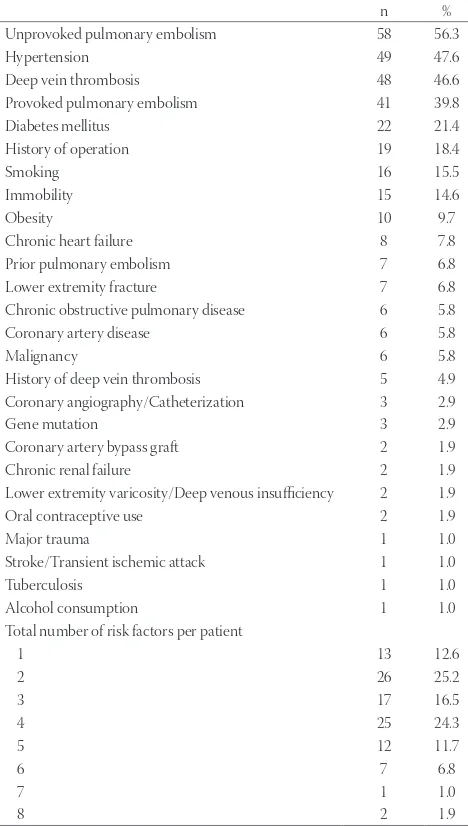
The distribution of previous risk factors and comorbid-ities among patients is summarized in Table 1. Unprovoked PE, provoked PE, and DVT were present in 56.3%, 39.8%, and 46.6% of patients, respectively. About 15.5% of patients were smokers and 14.6% were immobile. The median number of risk factors was 3 (range: 1–8).
TABLE 1. Distribution of risk factors and comorbidities in patients with pulmonary embolism
n %
Unprovoked pulmonary embolism 58 56.3
Hypertension 49 47.6
Deep vein thrombosis 48 46.6
Provoked pulmonary embolism 41 39.8
Diabetes mellitus 22 21.4
History of operation 19 18.4
Smoking 16 15.5
Immobility 15 14.6
Obesity 10 9.7
Chronic heart failure 8 7.8
Prior pulmonary embolism 7 6.8
Lower extremity fracture 7 6.8
Chronic obstructive pulmonary disease 6 5.8
Coronary artery disease 6 5.8
Malignancy 6 5.8
History of deep vein thrombosis 5 4.9
Coronary angiography/Catheterization 3 2.9
Gene mutation 3 2.9
Coronary artery bypass graft 2 1.9
Chronic renal failure 2 1.9
Lower extremity varicosity/Deep venous insufficiency 2 1.9
Oral contraceptive use 2 1.9
Major trauma 1 1.0
Stroke/Transient ischemic attack 1 1.0
Tuberculosis 1 1.0
Alcohol consumption 1 1.0
Total number of risk factors per patient
1 13 12.6
2 26 25.2
3 17 16.5
4 25 24.3
5 12 11.7
6 7 6.8
7 1 1.0
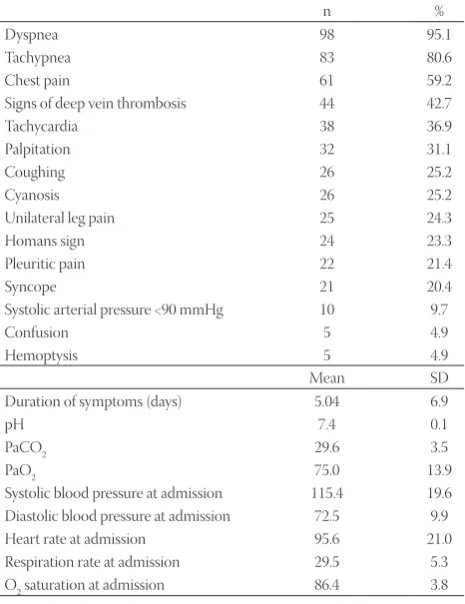
Clinical findings at admission are presented in Table 2. The most common findings at physical examination were dyspnea (95.1%) and tachypnea (80.6%). The mean duration of symp-toms prior to admission was 5.04 ± 6.9 days (range 0–30 days). The mean systolic and diastolic blood pressures were 115.4 ± 19.6 mmHg (70–190 mmHg) and 71.9 ± 12.2 mmHg (40–100 mmHg), respectively. The mean heart and respira-tory rates were 94.8 ± 22.9 bpm (50–156 bpm) and 29.5 ± 5.3 per min (16–42 per min), respectively.
The findings of routine assessment and imaging studies are presented in Table 3. Lower extremity venous Doppler USG revealed DVT on the right side in 36 cases (35%) and on the left side in 28 cases (27.2%). In electrocardiography, 7 patients (6.8%) had atrial fibrillation, 69 had nonspecific ST changes (67%), 60 had S1Q3T3 (58.3%), and 54 had right precordial T wave inversion (52.4%). The most common echocardiography findings were paradoxical interventricu-lar septal motion and right ventricuinterventricu-lar dilatation (77.7%) and right ventricular hypokinesia (76.7%). Twenty-four patients (23.3%) had Grade I and 66 had Grade II (64.1%) tricuspid regurgitation. At pulmonary CT-angiography, 1 patient had thrombus in the pulmonary trunk, 40 patients (38.8%) in the right pulmonary artery or its branches, and 33 patients (32%) in the left pulmonary artery or its branches. Bilateral involve-ment was present in 30 cases (29.1%).
The mean PESI and sPESI scores were 3.7 ± 1.2 and 1.6 ± 1.0, respectively, and the mean duration of hospital stay was 6.4 ± 2.1 days. Twenty patients were classified as high-risk PE patients (19.4%). Thrombolytic treatment was administered to 23 patients (22.3%). Only 7 patients (6.8%) had minor hemor-rhage, and 3 patients died (2.9%) during hospitalization (Table 4).
TABLE 2. Clinical findings at admission in patients with
pulmonary embolism
n %
Dyspnea 98 95.1
Tachypnea 83 80.6
Chest pain 61 59.2
Signs of deep vein thrombosis 44 42.7
Tachycardia 38 36.9
Palpitation 32 31.1
Coughing 26 25.2
Cyanosis 26 25.2
Unilateral leg pain 25 24.3
Homans sign 24 23.3
Pleuritic pain 22 21.4
Syncope 21 20.4
Systolic arterial pressure <90 mmHg 10 9.7
Confusion 5 4.9
Hemoptysis 5 4.9
Mean SD
Duration of symptoms (days) 5.04 6.9
pH 7.4 0.1
PaCO2 29.6 3.5
PaO2 75.0 13.9
Systolic blood pressure at admission 115.4 19.6
Diastolic blood pressure at admission 72.5 9.9
Heart rate at admission 95.6 21.0
Respiration rate at admission 29.5 5.3
O2 saturation at admission 86.4 3.8
PaCO2: Partial pressure of carbon dioxide; PaO2: Partial pressure of oxygen
TABLE 3. Electrocardiography and imaging findings in patients
with pulmonary embolism
n %
Lower extremity venous Doppler ultrasonography 56 54.4
Right deep vein thrombosis 36 35.0
Acute 11 10.7
Subacute 21 20.4
Chronic 4 3.9
Left deep vein thrombosis 28 27.2
Acute 10 9.7
Subacute 16 15.5
Chronic 2 1.9
n %
Electrocardiographic assessment Rhythm
Atrial fibrillation 7 6.8
Pacemaker 2 1.9
Sinus 94 91.3
Non-specific ST changes 69 67.0
S1Q3T3 60 58.3
Right precordial T wave inversion 54 52.4
Sinus tachycardia 42 40.8
Incomplete right bundle branch block 6 5.8
Complete right bundle branch block 5 4.9
Pseudoinfarct pattern 2 1.9
Mean SD
Echocardiographic assessment
Left ventricular end-diastolic dimension 45.8 3.7
Left ventricular end-systolic dimension 28.4 4.1
Right ventricular dimension 31.5 6.7
Right atrial dimension 44.3 7.0
n %
Paradoxical interventricular septal motion 80 77.7
Right ventricular dilatation 80 77.7
Right ventricular hypokinesia 79 76.7
Right atrial thrombus 13 12.6
Tricuspid regurgitation
None 13 12.6
Grade I 24 23.3
Grade II 66 64.1
n %
Pulmonary computed tomography (CT) angiography
Pulmonary trunk 1 1.0
Right 40 38.8
Right main pulmonary artery 34 33.0
Right upper lobe artery 18 17.5
Right lower lobe artery 21 20.4
Right pulmonary artery segments 2 1.9
Left 33 32
Left main pulmonary artery 25 24.3
Left upper lobe artery 17 16.5
Left lower lobe artery 23 22.3
Left pulmonary artery segments 2 1.9
Patients were followed-up for a median of 39 months. The median survival of 39 months was not reached during the fol-low-up period, and the mean survival was 115.1 ± 9.4 months in the subsequent follow-ups. The 5-year overall survival prob-ability was 73.8%. The systolic pulmonary arterial pressure was measured during one year and showed a significant decrease from 51.7 ± 15.7 mmHg at admission to 26.6 ± 4.0 mmHg at 1st year assessment (p < 0.001) (Table 5).
A logistic regression model was built to evaluate poten-tial risk factors associated with the presence of the disease (dependent variable), including age, sex, NLR, PLR, and LMR (independent variables). The final model revealed that age (OR: 1.06, p < 0.001) and NLR (OR: 1.52, p < 0.0019) were sig-nificantly associated with the presence of PE (Table 6).
The prognostic value of the above risk factors was evalu-ated in a Cox-regression model. The analyses were conducted separately for each PE risk group. The independent prognostic
factors in moderate-low and low-risk PE patients were NLR (HR: 1.17, p = 0.033) and LMR (HR: 1.58, p = 0.046). In moder-ate-high and high risk PE patients, the independent prognos-tic factors were age (HR: 1.07, p = 0.014) and PLR (HR: 1.01, p = 0.046) (Table 7).
DISCUSSION
Acute PE is associated with significant morbidity and mor-tality, and the mortality rate varies from 8% to 30% [2]. Timely assessment and treatment are critical for successful outcomes in PE patients. However, depending on the location and load of thrombus, some patients may be asymptomatic at presen-tation [9]. Moreover, the current methods for the diagnosis of PE are time consuming and can lead to a delay in the diagno-sis and initiation of appropriate therapy. Therefore, new bio-logical markers that can be easily and quickly assessed in PE
TABLE 4. Risk classification and treatment characteristics in
patients with pulmonary embolism
Mean SD
PESI 3.7 1.2
sPESI 1.6 1.0
Shock index 0.85 0.29
Duration of hospitalization (days) 6.4 2.1
n %
Pulmonary embolism risk group
High 20 19.4
Moderate-High 45 43.7
Moderate-Low 28 27.2
Low 10 9.7
Thrombolytic treatment 23 22.3
≤24 hours 11 47.8
24–72 hours 7 30.4
>72 hours 5 21.7
Complications n %
Minor hemorrhage 7 6.8
In-hospital mortality 3 2.9
PESI: Pulmonary embolism severity index; sPESI: simplified PESI
TABLE 5. Survival and follow-up of patients with pulmonary embolism
Mean SE
Survival time (months) 115.1 9.4
Survival probabilities % SE
1-month 96.1 0.02
6-month 93.1 0.03
1-year 91.1 0.03
2-year 86.1 0.04
3-year 83.4 0.04
4-year 81.7 0.04
5-year 73.8 0.06
Systolic pulmonary arterial pressure Mean SD
Admission 51.7 15.7
1st month 31.4 6.4
6th month 28.0 4.1
12th month 26.6 4.0
TABLE 6. Logistic regression models for factors associated with pulmonary embolism
OR Lower95% CI for ORUpper p
Initial model
Age 1.06 1.03 1.09 <0.001
Sex (ref: female) 0.73 0.37 1.44 0.370
Neutrophil-lymphocyte ratio 1.45 1.10 1.91 0.009
Platelet-lymphocyte ratio 1.00 0.99 1.00 0.453
Lymphocyte-monocyte ratio 0.85 0.69 1.05 0.130
Constant 0.01 <0.001
Final model
Age 1.06 1.03 1.10 <0.001
Neutrophil-lymphocyte ratio 1.52 1.24 1.87 <0.001
Constant 0.01 <0.001
TABLE 7. Independent prognostic factors in pulmonary embolism
HR 95% CI for HR p
Lower Upper
Moderate-low and low risk patients Initial model
Age 1.06 0.99 1.14 0.119
Sex (ref: Female) 34.21 0.50 2352.09 0.102
Neutrophil-lymphocyte ratio 1.21 0.98 1.48 0.076
Platelet-lymphocyte ratio 1.00 0.98 1.01 0.545
Lymphocyte-monocyte ratio 1.56 0.94 2.59 0.086
Final model
Neutrophil-lymphocyte ratio 1.17 1.01 1.35 0.033
Lymphocyte-monocyte ratio 1.58 1.01 2.47 0.046
Moderate-high and high risk patients Initial model
Age 1.07 1.01 1.13 0.016
Sex (ref: Female) 1.09 0.35 3.43 0.88
Neutrophil-lymphocyte ratio 0.99 0.87 1.13 0.859
Platelet-lymphocyte ratio 1.01 1.00 1.01 0.115
Lymphocyte-monocyte ratio 0.95 0.71 1.29 0.751
Final model
Age 1.07 1.01 1.13 0.014
patients are being investigated. In this study, we evaluated the prognostic value of NLR, PLR, and LMR in patients with PE, which are easy-to-assess parameters that have been shown to have a prognostic role in PE. Our logistic regression analysis showed that NLR was significantly associated with the pres-ence of PE. Moreover, increased levels of NLR and LMR were associated with an increased mortality risk in patients with moderate-low and low-risk PE, while increased levels of PLR were associated with an increased mortality risk in patients with moderate-high and high-risk PE.
Inflammation has been proposed as the main mechanism underlying the association between PE and changes in hema-tologic parameters. Inflammation plays a key role in the pro-gression of thrombosis and pathophysiology of PE[10] and the prognostic values of different hematologic parameters have been associated with inflammatory status in PE patients. Since the role of inflammation in PE is well-known, neutrophils, lymphocytes, and platelets were suggested as useful prognos-tic indicators in those patients [11,12]. Considering that differ-ent white blood cell types, including neutrophils, eosinophils, and monocytes, are associated with inflammation, NLR and PLR are particularly convenient as each combines two inde-pendent markers of inflammation. In addition, it was reported that patients with a high platelet count and low lymphocyte count have a higher cardiovascular mortality rate [13,14].
Karataş et al. [7] investigated the prognostic value of CBC parameters at admission in 203 patients with PE and showed that NLR and PLR were independent prognostic factors of both short- and long-term mortality, with NLR having a better prognostic value than PLR [7]. Ma et al. [15] and Kayrak et al. [16] showed that NLR can be used as a predictor of 30-day mortality in patients with acute PE. In another, recent study, NLR as well as mean platelet volume (MPV) were suggested to be useful in the early detection of acute venous thromboembolism [17].Telo et al. [18] fur-ther showed that PLR and NLR were increased in high-risk PE patients. They indicated that PLR may have a prognos-tic value to predict 3-month mortality, whereas NLR may have prognostic value for in-hospital, 3th month, and total 3-month mortality [18]. According to Ertem et al. [19], LMR may also be used to predict short-term mortality in acute PE cases. Several other studies reported similar findings about the prognostic role of NLR and PLR in PE [8,20,21], sug-gesting that they could be routinely used in the prognostic assessment of PE.
Our results are consistent with the previous findings and, in addition, suggest that the risk stratification of PE patients may be critical for the selection of appropriate prognostic biomarkers. We found that NLR and LMR had a better prog-nostic value in lower risk PE patients, while PLR was associ-ated with prognosis in higher risk patients. Nevertheless, our
findings should be confirmed in larger studies that include more demographic, clinical, and laboratory parameters.
The major limitation of this study is the retrospective design, which significantly affected the number of parame-ters that could be assessed. Although the completeness of our dataset was satisfactory, a higher number of available parame-ters may affect the final estimation models. Another limitation of the study is the small number of included patients. A larger sample size should increase the power of statistical analyses, particularly of regression analysis. For example, although the confidence intervals in the regression analyses suggested a sta-tistically significant estimates, a larger study population may affect the HRs even more significantly.
CONCLUSION
We found that NLR, PLR, and LMR were associated with the prognosis of patients with PE. Clinical severity of the dis-ease should be considered when utilizing these parameters to predict patient outcomes.
REFERENCES
[1] García-Sanz MT, Pena-Álvarez C, López-Landeiro P, Bermo-Domínguez A, Fontúrbel T, González-Barcala FJ. Symptoms, loca-tion and prognosis of pulmonary embolism. Rev Port Pneumol 2014;20:194-9.
https://doi.org/10.1016/j.rppneu.2013.09.006.
[2] Konstantinides SV, Torbicki A, Agnelli G, Danchin N, Fitzmaurice D, Galiè N, et al. 2014 ESC guidelines on the diagnosis and manage-ment of acute pulmonary embolism. Eur Heart J 2014;35:3033-69, 3069a-3069k.
https://doi.org/10.1093/eurheartj/ehu283.
[3] Donzé J, Le Gal G, Fine MJ, Roy PM, Sanchez O, Verschuren F, et al. Prospective validation of the Pulmonary Embolism Severity Index. A clinical prognostic model for pulmonary embolism. Thromb Haemost 2008;100:943-8.
https://doi.org/10.1160/TH08-05-0285.
[4] Cohen AT, Agnelli G, Anderson FA, Arcelus JI, Bergqvist D, Brecht JG, et al. Venous thromboembolism (VTE) in Europe. The number of VTE events and associated morbidity and mortality. Thromb Haemost 2007;98:756-64.
https://doi.org/10.1160/TH07-03-0212.
[5] Aujesky D, Obrosky DS, Stone RA, Auble TE, Perrier A, Cornuz J, et al. A prediction rule to identify low-risk patients with pulmonary embolism. Arch Intern Med 2006;166:169-75.
https://doi.org/10.1001/archinte.166.2.169.
[6] Aksu K, Donmez A, Keser G. Inflammation-induced thrombosis: mechanisms, disease associations and management. Curr Pharm Des 2012;18:1478-93.
https://doi.org/10.2174/138161212799504731.
[7] Karataş MB, İpek G, Onuk T, Güngör B, Durmuş G, Çanga Y, et al. Assessment of prognostic value of neutrophil to lymphocyte ratio and platelet to lymphocyte ratio in patients with pulmonary embo-lism. Acta Cardiol Sin 2016;32:313-20.
https://doi.org/10.6515/acs20151013a.
[8] Wang Q, Ma J, Jiang Z, Ming L. Prognostic value of neutro-phil-to-lymphocyte ratio and platelet-to-lymphocyte ratio in acute pulmonary embolism: a systematic review and meta-analysis. Int Angiol 2018;37:4-11.
[9] Roy PM, Meyer G, Vielle B, Le Gall C, Verschuren F, Carpentier F, et al. Appropriateness of diagnostic management and outcomes of suspected pulmonary embolism. Ann Intern Med 2006;144:157-64. https://doi.org/10.7326/0003-4819-144-3-200602070-00003. [10] Marongiu F, Mameli A, Grandone E, Barcellona D. Pulmonary
thrombosis: a clinical pathological entity distinct from pulmonary embolism? Semin Thromb Hemost 2019;45:778-83.
https://doi.org/10.1055/s-0039-1696942.
[11] Acanfora D, Gheorghiade M, Trojano L, Furgi G, Pasini E, Picone C, et al. Relative lymphocyte count: a prognostic indicator of mor-tality in elderly patients with congestive heart failure. Am Heart J 2001;142:167-73.
https://doi.org/10.1067/mhj.2001.115792.
[12] Afzal A, Noor HA, Gill SA, Brawner C, Stein PD. Leukocytosis in acute pulmonary embolism. Chest 1999;115:1329-32.
https://doi.org/10.1378/chest.115.5.1329.
[13] Ly HQ, Kirtane AJ, Murphy SA, Buros J, Cannon CP, Braunwald E, et al. Association of platelet counts on presentation and clinical outcomes in ST-elevation myocardial infarction (from the TIMI Trials). Am J Cardiol 2006;98:1-5.
https://doi.org/10.1016/j.amjcard.2006.01.046.
[14] Horne BD, Anderson JL, John JM, Weaver A, Bair TL, Jensen KR, et al. Which white blood cell subtypes predict increased cardiovas-cular risk? J Am Coll Cardiol 2005;45:1638-43.
https://doi.org/10.1016/j.jacc.2005.02.054.
[15] Ma Y, Mao Y, He X, Sun Y, Huang S, Qiu J. The values of neutrophil to lymphocyte ratio and platelet to lymphocyte ratio in predicting 30 day mortality in patients with acute pulmonary embolism. BMC Cardiovasc Disord 2016;16:123.
https://doi.org/10.1186/s12872-016-0304-5.
[16] Kayrak M, Erdoğan HI, Solak Y, Akilli H, Gül EE, Yildirim O, et al. Prognostic value of neutrophil to lymphocyte ratio in patients with acute pulmonary embolism: a restrospective study. Heart Lung Circ 2014;23:56-62.
https://doi.org/10.1016/j.hlc.2013.06.004.
[17] Farah R, Nseir W, Kagansky D, Khamisy-Farah R. The role of neu-trophil-lymphocyte ratio, and mean platelet volume in detecting patients with acute venous thromboembolism. J Clin Lab Anal 2019:e23010.
https://doi.org/10.1002/jcla.23010.
[18] Telo S, Kuluöztürk M, Deveci F, Kirkil G. The relationship between platelet-to-lymphocyte ratio and pulmonary embolism severity in acute pulmonary embolism. Int Angiol 2019;38:4-9.
https://doi.org/10.23736/S0392-9590.18.04028-2.
[19] Ertem AG, Yayla C, Acar B, Kirbas O, Unal S, Uzel Sener M, et al. Relation between lymphocyte to monocyte ratio and short-term mortality in patients with acute pulmonary embolism. Clin Respir J 2018;12:580-6.
https://doi.org/10.1111/crj.12565.
[20] Galliazzo S, Nigro O, Bertù L, Guasti L, Grandi AM, Ageno W, et al. Prognostic role of neutrophils to lymphocytes ratio in patients with acute pulmonary embolism: a systematic review and meta-analysis of the literature. Intern Emerg Med 2018;13:603-8.
https://doi.org/10.1007/s11739-018-1805-2.
[21] Ates H, Ates I, Kundi H, Yilmaz FM. Diagnostic validity of hema-tologic parameters in evaluation of massive pulmonary embolism. J Clin Lab Anal 2017;31.
https://doi.org/10.1002/jcla.22072.
Related articles published in BJBMS
1. Specificity of electrocardiography and echocardiography changes at the patients with the pulmonary embolism
Amra Macić-Džanković and Meliha Pozderac-Memija, BJBMS, 2006
2. Echocardiographic monitoring of patients with heart failure