Remote Sensing and GIS for Hydrology and Water Resources (IAHS Publ. 368, 2015)
(Proceedings RSHS14 and ICGRHWE14, Guangzhou, China, August 2014). 281
Calculation of design flood for regions with no data but
influencedby warping dam projects
QIN YI
1, QUAN QIZE
1, LI KE
1& LI XUECHUN
21Key Laboratory of Northwest Water Resources and Environment Ecology of MOE, Xi’an University of Technology, Xi’an, Shaanxi, 710048, China
quanqize@sina.com
2 Hydrology and Water Resources Bureau of the Ningxia-Inner Mongolia Reach, Yellow River Conservancy Committee, Baotou, Inner Mongolia,014000, China
Abstract Construction of warping dams destroys the consistency of annual maximum discharge series, which makes it difficult to calculate design floods, and even harder to calculate design floods in regions with no data. In this paper, an approach including consistency handling and regional formulae for statistical parameters was proposed to solve the problem encountered in calculation of design flood in no data regions influenced by warping dam projects. Analysis showed that the calculation results of such an approach are close to the actual situations and the approach has flexibility.
Key words design flood; warping dam; consistency of hydrological series; hydrological zoning
1 INTRODUCTION
In the design of water conservancy projects, the calculation of design flood is undoubtedly a key step. Frequency analyses areneeded. The reliability of the result is related to the reliability, consistency and representativeness of the hydrological series employed. Hydrological series are influenced by many factors and the influence of human activities is comparatively prominent (Liang et al., 2011). Human activities such as constantly establishing reservoirs for full utilization of water resources and the building of many warping dams, for soil and water conservation, change the underlying surface and thus the consistency of hydrological series are destroyed.
There are three commonly-used methods for handling for consistency of hydrological series, i.e. genetic analysis method, discard method, and direct calculation method. The genetic analysis method has a clear target, so the method has been widely used for handling hydrological consistency. When the discard method is being used, it should have a sufficient time-series length, so this method has limitations. The direct calculation method is a method for which the theoretical derivation and actual application have been conducted by Xia et al. (2005). It is strongly theoretical but has relatively high uncertainty.
How to restore a hydrological series influenced by warping dam construction to its original state has become a research topic in China. He et al. (2008) proposed a calculation method using the original state restoration coefficient, and explained it through a calculation for restoring the peak flow to its original state. Although this method ensures the consistency of data series to a certain extent, it needs relatively many known conditions, and so has relatively strong subjectivity under the condition without complete data.
For calculation of design flood in a no-data region, hydrological zoning and regional frequency analysis can make the calculation results o more reliable (Dalrymple, 1960; Zhang and Hall, 2004). At present, researchers from abroad typically employ the regional comprehensive parameter method (Xiong et al., 2004), which is the weighted average parameter method. Such a method is suitable for regions of good hydrological similarity with evenly distributed hydrometric stations, and nearly stable and almost the same average value of all stations.
But in the northern loess regions of China, the mean value of data series at the hydrometric stations are not stable and there are big differences among stations. An original state restoration method based on genetic analysis was considered first; i.e. hydrological similarity zoning was conducted, and according to the factor influencing the consistency in the region and based on the observation data at all hydrometric stations, a new random variable series was constructed with the influence of the factor being taken into account, so that the series had consistency; and then, frequency analysis was carried out based on this series, to obtain the statistical parameters for all
hydrometric stations in the zones with hydrological similarity; finally, the regional empirical formulae of statistical parameters in the zones with hydrological similarity were established, so solving the problem of calculation of design flood in no data regions influencedby warping dams in the same hydrological zones.
2 AREA AND DATE 2.1 Study area
Yulin city was chosen as the study area. Yulin city is located at the middle reach of the Yellow River, in the northernmost part of Shaanxi Province, where the major geography is aeolian landforms and the loess hill and gully area (Fig. 1). This region has little precipitation; mean annual rainfall is 316.4–513.3mm, gradually decreasing from southeast to northwest, and less than 450mm over most of the region. So it is an ecologically vulnerable area with severe soil erosion. Consequently more than 10 thousand warping dams have been built in the region for soil conservation.
Fig. 1 Schematic map of Yulin city; I: aeolian landform, II: loess hill and gully area. Points indicate hydrometric stations in the region.
Warping dams refer to dams constructed specifically to retain soil and to form silted areas in gullies in a region. The most visualized function of warping dams are the retaining sediment and flood storage. Thus, warping dams will decrease the runoff yield area in a drainage basin, so causing a reduction in sediment and water quantities at the outlet section of the drainage basin, destroying the consistency of hydrological series.
2.2 Date
There are 27 hydrometric stations in the Yulin city; nine of them, labelled with numbers in Fig. 1, were used for this study. For all of the stationsthe latest year for observed data was 2010. The number of flood peaks in the AM series averages 45, and the minimum is over 30.
3 DESIGN FLOOD CALCULATION UNDER THE INFLUENCE OF WARPING DAM 3.1 Constructing a consistency series
consistency series for frequency calculation, that is:
) n kA AQn , , t kA A t Q , , 2 kA A 2 Q , 1 kA A 1 Q ( ) n y , , t y , 2 y , 1 (y … − − … − − = …
… (1)
where Qtis the measured annual maximum peak discharge in the tth year, m3/s; A is the drainage
basin area,km2; A
tis the sum of the drainage basin areas controlled by the warping dams upstream
of the hydrometric station in the tth year, km2. When the storage of a warping dam is fully silted,
its work is similar to terrace which can yield runoff, so a function change coefficient k for the warping dam is added here, and k=1 before full siltation, and k = the runoff yield coefficient of the terrace after full siltation.
The constructed new series is composed of two factors: one is the measured peak flow, which is random, and the other is the actual runoff yield area, which is deterministic as it is affected by human activities that are mostly planned. Each event in the series is obtained through division of the above two factors, so it is still random.
According to the usual practice, it is believed that Qmfollows the PIII distribution, and the
distribution of Y can be deduced:
− ′ − − − ′
= (y y0)α 1e β y y0
Γ(α) α β f(y) (2) with parameters: βα 0 y E(y)
= + ′ 2
β α 2 σ D(y) ′ = ′ =
Consistency analysis was carried out for the data drawn from Dianshi station (labelled 7 in Fig. 1) by the method of trend test, i.e. the correlation coefficient test. The analysis result showed that the correlation coefficient changed from 0.400 (Fig. 2(a)) to 0.085 (Fig. 2(b)) (rα=0.05 = 0.27) before and after handling consistency, which indicates that the consistency of the series improves. The same phenomena occurred at all chosen stations.
(a) (b)
Fig. 2 (a) Trend of Qm at Dianshi Station. (b) Trend of Y series at Dianshi Station.
3.2 Calculation of peak discharge of return period T years
Because the series Y is consistent, traditional frequency analysis methods can also be carried out here. So the design flood peak modulusqp, m3/(s·km2) for a specified design standard is calculated
with equation (3) from the statistical parameters estimated with the curve fitting method and based on theY series, and then the design peak flow is calculated with equation (4) based on the effective basin area A’(km2).
P)) Φ(Cs, Cvy Ey(1 P y P q = = + × (3) P q ) t kA (A P q A P Q
= ′⋅ = − ⋅
(4)
where P = 1/T, and T is the return period time.
α 2 Cs =
4 THE QUANTILE ESTIMATES UNDER WARP INFLUENCE IN NONE DATA AREA
Traditionally, regional frequency analysis methods were widely used to obtain design flood peaks in regions without data. It was also adopted here. The hydrological homogeneous region for the method was worked out by Li et al. (2014) who divided the Yulin region into six homogeneous sub-zones as shown in Fig. 1.
Figure 3 shows the statistical parameters comparison between the regional comprehensive parameter estimates and estimates from individual stationsgenerated by the curve fitting method. It reveals that the weighted average statistical parameters have too large differences from those at individual stations, so identificationof a regional law was conducted.
As can be seen from Fig. 4, the larger the drainage basin area, the smaller the average value
Ey and the coefficient of deviation Cvy; in addition, the parameters have relatively high correlations with the drainage basin area (the correlation coefficient is more than 0.9). Therefore, the statistical parameters in this zone can be expressed with regional empirical formulae, equations (5) and (6).
Fig. 3 Comparison of Ey, and Cvy at nine stations generated by different methods.
Fig. 4 Relationship between Ey and catchment area, Cvy and catchment area, in a homogenous region
0.64) b
35.91; (a
b aA Ey
= − = =
(5)
0.082) b
2.016; (a
b aA Cvy
= − = =
(6)
Figure 4 clearly shows that the results obtained from regional empirical formula are closer to the actual situations than those obtained from the weighted average method. When design flood peaks need to be calculated, after getting the value of catchment area,the statistical parameters can be obtained using equations (5) and (6) at first, and then through equations (3) and (4) the design flood can be obtained.
5 DISCUSSION
5.1 Comparison between before and after handling for consistency
The comparison has been made from two aspects. One is on the stability of Cv, the other is on rationality in application.
The value of Cv from each station should be similar in a homogeneous region, if the series of the stations are consistency. Figure 5 shows that after handling for consistency, Cv became more stable than before, which indicated that the proposal for consistency handling is reasonable, since its results fit the common sense above.
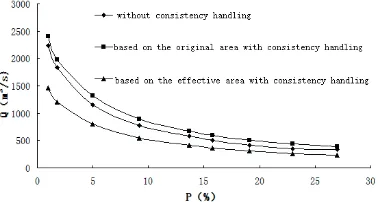
To verify the rationality in terms of application, the flood data series from Zhaoshiyao hydrometric station in the homogeneous zone IA (Fig. 1) was selected for comparison. Since the flood peak modulus series after handling for consistency is a quasi-natural runoff yield series, the peak discharge should be in direct proportion to catchment area. Thus it can be inferred that all peak flow values calculated based on the original area should be greater than that calculated on effective area, namely A′ (A′ = A – kAt). From Fig. 6, it can be easily seen that all peak discharges
calculated on the condition of no consistency handling are smaller than that calculated based on the original area with consistency handling, whereas they are larger than those based on the effective area. This indicates that the result obtained by the proposed method are secure in terms of project design and are closer to the actual situation. Therefore, the method is a rational one.
Fig. 5 The variation of Cv in homogeneous region.
Fig. 6 Comparison between values before and after consistency handling.
5.2 The performance of the approach in none data area
The performance of the proposed method in a no data area was test by a comparison of the calculated and measured peak values. The data used for testing were chosen from Suide hydrometric station (labelled 4 in Fig. 1) with an area of 3205 km2 and are listed in Table 1. The
frequency in Table 1 was found from the frequency curve. Since the warping dams were built in different years, the effective area changed several times. Using equations (5) and (6) with A′ = 3205 km2, the statistical parameters were calculated to be Ey = 0.20 m3/(s·km2), Cvy = 1.04, and
equations (3) and (4) to calculate peak discharge, Csy = 3, Cvy = 3.12, respectively. It can be seen that all relative errors between calculated and measured values are less than 11%, within the acceptable range. As Ey and Cvy are obtained from current effective area, calculated peak flow in the past should be smaller. Therefore, relative error in Table 1 is negative. As a whole, the performance of the method is reasonable.
6 CONCLUSIONS
Table 1 Comparison between calculated and measured values. Year Measured y
(m3/(s·km2)) Measured (m3/s) Q Frequency (%) Effective area (km2) Ey Cvy Calculated (m3/(s·km2)) y Calculated (m3/s) Q Relative error 1956 0.8 3120 3.68 3893 0.20 1.04 0.72 2808.63 −9.82% 1971 0.64 2420 6.29 3781 0.20 1.04 0.58 2211.53 −8.61% 1974 0.25 923 27.48 3692 0.20 1.04 0.22 828.90 −10.20% 1977 0.72 2450 4.80 3403 0.20 1.04 0.64 2193.09 −10.49% 1985 0.17 560 40.52 3294 0.20 1.04 0.15 500.74 −10.58% 2006 0.39 1250 15.47 3205 0.20 1.04 0.36 1166.45 −6.68%
The combination of consistency handling and the regional empirical formulae constructed under consistency series has a good performance in design flood computation in areas with no data.
The proposed approach is flexible because the k and At could be changed according to the
knowledge about the surroundings of the local engineer. From the results point of view, if the influence of warping dams is neglected, the calculated design peak value will be larger, especially in the case of a long return period.
REFERENCES
Dalrymple, T. (1960) Food Frequency Analysis Methods. US Geological Survey, Water Supply Paper 1543 A.
He, S.D., Liu, L. and Wang, W.C. (2008) Discussion on methods for restoring hydrological data to original state in regions with soil and water conservation projects. Yellow River 30(12), 43–44.
Li, K.(2014)Study on hydrological similarity zoning in Yulin region. M.E Thesis, School of Water Resources and Hydropower, Xi’an University of Technology, China.
Liang, Z.M., Hu, Y.M. and Wang, J. (2011) Advance in study on hydrological frequency analysis of inconsistency. Advances in Water Science22(6), 864–871.
Xie, P., Chen, G.C. and Xia, J. (2005) Hydrological frequency calculation principle of inconsistent annual runoff series in changing environments. Journal of Wuhan University38(6), 6–9.
Xiong, L.H., Guo, S.L. and Wang, C.J. (2004) Advance in study on regional flood frequency analysis methods in countries other than China. Advances in Water Science15(2), 261–267.