Quantifying the genetic correlation between multiple cancer types
Sara Lindström1,2, Hilary Finucane3,4, Brendan Bulik-Sullivan5, Fredrick R. Schumacher6,7, Christopher Amos8, Rayjean J. Hung9, Kristin Rand10, Stephen B. Gruber10, David Conti10, Jennifer B. Permuth11,12, Hui-Yi Lin13, Ellen L. Goode14, Thomas A. Sellers11,Laufey T. Amundadottir15, Rachael Stolzenberg-Solomon15, Alison Klein16,17, Gloria Petersen14, Harvey Risch18, Brian Wolpin19,20, Li Hsu2, Jeroen R Huyghe2, Jenny Chang Claude21,22, Andrew Chan23, Sonja Berndt15, Rosalind Eeles24, Douglas Easton25, Christopher A. Haiman10, David J. Hunter3,26, Benjamin Neale5, Alkes L. Price3 and Peter Kraft3,27; for PanScan, GECCO and the GAME-ON Network: CORECT, DRIVE, ELLIPSE, FOCI, and TRICL-ILCCO.
1Department of Epidemiology, University of Washington, Seattle, WA 98195, US; 2Division of Public Health Sciences, Fred Hutchinson Cancer Research Center, Seattle, WA 98109, US; 3Program in Genetic Epidemiology and Statistical Genetics, Department of Epidemiology, Harvard T.H. Chan School of Public Health, Boston, MA 02115, US; 4Department of Mathematics, Massachusetts Institute of Technology, Cambridge, MA 02139, US; 5The Analytic and Translational Genetics Unit, Massachusetts General Hospital, Boston, MA 02114, US; 6Department of Epidemiology and Biostatistics, Case Western Reserve University, Cleveland, OH 44106, US; 7Seidman Cancer Center, University Hospitals, Cleveland, OH 44106, US; 8Department of Community and Family Medicine, Geisel School of Medicine at Dartmouth, Hanover, NH 03755, US; 9Lunenfeld-Tanenbaum Research Institute, Sinai Health System, Toronto, ON M5G 1X5, Canada; 10Department of Preventive Medicine, Keck School of Medicine, University of Southern California, Los Angeles, CA 90033, US; 11Department of Cancer Epidemiology, Moffitt Cancer Center and Research Institute, Tampa, FL 33612, US; 12Department of Gastrointestinal Oncology, Moffitt Cancer Center and Research Institute, Tampa, FL 33612, US; 13Department of Biostatistics and Bioinformatics, Moffitt Cancer Center, Tampa, FL 33612, US; 14Department of Health Sciences Research, Mayo Clinic College of Medicine, Rochester, MN 55905, US; 15Division of Cancer Epidemiology and Genetics, National Cancer Institute, NIH, U.S. Department of Health and Human Services, Bethesda, MD 20892, US; 16Department of Oncology, Sidney Kimmel Comprehensive Cancer Center, Johns Hopkins School of Medicine, Baltimore, MD 21231, US; 17Department of Pathology, Sol Goldman Pancreatic Cancer Research Center, Johns Hopkins School of Medicine, Baltimore, MD 21218, US; 18Department of Chronic Disease Epidemiology, Yale School of Public Health, New Haven, CT 06510, US; 19Department of Medical Oncology, Dana-Farber Cancer Institute, Boston, MA 02115, US; 20Department of Medicine, Brigham and Women's Hospital and Harvard Medical School, Boston, MA 02115, US; 21Division of Cancer Epidemiology, German Cancer Research Center (DKFZ), 69120 Heidelberg, Germany; 22University Cancer Center Hamburg (UCCH), University Medical Center Hamburg-Eppendorf, 20246 Hamburg, Germany; 23Division of Gastroenterology, Massachusetts General Hospital, Boston, MA, 02115; 24Division of Genetics and Epidemiology, The Institute of Cancer Research, and Royal Marsden NHS Foundation Trust, London, SW3 6JB, UK; 25Centre for Cancer Genetic Epidemiology, Department of Oncology, University of Cambridge, Cambridge, CB2 1TN, UK; 26Channing Division of Network Medicine, Department of Medicine, Brigham and Women's Hospital, Boston, MA 02115, US; 27Department of Biostatistics, Harvard T.H. Chan School of Public Health, Boston, MA 02115, US
Running title: Genetic correlation between multiple cancer types Keywords: Genetic correlation, GWAS, cancer, BMI, heritability Financial support
funding to the Biomedical Research Centre at The Institute of Cancer Research and Royal Marsden NHS Foundation Trust. HKF is supported by the Fannie and John Hertz Foundation
PanScan is supported by the Intramural Research Program of the US National Institutes of Health (NIH), National Cancer Institute.
GECCO was supported by National Cancer Institute, National Institutes of Health, U.S. Department of Health and Human Services (U01 CA137088; U01 CA164930). Genotyping/Sequencing services were provided by the Center for Inherited Disease Research (CIDR). CIDR is fully funded through a federal contract from the National Institutes of Health to The Johns Hopkins University, contract number HHSN268201200008I.
ASTERISK: a Hospital Clinical Research Program (PHRC-BRD09/C) from the University Hospital Center of Nantes (CHU de Nantes) and supported by the Regional Council of Pays de la Loire, the Groupement des Entreprises Françaises dans la Lutte contre le Cancer (GEFLUC), the Association Anne de Bretagne Génétique and the Ligue Régionale Contre le Cancer (LRCC).
COLO2&3: National Institutes of Health (R01 CA60987).
CCFR: This work was supported by grant UM1 CA167551 from the National Cancer Institute and through cooperative agreements with the following CCFR centers: Ontario Familial Colorectal Cancer Registry (U01/U24 CA074783) and Seattle Colorectal Cancer Family Registry (U01/U24 CA074794)
The Colon CFR GWAS was supported by funding from the National Cancer Institute, National Institutes of Health (U01 CA122839 and R01 CA143237 to Graham Casey). The content of this manuscript does not necessarily reflect the views or policies of the National Cancer Institute or any of the collaborating centers in the Colon Cancer Family Registry (CCFR), nor does mention of trade names, commercial products, or organizations imply endorsement by the US Government or the CCFR.
CORECT: National Cancer Institute, National Institutes of Health under RFA # CA-09-002 (U19 CA148107). The content of this manuscript does not necessarily reflect the views or policies of the National Cancer Institute or any of the collaborating centers in CORECT, nor does mention of trade names, commercial products, or organizations imply endorsement by the US Government or CORECT.
CPS-II: The American Cancer Society funds the creation, maintenance, and updating of the Cancer Prevention Study-II (CPS-II) cohort. This study was conducted with Institutional Review Board approval.
DACHS: German Research Council (Deutsche Forschungsgemeinschaft, BR 1704/6-1, BR 1704/6-3, BR 1704/6-4 and CH 117/1-1), and the German Federal Ministry of Education and Research (01KH0404 and 01ER0814).
DALS: National Institutes of Health (R01 CA48998 to M. L. Slattery);
HPFS is supported by the National Institutes of Health (P01 CA055075, UM1 CA167552, R01 CA137178, R01 CA151993, R35 CA197735, K07 CA190673, and P50 CA127003), NHS and NHS II by the National Institutes of Health (R01 CA137178, P01 CA087969, UM1 CA186107, UM1 CA176726, R01 CA67262, R01 CA151993, R01 CA49449, R35 CA197735, K07 CA190673, and P50 CA127003) and PHS by the National Institutes of Health (R01 CA042182).
funding toward genetic analyses of OFCCR includes the Ontario Research Fund, the Canadian Institutes of Health Research, and the Ontario Institute for Cancer Research, through generous support from the Ontario Ministry of Research and Innovation.
PLCO: Intramural Research Program of the Division of Cancer Epidemiology and Genetics and supported by contracts from the Division of Cancer Prevention, National Cancer Institute, NIH, DHHS. Additionally, a subset of control samples were genotyped as part of the Cancer Genetic Markers of Susceptibility (CGEMS) Prostate Cancer GWAS (Yeager, M et al. Genome-wide association study of prostate cancer identifies a second risk locus at 8q24. Nat Genet 2007 May;39(5):645-9), CGEMS pancreatic cancer scan (PanScan) (Amundadottir, L et al. Genome-wide association study identifies variants in the ABO locus associated with susceptibility to pancreatic cancer. Nat Genet. 2009 Sep;41(9):986-90, and Petersen, GM et al. A genome-wide association study identifies pancreatic cancer susceptibility loci on chromosomes 13q22.1, 1q32.1 and 5p15.33. Nat Genet. 2010 Mar;42(3):224-8), and the Lung Cancer and Smoking study (Landi MT, et al. A genome-wide association study of lung cancer identifies a region of chromosome 5p15 associated with risk for adenocarcinoma. Am J Hum Genet. 2009 Nov;85(5):679-91). The prostate and PanScan study datasets were accessed with appropriate approval through the dbGaP online resource (http://cgems.cancer.gov/data/) accession numbers phs000207.v1.p1 and phs000206.v3.p2, respectively, and the lung datasets were accessed from the dbGaP website (http://www.ncbi.nlm.nih.gov/gap) through accession number phs000093.v2.p2. Funding for the Lung Cancer and Smoking study was provided by National Institutes of Health (NIH), Genes, Environment and Health Initiative (GEI) Z01 CP 010200, NIH U01 HG004446, and NIH GEI U01 HG 004438. For the lung study, the GENEVA Coordinating Center provided assistance with genotype cleaning and general study coordination, and the Johns Hopkins University Center for Inherited Disease Research conducted genotyping.
PMH: National Institutes of Health (R01 CA076366 to P.A. Newcomb). VITAL: National Institutes of Health (K05 CA154337).
WHI: The WHI program is funded by the National Heart, Lung, and Blood Institute, National Institutes of Health, U.S. Department of Health and Human Services through contracts
HHSN268201100046C, HHSN268201100001C, HHSN268201100002C,
HHSN268201100003C, HHSN268201100004C, and HHSN271201100004C. Corresponding author:
Sara Lindstrom
Department of Epidemiology University of Washington 1959 NE Pacific Street
Health Sciences Bldg, F-247B Box 357236
Seattle, WA 98195
Number of Supplementary Tables: 3 ABSTRACT
INTRODUCTION
In the US, cancer remains the second leading cause of death with an estimated 1.69 million new cancer diagnoses and 600,000 cancer deaths in 2017 (1). Six cancer types—breast, colorectal, lung, ovarian, pancreatic and prostate cancer—together constitute more than 50% of annual cancer diagnoses (1). The etiologies of these cancers are complex and associated heritability estimates (2) from twin studies range between 0.15 (colon) and 0.57 (prostate), indicating genetic components. For pancreatic cancer, data have been too sparse to estimate heritability based on twin studies. However, Mucci and colleagues (2) did observe significant, albeit lower relative to other cancers, familial risks for pancreatic cancer. These results are supported by a meta-analysis based on more than 6,500 cases, where having a relative diagnosed with pancreatic cancer was associated with a 1.8-fold (95% CI: 1.5-2.1) risk increase of pancreatic cancer (3).
Various cancers share both environmental and genetic risk factors including rare high-penetrant mutations in genes such as BRCA2 which predisposes to breast, ovarian, lung, prostate and pancreatic cancers (4). Genome-wide association studies (GWAS) have identified more 350 distinct (reported SNPs > 500kb apart) genomic regions that are associated with cancer (5) of which several are shared between cancer types (6). For example, the 8q24 (7-9) and TERT (10-13) regions have been associated with multiple cancer types (pleiotropy), although specific alleles often differ. In contrast to pleiotropy, which does not take the direction of association into account, genetic correlation describes the genome-wide correlation in allele effects and thus, considers the allele-specific direction of association between two traits. Thus, the shared genetic etiology between two traits can be either due to a shared genetic variant (or variants) with non-equal non-zero effect sizes (pleiotropy) or via a correlation between effect sizes for causal variants (genetic correlation) (14). Identifying genetic regions that are associated with multiple cancer types may be useful for determining mechanisms involved in global carcinogenesis. However, the benefit of simultaneously studying multiple cancer types relies on their genetic correlation.
approach to estimate ℎ𝑔2 for 12 cancers and found significant non-zero genetic contribution for
eight of them. However, their average sample size for each cancer was only 1,793 cases (range: 564-2,848) and 2,200 controls (range: 574-3,159), leading to imprecise heritability estimates. Sampson and colleagues (20) estimated the genetic correlation across 13 different cancers in an average sample size across cancers of 3,807 (range: 535-5,942) cases and 2,625 (range: 1,056-10,857) controls. Although no genetic correlation withstood multiple testing after adjusting for 91 tests, they observed the strongest genetic correlations (all p<0.01) between kidney and testis cancer (rg=0.73, SE=0.28), diffuse large B-cell lymphoma and osteosarcoma (rg=0.53, SE=0.21), diffuse large B-cell lymphoma and chronic lymphocytic leukemia (rg=0.51, SE=0.18), and bladder and lung (rg=0.35, SE=0.14) cancer.
MATERIAL AND METHODS
The GAME-ON network of consortia for post-GWA research, PanScan and GECCO
We utilized three large-scale cancer genetic epidemiological consortia: GAME-ON, PanScan III and GECCO. The Genetic Associations and Mechanisms in Oncology (GAME-ON) consortia is a network of cancer-specific post-GWAS initiatives. The five GAME-ON sites are breast (DRIVE), colorectal (CORECT), lung (TRICL-ILLCO), ovarian (FOCI) and prostate (ELLIPSE) (23). One of the main goals with GAME-ON was to test hypotheses across the cancer types that might illuminate common mechanisms of susceptibility. PanScan is a part of The Pancreatic Cancer Cohort Consortium with the goal of conducting GWAS to identify susceptibility markers for pancreatic cancer. For this study, we utilized genome-wide summary statistics from PanScan III (24). The Genetic Epidemiology of Colorectal Cancer Consortium (GECCO) is a large collaborative consortium evaluating genetic and environmental risk factors for colorectal cancer (25). Details of GAME-ON, PanScan, GECCO and the participating studies are available at http://epi.grants.cancer.gov/gameon/, http://epi.grants.cancer.gov/PanScan/ and https://www.fr edhutch.org/en/labs/phs/projects/cancer-prevention/projects/gecco.html. Sample sizes for each cancer is listed in Table 1. These studies have been described in detail previously (23). For each cancer type, genotyping was performed using Illumina or Affymetrix arrays of varying densities described elsewhere (23,26,27). For all studies except GECCO, imputation was performed using the 1,000 Genomes Project Phase 1 version 3 reference haplotypes, resulting in up to ~10 million SNPs available for the analysis for each cancer type. For GECCO, data was imputed using an in-house reference panel of 2,159 whole-genome sequenced European-ancestry GECCO participants (28). Since imputation quality scores were not readily accessible across all GWAS, we only included HapMap 3 SNPs as a proxy for well-imputed SNPs (29).
NON-CANCER TRAITS
fasting serum glucose, triglycerides, LDL cholesterol and HDL cholesterol. The average sample size for the non-cancer traits was 70,488 subjects.
STATISTICAL METHODS
Associations between SNPs and cancer risk were estimated by unconditional logistic regression adjusted for age, sex (when applicable), and top principal components (ranging from two to six across contributing GWAS) to adjust for potential population stratification. We used a newly developed method for estimating heritability due to common SNPs and genetic correlations that employs only summary statistics together with linkage disequilibrium (LD) information from a reference panel (21,22). This method, known as LD score regression, relies on the fact that SNP-specific association statistics reflect the associations of all SNPs in LD with that SNP. Thus, for a polygenic trait, SNPs in high-LD regions will on average have higher χ2 statistics than SNPs in low-LD regions and similarly, for two polygenic, genetically correlated traits with z-scores z1 and
z2, the product z1z2 will on average be higher for SNPs with high LD than SNPs with low LD. Formally, the relationship between the expected χ2 statistic for SNP j and the LD score 𝑙(𝑗) for SNP j can be described by 𝐸[𝜒𝑗2]≈𝑁𝑗ℎ𝑔
2
𝑀 𝑙𝑗 + 1, where 𝑁j is the sample size, ℎ𝑔2 is the heritability
due to included SNPs, M is the number of SNPs and 𝑙(𝑗) ≔∑𝑘𝑟2(𝑗, 𝑘) where 𝑟2(𝑗, 𝑘) is the correlation between SNP j and all other SNPs i. Since the observed SNP heritability estimates for binary traits are not directly comparable to more traditional estimates of heritability (e.g. from twin studies), we transformed the observed heritability to the liability scale which takes both ascertainment and disease prevalence into account as previously described (30). To obtain estimates of cancer-specific prevalence, we used SEER cumulative risks(31). We can extend the calculations of single-trait heritability to include two traits: 𝐸[𝑧1𝑗𝑧2𝑗] =√𝑁1𝑀𝑁2𝑟𝑔𝑙𝑗+𝑁𝑁𝑠𝜌
1𝑁2, where
RESULTS
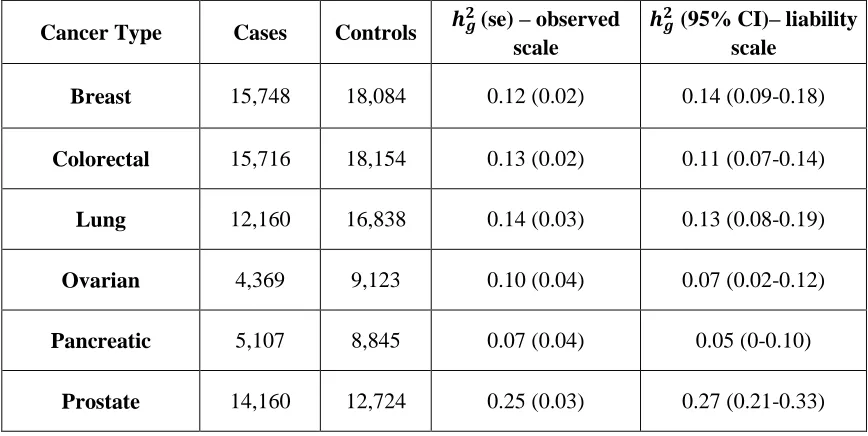
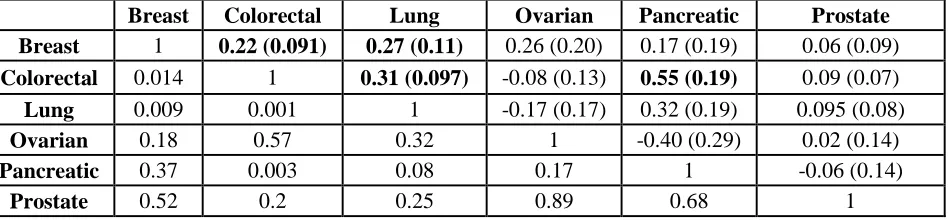
Cancer-specific GWAS summary statistics from data of 66,958 case and 70,665 control subjects across six cancer types were shared between the cancer sites. We first estimated the heritability due to common SNPs (ℎ𝑔2) on the observed and liability scale (Table 1) using cancer-specific cumulative risks (Supplementary Table S2) as reported in SEER (31). Heritability estimates on the liability scale ranged between 0.04 (pancreatic cancer) and 0.27 (prostate cancer). Using cross-trait LD score regression, we quantified the pair-wise genetic correlations between breast, colorectal, lung, ovarian, pancreatic and prostate cancer. A summary of the results is displayed as a 6x6 matrix (Table 2) with the estimated pair-wise genetic correlations and associated standard errors in the upper right corner of the matrix, and corresponding p-values for each genetic correlation can be seen in the lower left corner of the matrix. We found significant positive genetic correlations between pancreatic and colorectal cancer (rg=0.55, p=0.003), lung and colorectal cancer (rg=0.31, p=0.001), as well as suggestive positive genetic correlations between lung and breast cancer (rg=0.27, p=0.009), and colorectal and breast cancer (rg=0.22, p=0.01).
DISCUSSION
It is well known that cancer tends to cluster in families, which has been attributed to shared environmental factors and genetics (2). Many lifestyle factors associated with cancer including smoking, obesity and alcohol intake have been shown to influence risk of multiple cancer types, implying that different cancer types share an underlying biological mechanism. Similarly, genetic variation in genes such as BRCA1/2 and TERT has been associated with risks of multiple different cancer types, providing empirical support that there are specific regions in the genome that harbor genetic variation influencing risk of multiple cancer sites. However, although many cancer types might share susceptibility loci (i.e. pleiotropy), their genetic correlation, which depends on specific risk alleles and their direction of associations, might not be strong. Here, we aimed to assess the latter among six cancers, breast, colorectal, lung, ovary, pancreatic and prostate, as well as between cancer types and seven additional disease and seven non-disease traits that have all been found to have heritable components.
observed a small heritability (ℎ𝑔2=0.07, 95% CI: 0.02-0.12) compared to Lu and colleagues (19)
(ℎ𝑔2=0.30, 95% CI: 0.18-0.42). It is not clear why we observe this discrepancy in results. We also
observed lower ℎ𝑔2 of pancreatic cancer (0.05, 95% CI: 0-0.10) than previously observed (0.18,
95% CI: 0.06-0.30 for Lu and colleagues (19) and 0.10, 95% CI: 0.04-0.16 for Sampson et al (20)) but we note that the confidence intervals are wide and overlap. For prostate cancer, we observed a heritability of 0.27 (95% CI: 0.21-0.37) compared to Lu (19) (0.81, 95% CI: 0.32-1), and Sampson (20)(0.29, 95% CI: 0.15-0.42). We note that heritability estimates reported here are all on the liability scale and were calculated using SEER rates for all three studies including ours.
We found that colorectal cancer showed significant genetic correlations with pancreatic and lung cancers, with the largest genetic correlation observed for the two gastrointestinal tract cancers: the rg for colorectal and pancreatic cancer was 0.55 (p=0.003). Amundadottir and colleagues studied cancer risk for first up to fifth degree relatives in an Icelandic population and observed an increased risk for pancreatic cancer among colon cancer patients (and vice versa) for first degree relatives but not beyond (32). Colorectal cancer patients have been observed to have a higher incidence of pancreatic cancer than the general population (33). Further, Lynch syndrome, the most common hereditary colorectal cancer syndrome, has also been shown to increase risk for pancreatic cancer (34). Obesity is a well-established risk factor for both colorectal and pancreatic cancer (35,36) and we observed nominally significant (p<0.05) genetic correlations between BMI and both colorectal and pancreatic cancer.
Colorectal cancer also showed suggestive genetic correlation with breast cancer in agreement with the study from Amundadottir and colleagues (32). A recent study found that women diagnosed with breast cancer have a 1.59-fold (95% Confidence Interval (CI): 1.53-1.65) increased risk of developing colorectal cancer compared to the general population (37).
We expect these results to generate testable hypotheses about mechanisms. There are data to support inflammation response, DNA repair and stress responses, to list just a few. For example. the genetic correlations between breast, colorectal and lung cancer might be driven in part by genetic variants in the inflammation pathway. Indeed, a recent analysis of genetic variation in the inflammation pathway from the GAME-ON consortium identified SH2B3, a key negative regulator of cytokine signaling to be associated with all three cancers (41). Further, the authors found no evidence that genetic variation in inflammation-related genes was associated with prostate cancer risk. This observation corroborates our findings that prostate cancer does not share an appreciable genetic component with other cancers and supports inflammation to be a pathway in which genetic variation affects the risk of breast, colorectal and lung cancer. Removing all SNPs with a chi-square test statistic >25 in the individual cancer GWAS, did not change our results: Colorectal-breast cancer (rg=0.22 for all SNPs and rg=0.23 excluding significant SNPs); Colorectal-lung cancer (rg=0.31 for all SNPs and rg=0.34 excluding significant SNPs); Colorectal-pancreatic cancer (rg=0.55 for all SNPs and rg=0.58 excluding significant SNPs); Breast-lung cancer (rg=0.27 for all SNPs and rg=0.33 excluding significant SNPs). Thus, it is likely that the genetic correlations that we observe are due to yet unidentified SNPs, and future studies should focus on simultaneously study genetically correlated cancers with the goal of identifying SNPs that are associated with multiple cancer types.
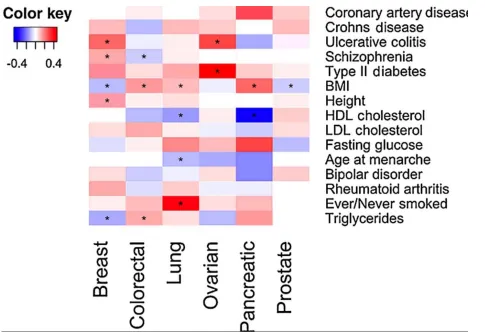
In addition, we examined the genetic correlation between these cancer types and 14 non-cancer diseases and traits. The only genetic correlation between cancer and non-cancer traits that withstood correction for multiple testing was smoking status and lung cancer. The strongest lung cancer susceptibility locus is in the 15q25 region which contains genes encoding the nicotinic acetylcholine receptor subunits CHRNA5, CHRNA3 and CHRNB4 and has also been associated with smoking behavior with associations in the same direction (43-45). We found that BMI showed nominally significant genetic correlations with all cancers except ovarian cancer. While BMI showed positive genetic correlation with colorectal, lung and pancreatic cancer, it showed negative genetic correlations with breast and prostate cancer. These results mirror recent Mendelian randomization (MR) studies of BMI and colorectal (46), breast and lung cancer (47,48), providing further evidence that obesity is involved in cancer development. An MR study of prostate cancer found a non-significant lower risk associated with a BMI genetic score (Odds ratio (OR)=0.98; 95% CI: 0.96-1.00; p = 0.07) (49). Although the positive genetic correlation between BMI and lung cancer seems to contradict results from observational studies, the observational association between BMI and lung cancer might be due to residual confounding by smoking (35). BMI and smoking behavior have been shown to share a genetic basis (rg=0.20, p=8.3x10⁻⁷) (22) and further, cell-type enrichment heritability analysis have shown that both smoking behavior and BMI are enriched for central nervous system (CNS)-related cell types. Therefore, it is possible that smoking and BMI to some extent affect lung cancer risk through the same biological mechanism.
Sampson and colleagues previously used individual-level GWAS data to estimate genetic correlations between 13 cancers in 49,492 cancer cases and 34,131 controls, including estrogen receptor negative (ER-) breast cancer, lung cancer, pancreatic and prostate cancer (20). Although, they did not observe the statistically significant genetic correlations between the cancers studied here, their standard errors were in general large, making it difficult to compare the results. We note that the ER- breast cancer and pancreatic datasets they used are a subset of the data analyzed here. While we had access to GWAS summary statistics based on cancer subtypes including ER- breast cancer, squamous cell lung cancer, lung adenocarcinoma, serous, clear cell and endometrioid ovarian cancer and aggressive prostate cancer, sample sizes for these subsets were too small for meaningful analysis. Based on our experience, LD score regression requires at least 10,000 cases for adequately stable estimates at these heritabilities. We note a few limitations with only having access to summary statistics data compared to individual-level data. Most importantly, the standard errors associated with the estimated genetic correlations based on LD score regression are larger than what is obtained by similar methods using individual-level data. In addition, we are not able to conduct any subtype analysis on the original traits that might be of interest, for example, it might have been of interest to study the genetic correlation between BMI and breast cancer stratified by menopausal status. LD score regression leverages summary statistics rather than individual-level data and thereby overcome many of the issues associated with relying on individual-level data. Moreover, appropriate QC steps were conducted as part of the cancer-specific GWAS meta-analysis. Further, we limited our analysis to HapMap 3 SNPs to ensure well-imputed data.
ACKNOWLEDGEMENTS
Members of CORECT
CORECT acknowledges the following investigators: Kendra Blalock, Peter T. Campbell, Graham Casey, David V. Conti, Christopher K. Edlund, Jane Figueiredo, W. James Gauderman, Jian Gong, Roger C. Green, Stephen B. Gruber, John F. Harju, Tabitha A. Harrison, Eric J. Jacobs, Mark A. Jenkins, Shuo Jiao, Li Li, Yi Lin, Frank J. Manion, Victor Moreno, Bhramar Mukherjee, Ulrike Peters, Leon Raskin, Fredrick R. Schumacher, Daniela Seminara, Gianluca Severi, Stephanie L. Stenzel, and Duncan C. Thomas.
Members of DRIVE
DRIVE acknowledges the following GWASs and investigators that shared genome-wide summary data as part of the breast-cancer GWAS meta-analysis: the Australian Breast Cancer Family Study (ABCFS) (John L. Hopper, Melissa C. Southey, Enes Makalic, Daniel F. Schmidt), the British Breast Cancer Study (BBCS) (Olivia Fletcher, Julian Peto, Lorna Gibson, Isabel dos Santos Silva), the Breast and Prostate Cancer Cohort Consortium (BPC3) (David J. Hunter, Sara Lindström, Peter Kraft), the Breast Cancer Family Registries (BCFR) (Habib Ahsan, Alice Whittemore), the Dutch Familial Bilateral Breast Cancer Study (DFBBCS) (Quinten Waisfisz, Hanne Meijers-Heijboer, Muriel Adank, Rob B. van der Luijt, Andre G. Uitterlinden, Albert Hofman), German Consortium for Hereditary Breast and Ovarian Cancer (GC-HBOC) (Alfons Meindl, Rita K. Schmutzler, Bertram Müller-Myhsok, Peter Lichtner), the Helsinki Breast Cancer Study (HEBCS) (Heli Nevanlinna, Taru A. Muranen, Kristiina Aittomäki, Carl Blomqvist), the Mammary Carcinoma Risk Factor Investigation (MARIE) (Jenny Chang-Claude, Rebecca Hein, Norbert Dahmen, Lars Beckman), SardiNIA (Laura Crisponi), the Singapore and Sweden Breast Cancer Study (SASBAC) (Per Hall, Kamila Czene, Astrid Irwanto, Jianjun Liu), and the UK2 (Douglas F. Easton, Clare Turnbull, Nazneen Rahman).
Members of ELLIPSE
ELLIPSE acknowledges the following GWASs and investigators that shared genome-wide summary data as part of the prostate cancer GWAS meta-analysis: CRUK (Rosalind Eeles, Douglas F. Easton, Zsofia Kote-Jarai, Kenneth Muir, Graham Giles, Gianluca Severi, David Neal, Jenny L. Donovan, Freddie C. Hamdy), CAPS1 and CAPS2 (Fredrik Wiklund, Henrik Gronberg), BPC3-MEC (Christopher Haiman, Fred Schumacher), BPC3-EPIC (Ruth Travis, Elio Riboli), BPC3-Harvard (Peter Kraft, David Hunter), BPC3-ACS (Susan Gapstur), PEGASUS (Sonja Berndt, Stephen Chanock).
Members of TRICL
TRICL acknowledges the following investigators: Younghun Han, Li Su, Yongyue Wei, Rayjean J. Hung, Yonathan Brhane, John McLaughlin, Paul Brennan, James D. McKay, Heike Bickeböller, Albert Rosenberger, Richard S. Houlston, Neil Caporaso, Maria Teresa Landi, Joachim Heinrich, Angela Risch, Xifeng Wu, Yuanqing Ye, David C. Christiani, Christopher I. Amos.
ASTERISK: We are very grateful to Dr. Bruno Buecher without whom this project would not have existed. We also thank all those who agreed to participate in this study, including the patients and the healthy control persons, as well as all the physicians, technicians and students.
DACHS: We thank all participants and cooperating clinicians, and Ute Handte-Daub, Utz Benscheid, Muhabbet Celik and Ursula Eilber for excellent technical assistance.
GECCO: The authors would like to thank all those at the GECCO Coordinating Center for helping bring together the data and people that made this project possible. The authors acknowledge Dave Duggan and team members at TGEN (Translational Genomics Research Institute), the Broad Institute, and the Génome Québec Innovation Center for genotyping DNA samples of cases and controls, and for scientific input for GECCO.
HPFS, NHS and PHS: We would like to thank the participants and staff of the Nurses' Health Study and the Health Professionals Follow-Up Study, for their valuable contributions as well as the following state cancer registries for their help: AL, AZ, AR, CA, CO, CT, DE, FL, GA, ID, IL, IN, IA, KY, LA, ME, MD, MA, MI, NE, NH, NJ, NY, NC, ND, OH, OK, OR, PA, RI, SC, TN, TX, VA, WA, WY. The authors assume full responsibility for analyses and interpretation of these data.
PLCO: The authors thank Drs. Christine Berg and Philip Prorok, Division of Cancer Prevention, National Cancer Institute, the Screening Center investigators and staff or the Prostate, Lung, Colorectal, and Ovarian (PLCO) Cancer Screening Trial, Mr. Tom Riley and staff, Information Management Services, Inc., Ms. Barbara O’Brien and staff, Westat, Inc., and Drs. Bill Kopp and staff, SAIC-Frederick. Most importantly, we acknowledge the study participants for their contributions to making this study possible. The statements contained herein are solely those of the authors and do not represent or imply concurrence or endorsement by NCI.
PMH: The authors would like to thank the study participants and staff of the Hormones and Colon Cancer study.
WHI: The authors thank the WHI investigators and staff for their dedication, and the study participants for making the program possible. A full listing of WHI investigators can be found
REFERENCES
1. Siegel RL, Miller KD, Jemal A. Cancer Statistics, 2017. CA: a cancer journal for clinicians 2017;67:7-30
2. Mucci LA, Hjelmborg JB, Harris JR, Czene K, Havelick DJ, Scheike T, et al. Familial Risk and Heritability of Cancer Among Twins in Nordic Countries. JAMA 2016 ;315:68-76
3. Permuth-Wey J, Egan KM. Family history is a significant risk factor for pancreatic cancer: results from a systematic review and meta-analysis. Fam Cancer 2009;8:109-17 4. Maxwell KN, Domchek SM. Cancer treatment according to BRCA1 and BRCA2
mutations. Nature reviews Clinical oncology 2012;9:520-8
5. April 11. The NHGRI-EBI Catalog of published genome-wide association studies. <https://www.ebi.ac.uk/gwas/>. Accessed 2017 April 11.
6. Sakoda LC, Jorgenson E, Witte JS. Turning of COGS moves forward findings for hormonally mediated cancers. Nature genetics 2013;45:345-8
7. Park SL, Fesinmeyer MD, Timofeeva M, Caberto CP, Kocarnik JM, Han Y, et al.
Pleiotropic associations of risk variants identified for other cancers with lung cancer risk: the PAGE and TRICL consortia. J Natl Cancer Inst 2014;106:dju061
8. Witte JS. Multiple prostate cancer risk variants on 8q24. Nature genetics 2007;39:579-80 9. Wokolorczyk D, Gliniewicz B, Sikorski A, Zlowocka E, Masojc B, Debniak T, et al. A
range of cancers is associated with the rs6983267 marker on chromosome 8. Cancer research 2008;68:9982-6
10. Bojesen SE, Pooley KA, Johnatty SE, Beesley J, Michailidou K, Tyrer JP, et al. Multiple independent variants at the TERT locus are associated with telomere length and risks of breast and ovarian cancer. Nature genetics 2013;45:371-84, 84e1-2
11. McKay JD, Hung RJ, Gaborieau V, Boffetta P, Chabrier A, Byrnes G, et al. Lung cancer susceptibility locus at 5p15.33. Nature genetics 2008;40:1404-6
12. Rafnar T, Sulem P, Stacey SN, Geller F, Gudmundsson J, Sigurdsson A, et al. Sequence variants at the TERT-CLPTM1L locus associate with many cancer types. Nature genetics 2009;41:221-7
13. Yin J, Li Y, Yin M, Sun J, Liu L, Qin Q, et al. TERT-CLPTM1L polymorphism rs401681 contributes to cancers risk: evidence from a meta-analysis based on 29 publications. PloS one 2012;7:e50650
14. Pasaniuc B, Price AL. Dissecting the genetics of complex traits using summary association statistics. Nat Rev Genet 2017;18:117-27
15. Lee SH, Wray NR, Goddard ME, Visscher PM. Estimating missing heritability for disease from genome-wide association studies. American journal of human genetics 2011;88:294-305
16. Yang J, Benyamin B, McEvoy BP, Gordon S, Henders AK, Nyholt DR, et al. Common SNPs explain a large proportion of the heritability for human height. Nature genetics 2010;42:565-9
17. Yang J, Manolio TA, Pasquale LR, Boerwinkle E, Caporaso N, Cunningham JM, et al.
18. Cross-Disorder Group of the Psychiatric Genomics C, Lee SH, Ripke S, Neale BM, Faraone SV, Purcell SM, et al. Genetic relationship between five psychiatric disorders estimated from genome-wide SNPs. Nature genetics 2013;45:984-94
19. Lu Y, Ek WE, Whiteman D, Vaughan TL, Spurdle AB, Easton DF, et al. Most common 'sporadic' cancers have a significant germline genetic component. Human molecular genetics 2014;23:6112-8
20. Sampson JN, Wheeler WA, Yeager M, Panagiotou O, Wang Z, Berndt SI, et al. Analysis of Heritability and Shared Heritability Based on Genome-Wide Association Studies for Thirteen Cancer Types. J Natl Cancer Inst 2015;107:djv279
21. Bulik-Sullivan BK, Loh PR, Finucane HK, Ripke S, Yang J, Schizophrenia Working Group of the Psychiatric Genomics C, et al. LD Score regression distinguishes confounding from polygenicity in genome-wide association studies. Nature genetics 2015;47:291-5
22. Bulik-Sullivan B, Finucane HK, Anttila V, Gusev A, Day FR, Loh PR, et al. An atlas of genetic correlations across human diseases and traits. Nature genetics 2015;47:1236-41 23. Fehringer G, Kraft P, Pharoah PD, Eeles RA, Chatterjee N, Schumacher FR, et al.
Cross-cancer genome-wide analysis of lung, ovary, breast, prostate and colorectal Cross-cancer reveals novel pleiotropic associations. Cancer research 2016
24. Wolpin BM, Rizzato C, Kraft P, Kooperberg C, Petersen GM, Wang Z, et al. Genome-wide association study identifies multiple susceptibility loci for pancreatic cancer. Nature genetics 2014;46:994-1000
25. Peters U, Jiao S, Schumacher FR, Hutter CM, Aragaki AK, Baron JA, et al. Identification of Genetic Susceptibility Loci for Colorectal Tumors in a Genome-Wide Meta-analysis. Gastroenterology 2013;144:799-807 e24
26. Kaminski B.M. ACI, DeRycke E., Gillanders E.M., Gruber S.B., Henderson B.E., Hunter D.J., Lepage P.K., Sellers T.A., Seminara D. Genetic Associations and Mechanisms in Oncology (GAME-ON): A network approach to post-GWAS research. Cancer Epidemiol Biomarkers Prev 2013;21:78-
27. Zhang C, Doherty JA, Burgess S, Hung RJ, Lindstrom S, Kraft P, et al. Genetic determinants of telomere length and risk of common cancers: a Mendelian randomization study. Human molecular genetics 2015
28. Jeroen Huyghe SC, Hyun M. Kang, Tabitha A. Harrison, Sonja I. Berndt, Stephane Bézieau, Hermann Brenner, Graham Casey, Andrew T. Chan, Jenny Chang-Claude, Gallinger J. Steven, Stephen B. Gruber, Andrea Gsur, Michael Hoffmeister, Thomas J. Hudson, Loic Le Marchand, Polly A. Newcomb, John D. Potter, Conghui Qu, Martha L. Slattery, Joshua D. Smith, Emily White, Li Hsu, Goncalo R. Abecasis, Deborah A. Nickerson, Ulrike Peters. Large scale whole genome sequencing with imputation into GWAS improves our understanding of the genetic architecture of colorectal cancer. American Association of Cancer Research Annual Meeting 2016. New Orleans, LA2016. 29. Finucane HK, Bulik-Sullivan B, Gusev A, Trynka G, Reshef Y, Loh PR, et al.
Partitioning heritability by functional annotation using genome-wide association summary statistics. Nature genetics 2015;47:1228-35
30. Zaitlen N, Kraft P. Heritability in the genome-wide association era. Hum Genet 2012;131:1655-64
31. April 14. 2017. Lifetime Risk (Percent) of being diagnosed with Cancer by Site and
<https://seer.cancer.gov/csr/1975_2014/results_merged/topic_lifetime_risk.pdf>. April 14. 2017.
32. Amundadottir LT, Thorvaldsson S, Gudbjartsson DF, Sulem P, Kristjansson K, Arnason S, et al. Cancer as a complex phenotype: pattern of cancer distribution within and beyond the nuclear family. PLoS Med 2004;1:e65
33. Rahimi E, Batra S, Thosani N, Singh H, Guha S. Increased Incidence of Second Primary Pancreatic Cancer in Patients with Prior Colorectal Cancer: A Population-Based US Study. Dig Dis Sci 2016;61:1652-60
34. Underhill ML, Germansky KA, Yurgelun MB. Advances in Hereditary Colorectal and Pancreatic Cancers. Clin Ther 2016
35. Bhaskaran K, Douglas I, Forbes H, dos-Santos-Silva I, Leon DA, Smeeth L. Body-mass index and risk of 22 specific cancers: a population-based cohort study of 5.24 million UK adults. Lancet 2014;384:755-65
36. Renehan AG, Tyson M, Egger M, Heller RF, Zwahlen M. Body-mass index and incidence of cancer: a systematic review and meta-analysis of prospective observational studies. Lancet 2008;371:569-78
37. Lu Y, Segelman J, Nordgren A, Lindstrom L, Frisell J, Martling A. Increased risk of colorectal cancer in patients diagnosed with breast cancer in women. Cancer Epidemiol 2016;41:57-62
38. Dite GS, Whittemore AS, Knight JA, John EM, Milne RL, Andrulis IL, et al. Increased cancer risks for relatives of very early-onset breast cancer cases with and without BRCA1 and BRCA2 mutations. Br J Cancer 2010;103:1103-8
39. Gorlova OY, Weng SF, Zhang Y, Amos CI, Spitz MR. Aggregation of cancer among relatives of never-smoking lung cancer patients. Int J Cancer 2007;121:111-8
40. Wang Y, McKay JD, Rafnar T, Wang Z, Timofeeva MN, Broderick P, et al. Rare variants of large effect in BRCA2 and CHEK2 affect risk of lung cancer. Nature genetics 2014;46:736-41
41. Hung RJ, Ulrich CM, Goode EL, Brhane Y, Muir K, Chan AT, et al. Cross Cancer Genomic Investigation of Inflammation Pathway for Five Common Cancers: Lung, Ovary, Prostate, Breast, and Colorectal Cancer. J Natl Cancer Inst 2015;107
42. Witte JS, Hoffmann TJ. Polygenic modeling of genome-wide association studies: an application to prostate and breast cancer. OMICS 2011;15:393-8
43. Amos CI, Wu X, Broderick P, Gorlov IP, Gu J, Eisen T, et al. Genome-wide association scan of tag SNPs identifies a susceptibility locus for lung cancer at 15q25.1. Nature genetics 2008;40:616-22
44. Hung RJ, McKay JD, Gaborieau V, Boffetta P, Hashibe M, Zaridze D, et al. A susceptibility locus for lung cancer maps to nicotinic acetylcholine receptor subunit genes on 15q25. Nature 2008;452:633-7
45. Saccone NL, Culverhouse RC, Schwantes-An TH, Cannon DS, Chen X, Cichon S, et al.
Multiple independent loci at chromosome 15q25.1 affect smoking quantity: a meta-analysis and comparison with lung cancer and COPD. PLoS Genet 2010;6
47. Carreras-Torres R, Haycock PC, Relton CL, Martin RM, Smith GD, Kraft P, et al. The causal relevance of body mass index in different histological types of lung cancer: A Mendelian randomization study. Sci Rep 2016;6:31121
48. Gao C, Patel CJ, Michailidou K, Peters U, Gong J, Schildkraut J, et al. Mendelian randomization study of adiposity-related traits and risk of breast, ovarian, prostate, lung and colorectal cancer. Int J Epidemiol 2016;45:896-908
49. Davies NM, Gaunt TR, Lewis SJ, Holly J, Donovan JL, Hamdy FC, et al. The effects of height and BMI on prostate cancer incidence and mortality: a Mendelian randomization study in 20,848 cases and 20,214 controls from the PRACTICAL consortium. Cancer Causes Control 2015;26:1603-16
50. Fall K, Garmo H, Gudbjornsdottir S, Stattin P, Zethelius B. Diabetes mellitus and prostate cancer risk; a nationwide case-control study within PCBaSe Sweden. Cancer epidemiology, biomarkers & prevention : a publication of the American Association for Cancer Research, cosponsored by the American Society of Preventive Oncology 2013;22:1102-9
51. Gong Z, Neuhouser ML, Goodman PJ, Albanes D, Chi C, Hsing AW, et al. Obesity, diabetes, and risk of prostate cancer: results from the prostate cancer prevention trial. Cancer epidemiology, biomarkers & prevention : a publication of the American Association for Cancer Research, cosponsored by the American Society of Preventive Oncology 2006;15:1977-83
52. Tsilidis KK, Allen NE, Appleby PN, Rohrmann S, Nothlings U, Arriola L, et al. Diabetes mellitus and risk of prostate cancer in the European Prospective Investigation into Cancer and Nutrition. Int J Cancer 2015;136:372-81
53. Waters KM, Henderson BE, Stram DO, Wan P, Kolonel LN, Haiman CA. Association of diabetes with prostate cancer risk in the multiethnic cohort. Am J Epidemiol 2009;169:937-45
54. Machiela MJ, Lindstrom S, Allen NE, Haiman CA, Albanes D, Barricarte A, et al.
Association of type 2 diabetes susceptibility variants with advanced prostate cancer risk in the Breast and Prostate Cancer Cohort Consortium. Am J Epidemiol 2012;176:1121-9 55. Hemminki K, Li X, Sundquist J, Sundquist K. Cancer risks in ulcerative colitis patients.
Int J Cancer 2008;123:1417-21
56. Catala-Lopez F, Suarez-Pinilla M, Suarez-Pinilla P, Valderas JM, Gomez-Beneyto M, Martinez S, et al. Inverse and direct cancer comorbidity in people with central nervous system disorders: a meta-analysis of cancer incidence in 577,013 participants of 50 observational studies. Psychother Psychosom 2014;83:89-105
57. Zhang B, Shu XO, Delahanty RJ, Zeng C, Michailidou K, Bolla MK, et al. Height and Breast Cancer Risk: Evidence From Prospective Studies and Mendelian Randomization. J Natl Cancer Inst 2015;107
58. Ni H, Liu H, Gao R. Serum Lipids and Breast Cancer Risk: A Meta-Analysis of Prospective Cohort Studies. PloS one 2015;10:e0142669
59. Chandler PD, Song Y, Lin J, Zhang S, Sesso HD, Mora S, et al. Lipid biomarkers and long-term risk of cancer in the Women's Health Study. Am J Clin Nutr 2016 ;103:1397-407
61. Lee JY, Jeon I, Kim JW, Song YS, Yoon JM, Park SM. Diabetes mellitus and ovarian cancer risk: a systematic review and meta-analysis of observational studies. Int J Gynecol Cancer 2013;23:402-12
Table 1: Overview of cancers analyzed. Number of subjects, observed heritability (standard error) and heritability (95% CI) on the liability scale explained by studied SNPs for each cancer. Cumulative risks used for calculating ℎ𝑔2on the liability scale were obtained from SEER.
Cancer Type Cases Controls 𝒉𝒈
𝟐(se) – observed
scale
𝒉𝒈𝟐 (95% CI)– liability scale
Breast 15,748 18,084 0.12 (0.02) 0.14 (0.09-0.18)
Colorectal 15,716 18,154 0.13 (0.02) 0.11 (0.07-0.14)
Lung 12,160 16,838 0.14 (0.03) 0.13 (0.08-0.19)
Ovarian 4,369 9,123 0.10 (0.04) 0.07 (0.02-0.12)
Pancreatic 5,107 8,845 0.07 (0.04) 0.05 (0-0.10)
Prostate 14,160 12,724 0.25 (0.03) 0.27 (0.21-0.33)
Table 2:Genetic correlations between cancers. Genetic correlations with standard errors are in the upper right part of the table, corresponding p-values are in the lower left part of the table.
Breast Colorectal Lung Ovarian Pancreatic Prostate
Breast 1 0.22 (0.091) 0.27 (0.11) 0.26 (0.20) 0.17 (0.19) 0.06 (0.09)
Colorectal 0.014 1 0.31 (0.097) -0.08 (0.13) 0.55 (0.19) 0.09 (0.07)
Lung 0.009 0.001 1 -0.17 (0.17) 0.32 (0.19) 0.095 (0.08)
Ovarian 0.18 0.57 0.32 1 -0.40 (0.29) 0.02 (0.14)
Pancreatic 0.37 0.003 0.08 0.17 1 -0.06 (0.14)
Table 3:Nominally significant genetic correlations between cancers and non-cancer traits. For each cancer-trait genetic correlation observed, current evidence from observational studies and corresponding reference are also listed. P values are not corrected for multiple testing.
Cancer Non-cancer
trait rg se p
Epidemiological
observations Reference
Breast Cancer Ulcerative
Colitis 0.243 0.08 0.002 + (55)
Breast cancer Schizophrenia 0.142 0.049 0.004 + (56)
Breast cancer Height 0.143 0.055 0.01 + (57)
Breast cancer Triglycerides -0.13 0.061 0.033 - (58)
Breast cancer BMI -0.112 0.053 0.035
- (premenopausal)
+ (postmenopausal)
(35)
Colorectal
cancer BMI 0.157 0.046 6.22E-04 + (35)
Colorectal
cancer Triglycerides 0.126 0.058 0.029 + (59)
Colorectal
cancer Schizophrenia -0.091 0.046 0.048 No association (56)
Lung cancer Ever/Never
Smoked 0.412 0.084 1.03E-06 + (60)
Lung cancer HDL -0.151 0.063 0.017 - (59)
Lung cancer BMI 0.116 0.054 0.032
- (smokers)
No association (non-smokers)
(35)
Ovarian cancer Type-2
Diabetes 0.469 0.191 0.014 + (61)
Ovarian cancer Ulcerative
Colitis 0.291 0.137 0.034 No association (55)
Pancreatic
cancer HDL -0.405 0.167 0.015 Unknown N/A
Pancreatic
cancer BMI 0.243 0.117 0.038 + (35)