Cyclone-generated Storm Surge in the Northern Gulf of
Oman: A Field Data Analysis during Cyclone Gonu
Mohammad Nabi Allahdadi1,*, Nazanin Chaichitehrani2, Felix Jose3,
Ali Nasrollahi4, Amin Afshar4, Mohammadreza Allahyar5
1Department of Marine, Earth and Atmospheric Sciences, North Carolina State University, Raleigh, NC, USA 2College of the Coasts and Environment, Louisiana State University, Baton Rouge, LA, USA 3Department of Marine and Ecological Sciences, Florida Gulf Coast University, Fort Meyers, FL, USA
4Marine Engineering Group, N.F.T Company, Tehran, Iran 5Port and Maritime Organization, Tehran, Iran
Abstract
Water level measurements at four stations from Chabahar Bay, Iran, have been analyzed to investigate the storm surge induced by Cyclone Gonu in June 2007. Water level data include semi-diurnal tidal variations and sub-tidal frequency variations induced by atmospheric forcing. A low-pass filter with a cut-off frequency of 30 hours was used to deduce the storm surge induced by Gonu from the total measured water level. Results show that at all four stations, a maximum water level rise of about 0.4 m was produced by the cyclone at the time that Gonu’s eye was in the Gulf of Oman closest to Chabahar Bay. Low atmospheric pressure and wind shear, major mechanisms for storm surge generation, were examined to determine the contribution from each to the observed water level rise. Pressure maps over the Gulf of Oman and northern Arabian Sea showed that more than 75% of the storm surge at Chabahar was produced by low atmospheric pressure and the rest was attributed to wind shear. This is consistent with the wind-induced surge calculation based on an analytical model suggested by Harris (1959). The large distance between the Gonu’s eye and Chabahar Bay, the steep shelf slope off Chabahar Bay, and the negative interaction between storm surge and coastally trapped waves could have contributed to the relatively small storm surge in Chabahar Bay.Keywords
Storm surge, Cyclone, Gonu, Chabahar Bay, Gulf of Oman1. Introduction
Water level in coastal areas changes as a result of both short- and long-term processes. Long-term changes in water level is produced by global variations such as decadal anomalies and climate change ([1, 2]). Short-term variations include elevation changes induced by the periodic phenomenon of astronomical tides or by storm-induced variations. Catastrophic events like tropical storms significantly contribute to the hydrodynamics and water level variations of bays, estuaries, and coastal areas ([3-7]). Effect of tropical storms, including hurricanes, cyclones, and typhoons, on coastal water levels can be catastrophic and disastrous ([8-11]). Hurricane Katrina, which impacted the northern Gulf of Mexico in late August 2005, is an example for extreme hurricane storm surge and its devastating impacts. Due to the flat bathymetry of the shelf in the eastern Mississippi River Delta, the intense winds of this category 3 hurricane produced a storm surge of more than 9 m that
* Corresponding author:
mallahd@ncsu.edu (Mohammad Nabi Allahdadi) Published online at http://journal.sapub.org/ajfd
Copyright © 2018 Scientific & Academic Publishing. All Rights Reserved
destroyed the upstream coastal area and caused substantial loss of life and destruction of properties ([11]).
Although cyclones frequently impact the northern Indian Ocean during the summer, they rarely enter the northern Arabian Sea and Gulf of Oman ([12-16]). Nevertheless, in early June 2007, the historic category 5 Cyclone Gonu traversed this area and caused loss of tens of lives and hundreds of millions of dollars in damages along the Oman and Iranian coasts (Figure 1; [12, 15]). The major part of these fatalities and damages were due to coastal flooding caused by the storm-induced surge ([12]). Understanding the mechanisms that contributed to the storm surge during cyclone events like Gonu in this region is imperative to minimize loss of life and destruction of coastal properties during cyclones in the future.
highest water mark that included the combined effect of storm surge and storm wave was about 5 m and occurred at the tip of Oman at Ras Al Hadd. Simulation of Gonu’s induced storm surge using the Advanced Circulation (ADCIRC) model showed that due to the steep bathymetry of this area, only 1.5 meters of the water mark was attributed to storm surge and the rest was due to storm waves. No direct measurement of storm surge was used to address storm surge generation from Gonu.
2. Study Area and Field Data
Water level was measured at the mouth and inside the Chabahar Bay as part of a modeling and monitoring project supported by the Iranian Port and Maritime Organization. The project included an extensive measurement of hydrodynamic parameters including water level, wave characteristics, and currents inside and outside Chabahar Bay. Water levels from four stations including AW1, AW2, AW3, and TG1 were used to deduce storm-induced water level variations (Figure 1b and Table 1).
Figure 1. a) Track of Cyclone Gonu in the northern Arabian Sea and Gulf of Oman. Numbers on the track represent the date and time of Gonu’s eye at each location in June 2007 (month/day: hour), b) Chabahar Bay in the northern Gulf of Oman and locations of measurement stations
a)
Table 1. Geographical coordinates and water depth of the stations used for water level analyses
Station Latitude Longitude Water depth(m) Location Name
AW1 25.289 60.594 11 Beheshti
AW2 25.261 60.650 30 Out of Bay
AW3 25.291 60.475 10 Bargin
TG1 25.349 60.594 4 Tiss
3. Historical Cyclone Gonu
Gonu is the strongest cyclone ever that has impacted the northern Arabian Sea and Gulf of Oman ([18]). On 1 June 2007, favorable upper level atmospheric conditions (i.e., small vertical wind shear) intensified the heat transfer from the warm sea surface to the atmosphere in the eastern Arabian Sea. As a result of this immense heat flux, by 5 June the pre-existing convection quickly developed into a cyclone as strong as a Category 5 hurricane, with a maximum sustained wind speed of 240 km/h ([18]). With a general northwestward track, the cyclone made its first landfall on the tip of Oman at Ras Al Hadd on 6 June (Figure 1). The final landfall was on the Makran coast of Iran about 150 kilometers east of the Persian Gulf ([18]). The satellite image of Gonu when its eye was located off the tip of Oman shows an extensive area over the northern Arabian Sea and Gulf of Omanis that was affected (Figure 2).
Figure 2. Satellite image of Cyclone Gonu at 5:30 on 5 June 2007 (image from the Joint Typhoon Warning Center (JTWC))
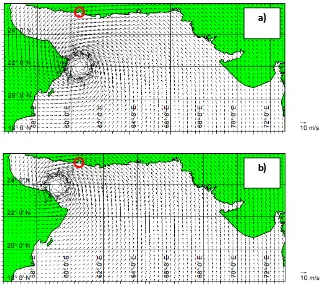
In order to further evaluate water level variations of storm surge produced by the cyclone, Gonu’s wind fields were generated using the parametric model suggested by Holland [19]. The model assumes that the cyclone is a single vortex and uses pressure in the center of the cyclone, neutral air pressure outside the cyclone, and the radius of maximum wind for the Cyclone to reconstruct wind speed and pressure fields induced by the cyclone. 𝑉𝑔(𝑟) and 𝑝(𝑟) denote the
wind speed and air pressure, respectively:
Figure 3. Snapshots of model-generated wind fields for Cyclone Gonu at (a) 18:00 on 5 June 2007 and (b) 11:00 on 6 June 2007. Red circles show the location of Chabahar Bay
𝑉𝑔(𝑟) = �(𝑝𝑛− 𝑝𝑐)𝜌𝐵𝐴�𝑅𝑚𝑤𝑟 � 𝐵
exp �−𝑅𝑚𝑤
𝑟 �
𝐵
+ �𝑟.𝑓2�2−𝑟|𝑓|2
(1)
𝑝(𝑟) = 𝑝𝑐+ (𝑝𝑛− 𝑝𝑐)𝑒𝑥𝑝 �−𝑅𝑚𝑤𝑟 � 𝐵
(2)
𝐵 = 2.0 − (𝑝𝑐− 900)/160 (3)
Here 𝑃𝑛 denotes neutral air pressure, 𝑃𝑐 is pressure at the
center of hurricane, 𝑅𝑚𝑤 is the radius of maximum wind, 𝑟
is the radial distance from the center of the hurricane, 𝑓 is Coriolis parameter, and 𝜌𝐴 is air density. The cyclone
generation module based on this formulation has been incorporated in the Mike 21 model ([20]) and was used for generating Gonu’s wind fields in the present study. Allahdadi et al [17] successfully used this approach to evaluate Gonu’s wind fields that was used for modeling of the waves generated by Gonu. Snapshots of the model-generated wind fields when the eye was located off the tip of Oman (Figure 3a) and in the Gulf of Oman midway between Oman and the Makran coast (Figure 3b) show that cyclone wind fields caused easterly to southeasterly wind in Chabahar Bay.
4. Field Data Analysis
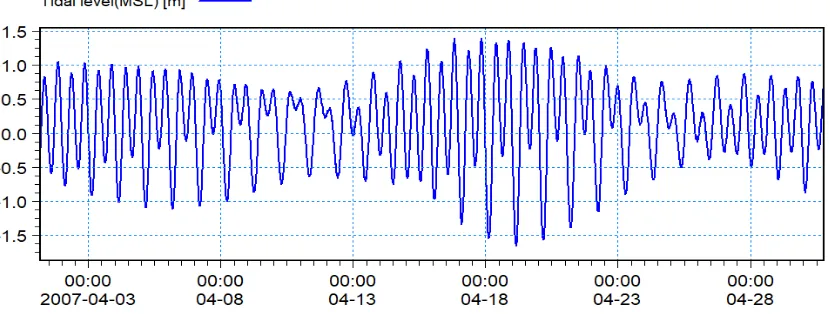
Water level at stations AW1, AW2, and AW3 was measured with frequency of 2 Hz using pressures sensors installed on ADCP instruments. At TG1, an RBR instrument was used with recording frequency of 1 Hz. Since the measurements were part of a year-long record in Chabahar Bay, water level data are available for before, during, and after Gonu. The Gulf of Oman, including Chabahar Bay, is characterized by relatively strong tides with average tidal range of about 2 m and a semi-diurnal time variation with period of about 12.4 hours ([21]). Figure 4 shows a month-long time series of water level data from station AW1 during April 2007; two months before Gonu occurred. During this time fair weather conditions prevailed over the northern Gulf of Oman.
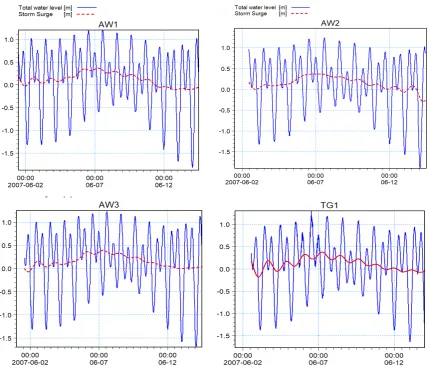
Considering the relatively large tidal range in Chabahar, in fair weather and even during storm, a large part of the recorded water level is due to tidal variations. Water level fluctuations induced by atmospheric events combines with tidal variations to produce the measured water level variations. In order to deduce the storm surge generated by Gonu at the measurement stations, the tidal component of water level should be separated from the total water level. This is done by spectral analysis of measured water level time series. This approach converts the time series into the frequency domain and separates the components of the desired frequency range. The period of the tidal signal is 12.4 hours, while the storm-induced water level has higher periods (lower frequency) due to the large-scale variations of atmospheric forces. The appropriate cut-off period for separating storm surge from tide is recommended in the range of 28-30 hours ([22]). In the present study, a cut-off period of 30 hours was used to run a low-pass filter on the measured water levels. The spectral analysis tool in Mike 21 was used for filtering. The low frequency part of the spectrum contains the storm surge component. After bringing the resulting low frequency part back to the time domain, the time series of storm surge for each station is obtained. The time series of Gonu-induced storm surge for all four stations are similar, with the maximum water level rise of about 0.35 - 0.38 m (Figure 5). This maximum sea level rise corresponds to the time that Gonu’s eye was located in the Gulf of Oman mid-way between the Oman and Iranian shorelines (see Figure 1). For each station, time series of measured water level and the corresponding deduced storm surge is presented for a two weeks duration - from 1 June to 13 June 2007. This period includes both spring and neap tides in the Gulf of Oman with the maximum non-storm water level rise (spring tide high water) of about 1 m (with respect to the mean sea level) between 2 and 3 June 2007. The maximum surge level coincided with the peak high water during the neap tide and resulted in a total water level higher than the spring tide maximum.
Figure 5. Time variations of measured total water level before, during (5-7 June), and after Cyclone Gonu impacted the Gulf of Oman, along with the deduced storm surge using spectral analysis at four stations in Chabahar Bay. Total water level (m) is shown by blue lines, and storm surge (m) is shown by red lines
Figure 6. Time series comparison of deduced storm surge from measurements at the four stations in Chabahar Bay
Time series of deduced storm surge data from all four stations show that maxima occurred during the early morning of 7 June 2017 (Figure 6). For all stations except
TG1, water level variations during the cyclone were mostly positive, showing rise in water level. For station TG1, significant drops in water level were deduced on 3 and 4 June. Because of the shallow depth of this station (4 m; see Table 1) negative surge could be due to the effect of local winds during the early stage of cyclone movement toward Chabahar Bay.
5. Discussion
During extreme atmospheric events like cyclones, two mechanisms contribute to water level change in impacted regions: changes in atmospheric pressure and the effect of wind friction on the water surface.
These two mechanisms producing storm surge in Chabahar Bay during Cyclone Gonu are discussed here.
5.1. Effect of Atmospheric Pressure Change
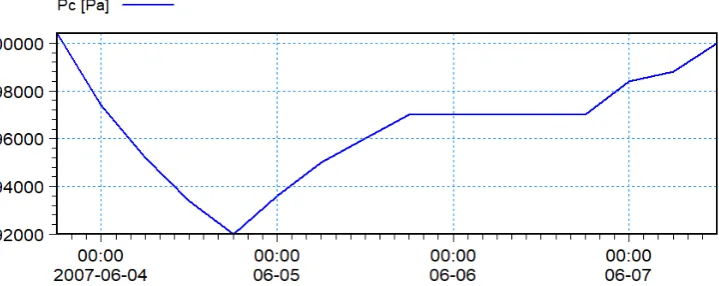
may drop to as low as 900 - 920 mbar ([23]). This extreme low pressure system significantly affects the atmospheric pressure of the surrounding areas. This negative atmospheric pressure itself causes the sea level to rise. Time variations of atmospheric pressure at the center of Cyclone Gonu, as obtained from JTWC, show that lowest central pressure of 92000 Pa (920 mbar) occurred when Gonu was approaching the tip of Oman.
While Gonu was traversing the Gulf of Oman (6 - 7 June), the recorded central pressure was 97000 Pa (970 mbar). The maximum storm surge at the four stations in the Chabahar Bay occurred towards the end of this period.
Elevation in sea level as a result of a drop in the neutral atmospheric pressure can be easily estimated by considering the pressure 𝑃 at the surface of a fluid column with density
𝜌 and depth ℎ in a static equilibrium:
𝑃 = 𝜌𝑔ℎ (4)
∆𝑃 = 𝜌𝑔∆ℎ (5)
where ∆𝑃 is the change in pressure, ∆ℎ is the corresponding change in water depth, and 𝑔 = 9.81 𝑚2/𝑠,
the acceleration due to gravity. By considering ∆𝑃 =1 mbar, and 𝜌 = 1000 𝑘𝑔/𝑚3, ∆ℎ is approximately 0.01 m.
Thus at a given location, 1 mbar change of atmospheric pressure will change the sea surface by as much as 0.01 m([26]).
During the passage of Cyclone Gonu, atmospheric pressure over the Arabian Sea and Gulf of Oman substantially decreased from neutral air pressure (Figure 8). During this time, atmospheric pressure over the Gulf of Oman and along the Iranian coasts decreased to about 97500 Pa (975 mbar). Over Chabahar Bay, the pressures on 5 and 7 June were 980 and 975 mbar, respectively. For the regions far from the cyclone’s effect, the pressure was about 1005 mbar, which was assumed to be the neutral air pressure for the Gulf of Oman and northern Arabian Sea. The 30 mbar pressure drop during the cyclone caused a 0.3 meter storm surge in Chabahar Bay. Of the maximum measured storm surge of 0.35 to 0.38 m, the remainder (0.05 – 0.08 m) would be due to wind shear.
5.2. Effect of Wind Friction
Intense wind speed produced by a cyclone can pile up water
against a land boundary through frictional coupling at the air-sea boundary. Specifically, over the shallow inner shelf waters and for the regions closer to the center of the cyclone, wind shear can be the major contributor in storm surge generation during a hurricane ([8]). Numerical models are extensively used for simulating the storm surge directly induced by the cyclone winds ([4], [8], and [9]).
However, based on analyses of field data and pressure fields, only a small part of the maximum storm surge can be attributed to the direct effect of storm winds. To elaborate more on the wind-induced storm surge in Chabahar, an analytical model with some simplifications of the equations of motion was used to estimate the wind-induced storm surge in Chabahar Bay. A one-dimensional form of the equation of motion in a non-rotational system and unbound sea were assumed ([24]). By assuming an equilibrium condition, the differential equation for the free surface slope under the effect of wind shear is represented as:
𝜕ℎ 𝜕𝑥=
𝜌𝑎 𝜌𝑤
𝛾2𝑉2
𝑔(𝐻+ℎ) (6)
where ℎ represents the water surface elevation, 𝑥 is the distance along which the water level slope is calculated (in this case along the wind direction), 𝜌𝑎 is the density of air, 𝜌𝑤 is the density of water, 𝛾2 is the wind stress coefficient
which is assumed to be 2 × 10⁻³, 𝑉 is the wind speed, and 𝐻 is the static water depth. For a specific wind event at a specific time, the equation for storm surge induced by wind is:
∆ℎ =𝜌𝑎 𝜌𝑤
𝛾2𝑉2
𝑔(𝐻+ℎ) ∆𝑥 (7)
During the peak cyclonic wind in Chabahar Bay, wind speed at station AW2 as obtained from the Holland (1980) model (see Figure 3) was 16.2 m/s. The direction of wind was nearly from the southeast, with the distance of persistent wind = 50 km. Water depth was assumed at 30 m, a conservative assumption that represents the depth only at AW2 (Figure 9). By applying equation 7 and the above-mentioned values, the maximum wind-induced storm surge at Chabahar Bay was 0.1 m. This value is consistent with the estimation from field data analyses, which is 0.05 – 0.08 m.
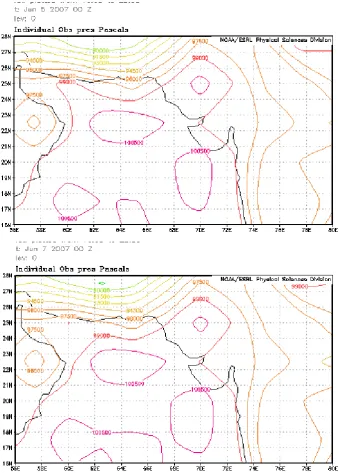
Figure 8. Examples of atmospheric pressure drop over the northern Arabian Sea and Gulf of Oman during Cyclone Gonu. Upper panel: 5 June 00:00; lower panel: 7 June 00:00 (maps were obtained from https://www.esrl.noaa.gov/psd/data/gridded/data.ncep.reanalysis.surface.html). Pressure unit is pascal
Several factors contributed to the relatively small wind-induced storm surge in Chabahar Bay. The main reason could be the distance from the cyclone’s eye to Chabahar Bay (~ 200 km, Allahdadi et al [17]). Moreover, the bathymetry of the continental shelf off Chabahar Bay is not favorable for generating large storm surge at the measurement stations. There is a relatively narrow shelf off Chabahar Bay, and in less than 15 km offshore, water depth reaches 90 m. Wind energy could be lost across the deep shelf water and cannot effectively contribute to raising the
water surface. Chabahar Bay being on the right side of the cyclone track may also contribute to lowering the generated storm surge inside the bay.
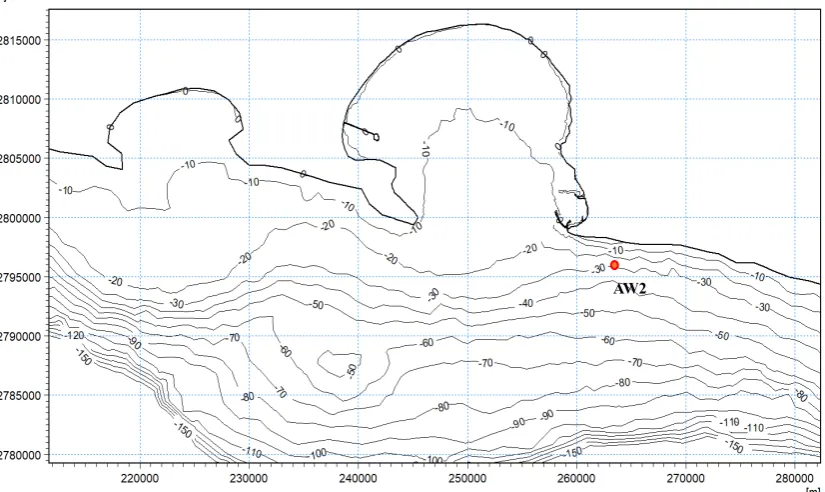
Figure 9. Water depths in and near Chabahar Bay. Station AW2 is marked. Coordinates are based on UTM 61 map projection
6. Summary and Conclusions
In this paper, the effect of tropical Cyclone Gonu on water level variations in Chabahar Bay on the northern coasts of the Gulf of Oman was investigated by examining measured water level at several stations. Gonu travelled the northern Arabian Sean and Gulf of Oman on a track relatively far from Chabahar Bay and at its closest location, the eye was about 200 km away from the Bay. This large distance, along with the narrow continental shelf outside the bay and the direction of cyclone’s movement, significantly decreased the effect of direct wind shear on water level rise in Chabahar. Out of a 0.4 meter maximum sea level rise in Chabahar during Gonu, 0.3 meter was attributed to the atmospheric pressure drop which is 75% of water level rise.
An analytical model based on simplified equations of motion showed a maximum wind shear-induced surge of about 0.1 m, in agreement with the results from data analysis and pressure maps.
Out of the three factors that contributed to the small storm surge in Chabahar Bay, shelf bathymetry and slope can play key roles in the height of sea level rise during a cyclone. A similar steep bed slope caused a relatively small storm surge even in the vicinity of the cyclone track along the Oman shoreline (maximum storm surge of 1.5 m). In an extreme case, a wide shelf and shallow bathymetry contributed to storm surge as high as 9 m during Hurricane Katrina. However, it should be noted that the amount of wind-induced storm surge also depends on the track and forward speed of the storm. A slow-moving storm over a coastal area can produce large storm surges regardless of the shelf bathymetry. Studying the contribution of coastally trapped
waves (Kelvin waves) was not in the scope of this study. However, these waves can negatively or positively interact with cyclone-generated storm surge depending on the direction of storm surge propagation from the cyclone center. This would benefit from further study.
ACKNOWLEDGEMENTS
This research was supported by the Iranian Port and Maritime Organization, who provided the field data. N.F.T Company is acknowledged for providing the license for MIKE 21. Manuscript edits by Jennifer Warrillow are sincerely appreciated.
REFERENCES
[1] Church, J.A., White, N.J., 2011. Sea-Level Rise from the Late 19th to the Early 21st Century. Surv Geophys 32, 585–602. doi: 10.1007/s10712-011-9119-1.
[2] Neumann, J.E., Emanuel, K., Ravela, S., Ludwig, L., Kirshen, P., Bosma, K., Martinich, J., 2015. Joint effects of storm surge and sea-level rise on US Coasts: new economic estimates of impacts, adaptation, and benefits of mitigation policy. Climatic Change 129, 337–349.
doi: 10.1007/s10584-014-1304-z.
[3] Allahdadi, M.N., Jose, F., D’Sa, E.J., Ko, D.S., 2017. Effect of wind, river discharge, and outer-shelf phenomena on circulation dynamics of the Atchafalaya Bay and shelf. Ocean Engineering 129, 567–580.
doi: 10.1016/j.oceaneng.2016.10.035.
[4] Allahdadi, M.N., Li, C., 2017. Numerical Simulation of Louisiana Shelf Circulation under Hurricane Katrina. Journal of Coastal Research.
doi:10.2112/JCOASTRES-D-16-00129.1.
[5] Siadatmousavi, S.M., Allahdadi, M.N., Chen, Q., Jose, F., Roberts, H.H., 2012. Simulation of wave damping during a cold front over the muddy Atchafalaya shelf. Continental Shelf Research 47, 165–177. doi: 10.1016/j.csr.2012.07.012. [6] Chaichitehrani, N., D’Sa, E.J., Ko, D.S., Walker, N.D.,
Osburn, C.L., Chen, R.F., 2013. Colored Dissolved Organic Matter Dynamics in the Northern Gulf of Mexico from Ocean Color and Numerical Model Results. Journal of Coastal Research 800–814.
doi: 10.2112/JCOASTRES-D-13-00036.1.
[7] Tehrani, N.C., D’Sa, E.J., Osburn, C.L., Bianchi, T.S., Schaeffer, B.A., 2013. Chromophoric Dissolved Organic Matter and Dissolved Organic Carbon from Sea-Viewing Wide Field-of-View Sensor (SeaWiFS), Moderate Resolution Imaging Spectroradiometer (MODIS) and MERIS Sensors: Case Study for the Northern Gulf of Mexico. Remote Sensing 5, 1439–1464. doi: 10.3390/rs5031439.
[8] Rego, J.L., Li, C., 2009. On the importance of the forward speed of hurricanes in storm surge forecasting: A numerical study. Geophys. Res. Lett. 36, L07609.
doi: 10.1029/2008GL036953.
[9] Dietrich, J.C., Zijlema, M., Westerink, J.J., Holthuijsen, L.H., Dawson, C., Luettich, R.A., Jensen, R.E., Smith, J.M., Stelling, G.S., Stone, G.W., 2011. Modeling hurricane waves and storm surge using integrally-coupled, scalable computations. Coastal Engineering. 58, 45–65.
doi: 10.1016/j.coastaleng.2010.08.001.
[10] Kim, K.O., Lee, H.S., Yamashita, T., Choi, B.H., 2008. Wave and storm surge simulations for Hurricane Katrina using coupled process based models. KSCE J Civ Eng 12, 1–8. doi:10.1007/s12205-008-8001-2Matlock, H., and Reese, L.C., 1960, Generalized solutions for laterally loaded piles., Journal of Soil Mechanics and Foundation, 86(5), 63–91. [11] Knabb, R.D., Rhome, J.R., and Brown, D.P. (2005). Tropical
cyclone report: Hurricane Katrina, National Hurricane Center, NOAA. (Available at
http://www.nhc.noaa.gov/pdf/TCR-AL122005_Katrina.pdf). [12] Fritz, H.M., Blount, C.D., Albusaidi, F.B., Al-Harthy,
A.H.M., 2010. Cyclone Gonu storm surge in Oman. Estuarine, Coastal and Shelf Science 86, 102–106.
doi: 10.1016/j.ecss.2009.10.019.
[13] Krishna, K.M., Rao, S.R., 2009. Study of the intensity of super cyclonic storm GONU using satellite observations. International Journal of Applied Earth Observation and Geoinformation 11, 108–113. doi:10.1016/j.jag.2008.11.001.
[14] Wang, Z., DiMarco, S.F., Stössel, M.M., Zhang, X., Howard, M.K., du Vall, K., 2012. Oscillation responses to tropical Cyclone Gonu in northern Arabian Sea from a moored observing system. Deep Sea Research Part I: Oceanographic Research Papers 64, 129–145. doi:10.1016/j.dsr.2012.02.005. [15] Mashhadi, L., Zaker, N.H., Soltanpour, M., Moghimi, S.,
2013. Study of the Gonu Tropical Cyclone in the Arabian Sea. Journal of Coastal Research 616–623.
doi: 10.2112/JCOASTRES-D-13-00017.1.
[16] Dibajnia, M., Soltanpour, M., Nairn, R., Allahyar, M., 2010. Cyclone Gonu: The Most Intense Tropical Cyclone on Record in the Arabian Sea, in: Indian Ocean Tropical Cyclones and Climate Change. Springer, Dordrecht, pp. 149–157. doi: 10.1007/978-90-481-3109-9_19.
[17] Allahdadi, M.N., Chaichitehrani, N., Allahyar, M., McGee, L., 2017. Wave Spectral Patterns during a Historical Cyclone: A Numerical Model for Cyclone Gonu in the Northern Oman Sea. Open Journal of Fluid Dynamics 07, 131-151.
doi: 10.4236/ojfd.2017.72009.
[18] Najar, K.A.A., Salvekar, P.S., 2010. Understanding the Tropical Cyclone Gonu, in: Indian Ocean Tropical Cyclones and Climate Change. Springer, Dordrecht, pp. 359–369. doi: 10.1007/978-90-481-3109-9_40.
[19] Holland, G.J., 1980. An Analytic Model of the Wind and Pressure Profiles in Hurricanes. Mon. Wea. Rev. 108, 1212–1218.
[20] DHI Water and Environment (2015) Mike 21 Toolbox, User Manual.
[21] Lari, K., Rahmani, H., 2012. Distribution Tidal Wave Energy and its Applications in Coasts of Iran Journal of Basic and Applied Scientific Research. 2(1), 449-460.
[22] Rego, J.L., Li, C., 2009. On the Receding of Storm Surge along Louisiana’s Low-Lying Coast. Journal of Coastal Research 1045–1049.
[23] Allahdadi, M.N., 2014. Numerical Experiments of Hurricane Impact on Vertical Mixing and De-stratification of the Louisiana Shelf Waters. Ph. D. Dissertation. Louisiana State University, Baton Rouge.
[24] Harris, L.D., 1959. An interim hurricane storm surge forecasting guide. National Hurricane Research Project 32, U.S. Weather Bureau, Washington, DC, 23 pp.
[25] Zhang, C., 2012. Effect of hurricane forward speed and approach angle on coastal storm surge. LSU Master’s Theses. [26] P. Gaspar, R.M. Ponte, Relation between sea level and