Thermodynamic Evaluation of Electrical Responses to
Odorant in Olfactory Sensory Neurons
Samantha Hagerty, Melissa Singletary, Oleg Pustovyy, Ludmila Globa, Edward E. Morrison, Iryna Sorokulova, Vitaly Vodyanoy*
Department of Anatomy, Physiology and Pharmacology, Auburn University College of Veterinary Medicine, Auburn, Alabama, USA
Abstract
The thermodynamic properties of olfactory sensory receptors were characterized by the measurement ofelectrical responses to odorants in isolated olfactory epithelia. Using the electroolfactogram (EOG), electrical activity was recorded within a temperature range of 16°C–35°C with epithelia obtained from animals being kept at ambient environmental conditions. The amplitude, the area under the curve, and the voltage kinetics of the electroolfactogram recordings were measured at different temperatures. The apparent values of the activation energy and the change of enthalpy (ΔH), entropy (ΔS), and Gibbs free energy (ΔG) of the odorant-receptor interaction were estimated using both Arrhenius and Eyring equations. The results reveal a broad variation of enthalpy (ΔH) and entropy contribution (TΔS) for odorant interaction with different sets of olfactory receptors. The observed enthalpy change was always followed by a corresponding change in the entropy contribution (TΔS), maintaining constant free energy (ΔG): ΔG=ΔH-TΔS and obeying the enthalpy-entropy compensation. Notably, in all experiments, the changes in enthalpy or entropy do not correlate with the change of free energy. Due to the fact that the values of ∆H and TΔS represent a summation of all chemical interactions between odorant and olfactory sensory neuron, it is difficult to expect the binding properties of odorants to serve as a foundation of molecular recognition by olfactory receptors. For this reason, our thermodynamic results do not support the shape mechanism of olfaction.
Keywords
Electroolfactogram, Shape model, Vibrational model1. Introduction
The sense of smell is not just crucial for animal survival [1]; it also assumes importance for human health, emotional connections, and social interactions [2-4]. The initial events of olfaction take place within the olfactory neuroepithelium situated in the posterior nasal cavity. Olfactory sensory neurons (OSNs) are bipolar neurons with a single axonal end extending basally and a dendritic end that extends apically towards the nasal cavity airway. OSNs direct their unbranched axons to the olfactory bulb (OB), passing through the cribriform plate. Within the OB, the OSNs axons form contact with secondary neurons (mitral and other cells) in spherical neuropils, called glomeruli. OSNs have a few dozen hair-like cellular structures, referred to as olfactory cilia. Cilia harbor the sensory apparatus (olfactory receptor (OR) proteins and other components) that converts and amplifies the physical-chemical signal of the odorant
* Corresponding author:
[email protected] (Vitaly Vodyanoy)
Published online at http://journal.sapub.org/biophysics
Copyright©2019The Author(s).PublishedbyScientific&AcademicPublishing This work is licensed under the Creative Commons Attribution International License (CC BY). http://creativecommons.org/licenses/by/4.0/
molecule into electric current [5]. The processes of signal transduction have been studied and described extensively [6], and is thought to be well characterized. However, the primary molecular mechanism of odorant recognition in olfaction remains contentious. The vibrational mechanism of olfaction was suggested in 1937 by Dyson [7, 8] being exposed to contemporary Raman Spectroscopy. Dyson opined that the molecular vibrations correlate with the properties of odorant in a range of 1,400-3500 cm-1. Later,
Wright modified Dyson’s model by considering vibrations below 700 cm-1 that he deemed more suitable for the whole
odorant molecule as opposed to for specific functional groups [9, 10]. The vibrational mechanism of olfaction was not actively researched and remained dormant for many years until Luca Turin reincarnated it in 1996 [11]. Turin proposed an inelastic electron tunneling spectroscopy (IETS) mechanism to discriminate odors. Under the IETS model, the odorant mediates inelastic tunneling of an electron between donor and acceptor inside the receptor. The donor and
acceptor differ in energy by ћωo (phonon energy), so that
vibrational mechanism has been developed further theoretically and examined experimentally by Turin along with many other scientists. For recent review, refer to [12]. The alternative mechanism of olfaction is based on the lock-and-key model originally offered for the ligand-protein interaction [13]; later, the general concept was used in the Moncrieff and Amoore shape-stereochemical-steric mechanism controlling olfaction [14-17]. This model in the present interpretation suggests that shape, size, and functional groups of odorant determine the activation of olfactory receptors. A variety of physical forces and interactions are suggested to interplay in order to support this model of olfaction. The list contains electrostatic ion-ion and proton acid-base interactions, hydrogen-bonding, halogen bonding, charge-transfer and π–π molecular complexation,
dipolar and multipolar interactions, and van der Waals interactions [18]. These forces were somewhat narrowed in consideration of binding of the odorant and the odorant binding pocket via hydrophobic and van der Waals interactions [19]. In order to satisfy the fact that each odorant is recognized by multiple olfactory receptors, and that each receptor can bind multiple odorants [20], the simple “lock-and-key” model was replaced by the “induction fit” and “conformational selection” models, where shape of the odorant does not exactly fit to the shape of the receptor; instead, both odorant and receptors may experience conformational transformations [21]. The efficacy of odorants in activating receptors was attributed to a gamut of factors including “tight interaction with the floor of the binding pocket” [22], odorant functional groups specific hydration [23], odorant molecular shape [24], odorant size and hydrophobicity [25], volume and structural flexibility [26], odorant-receptor binding kinetics [27] and binding affinity of odorant to receptor [28]. Without according preference to the “shape” or “vibrational model”, it would be fair to surmise that the present “shape” model of olfaction goes over and above the original straightforward, elegant, and clear concept of Moncrieff and Amoore model, involving numerous interactions and factors that are suggested to be vital for olfactory recognition. Notably, the binding chemistry and binding affinity of odorants to receptors are important requirements of the contemporary shape model.
The shape and vibration models have been debated extensively [29, 30]. The proponents of the vibrational model primarily contend that animals and humans can discriminate isotopic odorants that have replaced hydrogen or carbon with heavier atoms. Although the molecules preserve their shape, they are known to change mass and consequently, the frequency of vibration [31-35]. Meanwhile the supporters of “shape” models of olfaction argue that the chemical properties of odorants with replaced atoms are different from the original unaltered molecules. Therefore, the interaction of the isotope odorant with mucus and binding inside the receptor may be responsible for the discrimination of odorant-isotopes [29].
We question the importance of the binding properties
between odorants and olfactory receptors for the odorant recognition. In this work, we have analyzed the kinetic and thermodynamic properties of electroolfactogram (EOG) [36] which is the transient electrical response of OSNs to a short pulse of odorant stimulation. The objective of the study is to characterize the initial events in olfactory transduction thermodynamically when the complicated multistep biophysical process underpinning the EOG is depicted by the transition over a single potential barrier. This approach allows the quantification of activation energy, as well as the change of enthalpy, entropy, and Gibbs free energy of this transition. Furthermore, it enables us to look at the controversial “shape” and “vibrational” models from a different perspective.
2. Material and Methods
2.1. Animals
The animal protocol was approved by the Auburn University Institutional Animal Care and Use Committee (AU IACUC). Adult male Sprague–Dawley rats (Envigo, Dublin, VA) weighing ~300 g were used.
2.2. Odorants
Odorants were obtained from Sigma-Aldrich. An odorant mixture of 1.6 mmole/L each of ethyl butyrate, eugenol, and (+) and (–) carvone in water was prepared with a vortex mixer and stored in a dark glass container at 283K (5°C). This odorant mixture had been previously used in our research [37, 38] (Supplementary information).
2.3. Experimental Design
The kinetics of olfactory sensory responses to odorants were measured by the electroolfactogram (EOG) of isolated rat olfactory epithelium at the temperature-controlled conditions. A total of 11 rats were divided into two groups. One group (negative control) comprising of four rats were tested and the EOG of extracted olfactory epithelia were measured at a constant temperature. The second group of seven animals was examined and the EOG of extracted olfactory epithelia were measured at various temperatures ranging between 16-35°C. The kinetics of olfactory responses to odorants were used to calculate the thermodynamic parameters of EOG at given conditions. 2.4. Electroolfactogram Recording
Rat OE was dissected and positioned in a perfusion chamber such that the basal parts were immersed in buffer solution [37]. The EOG measuring electrode with the
opening of ~24 μm in diameter could cover ~50 neurons. On
clamped voltage responses were recorded as EOG with an integrating patch clamp amplifier (MultiClamp 700A Amplifier, Molecular Devices). The analog signal was filtered at 0-5 kHz and digitized using a digital converter (DigiData 1322 A). Data acquisition, storage and subsequently, analysis was carried out using pCLAMP software (Axon Instruments) and exported in ASCII format for further analysis.
The recording chamber was enclosed in a grounded Faraday box on a vibration isolation table (GS-34 Newport) (Supplementary information).
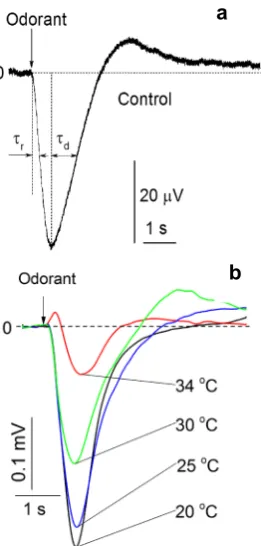
EOG responses were analyzed to determine half-rise and half-decay times. The EOG signal typically rises to achieve a maximal level before decaying to the initial value. Notably, the half-decay time is defined as the time needed for the EOG signal to decay from the maximum level to half of maximal amplitude [39]. The representative EOG trace is illustrated in Figure 1 a.
Figure 1. Electroolfactogram. a. Representative EOG trace from dissected
rat olfactory epithelium. b. Representative EOG traces from dissected rat
olfactory epithelium recorded at different temperatures
2.5. Stability of Olfactory Responses to Odorant
Due to significant variability of odorant responses by individual cells, it was important to ensure stability over an extended period and response reproducibility at a single contact. Olfactory epithelia were also evaluated for responsiveness to odorants and stability. Repeatable recordings of consecutive 0.25-s odorant pulses were produced at 200-s at steady-state conditions. The patch clamp amplifier stability was also examined.
2.6. Delivery of Odorants
The odorant vapor was produced by homemade olfactometer [26] that was used for the precise computer-controlled delivery of pre-determined quantities of odorants over a programmed time interval (Supplementary information). For stimulation purposes, a 0.25 s pulse of the odorant mixture at 8 pounds per square inch was formed by the computer-controlled olfactometer and Pneumatic PicoPump PV800 (World Precision Instruments, Sarasota, FL, USA). A pulse of positive pressure drove the odorant into a glass nozzle directed at the OE. The residual odorant was cleared by air between each stimulus application. The odorant pulse patterns were initiated either manually at predetermined time intervals or automatically by computer. The automatic computer routine comprised of 0.25 s pulses at 20 s intervals. One series of 10 pulses at 20 s intervals constituted one ‘EOG recording.’ Thus, in the automatic regime, the duration of a single ‘EOG recording’ was 200 s and was able to correspond to 10 response traces.
The water/air partition coefficient for all odorants used in our experiments is very low (~10-4), and the concentration of
odorants delivered to olfactory epithelia is of ~ 100 nM range (Supplementary information).
2.7. Temperature-controlled EOG Perfusion Chamber The perfusion chamber was positioned into the aluminum plate with heating elements controlled by an Automatic Temperature Controller C TC 324 (Warner Instruments, Hamden, CT USA). Thereafter, the temperature was measured by a thermistor with an accuracy of 0.01 oC before
being synchronized and recorded continually with the EOG signals. (Supplementary information, Figure S3). The temperature of the perfusion chamber with OE could be maintained within a range of 16-35°C. The steady state temperature was held at ±0.1°C, and transition between different temperatures was achieved at the rate of ~1.5 degrees/minute. The chamber with OE was perfused at 10 mL/h by a Peristaltic Pump P-1 (Pharmacia Fine Chemicals Inc, Piscataway, NJ, USA).
2.8. Thermodynamic Calculations of the EOG Measured at Different Temperatures
The ion currents resulting from the interaction of odorants with olfactory sensory receptors cause the transmembrane potential difference in the cilia, known as a generator potential. The EOG represents the sum of generator potentials of olfactory receptor neurons. EOG can be recorded by an electrode placed on the surface of the olfactory mucosa as the mucosa is subjected to an odorous stimulus [36].
The simplified diagram of signal transduction can be illustrated as follows:
a
Activation ┌−−−−−−−−−−−┐
O+RGp↔OR+Gp→AC→cAMP→Cachannel→Ca+2→Clchannels
→Cl-→I
Ca+2+ICl-
└--PDE-CaCaM-┘
Deactivation (1) The diagram (1) shows that the odorant (O) interacts with the receptor-G-protein complex (RGp). This interaction
causes the separation of Gp. One of the components of Gp
complex activates adenylyl cyclase (AC) that generates cAMP. Molecules of cAMP activate Cachannels allowinginflux
of depolarizing Ca+2-ions. In turn, Ca+2-ions open Cl channels
and allow efflux of Cl--ions that further contributes to the
depolarization of the membrane. The ion currents ICa+2+ICl
-produce generator potential, whereas the sum of generator potentials of olfactory sensory neurons represents EOG (Supplementary information).
We suggest that the time of activation and deactivation during the initial events in olfaction, as shown in the diagram (1), can be characterized by half-rise (τr) and
half-decay (τd) times of EOG (Figure 1) [39]. Therefore, the
half-time of the total time of activation-deactivation
τ= τr+ τd. (2)
For the sake of simplicity, we interpret the inverse time,
1/τ, as the first-order rate constant, k, characterizing the overall process of activation-deactivation
k=1/τ (3) A similar approach was taken for the thermodynamic analysis of ion channels and receptors [40-42].
A plot of the left-hand side of Eq. (3) versus time (t) yields an estimate of k from the slope. The Arrhenius equation can be used to express the temperature dependence of the first-order activation kinetics:
The activation energy of the process can be estimated by using the Arrhenius equation [43]:
k=Ae-EaRT (4)
where R denotes the universal gas constant, Earepresents the
apparent activation energy, and A signifies the
pre-exponential Arrhenius factor. Taking the logarithm of Eq. (4) yields:
logk=- Ea 2.303R×
1
T+logA (5)
If the logarithm of k in Eq. (5) is plotted against the reciprocal of temperature, 1/T, the slope of this graph yields the activation energy (Ea), the thermal activation of olfactory
receptors. The rate constant, which depends on the thermodynamic activation parameters of this transition state, can be described by the Eyring equation [44]:
k=kb h e
-ΔG RT=kbT
h e
ΔS
Re-ΔRTH (6)
where k is the rate constant, ΔG is the standard Gibbs free energy of activation, h refers to Planck’s constant, ΔS denotes the standard entropy of activation, ΔH is the
standard enthalpy of activation, kb signifies the Boltzmann
constant, R is the gas constant, and T represents the absolute temperature in Kelvin. Taking the logarithm of both sides of Eq. (6), one obtains:
log�Tk�=log�kb h�+
ΔS 2.303R
-ΔH 2.303R×
1
T (7)
If the plot of the left-hand side of Eq. (7) versus 1/T is linear, it is possible to compute the value of ΔH from the
slope, ΔS from the ordinate intercept and the Gibbs free energy of activation by the relation:
ΔG=ΔH-TΔS (8) From Eq. 4 we can define the energy of activation as:
Ea=-R∂�∂lnk1 T�
(9)
The substitution of k in Eq. (9) with the k equivalent relation in Eq. (6) and differentiation of this new expression with respect to 1/T demonstrates that the Arrhenius (Eq. 4) and the Eyring (Eq. 6) expressions can be related as [45]:
Ea=ΔH+RT (10)
and
A=(ekbT h )e
ΔS
R (11)
Taking the logarithm of both sides of Eq.11, one obtains: logA=log�ekbT
h �+ ΔS
2.303R (12)
suggesting a linear relationship between the logarithm of the Arrhenius frequency-factor and entropy of activation that was obtained from the Eyring equation for the transitional state [46].
The first-order kinetic model was used to determine the best fits of the data with the apparent rate constant k. Subsequently, the Arrhenius and Eyring equations were applied to the data in order to determine Ea, A, ΔG, ΔH, and
ΔS of the temperature-dependent viability transitions. For two temperature points T1 and T2 it follows from Eq. 5
that
Ea=
2.303T1T2logk1k2
T1-T2 (13)
log A=log k1+2.303REa ×T11=log k2+2.303REa ×T12 (14)
Substituting log A in Eq. 14 from Eq. 12, it follows that entropy
ΔS=2.303R[ log A-logkb
h- log(eT)] (15)
Enthalpy ∆H is found from Eq. 10 as
∆H=Ea-RT (16)
Using ∆S from Eq. 15 and ∆H from Eq. 16, the Gibbs free energy of activation is calculated from Eq. 8.
constant.
The area under EOG time curve (si) is measured at the
consecutive steady states at temperatures (Ti) at times (ti):
s1, s2,… sn (17)
T1, T2,… Tn (18)
ti, t2, … tn (19)
Change of area, temperature and time can then be estimated as following:
Δsi=s2-s1, s3-s2, …sn-sn-1 (20)
Ti=(T2-T1)/2, (T3-T2)/2…(Tn-Tn-1)/2 (21)
Δti=t2-t1, t3-t2, …tn-tn-1 (22)
The relative change of area per second at temperatures Ti
can be estimated from Eqs (20-22):
(Δsi/Δsn)/ Δti≈ki, (23)
where ki denotes the rate constant at the temperature
represents Ti.
If values of log ki calculated from experimental EOG data
by using Eq. (23) are plotted as the function of 1/Ti, we
obtain the Arrhenius presentation of the rate constant Eq.(5). The EOG traces were recorded with isolated olfactory epithelia [37] at steady state temperature conditions and transient conditions when temperature grows (or decreases) slowly from one to another level. The OE was kept at the constant temperature T1 for ~ 15 minutes, before being
increased from T1 to T2with the rate of ~1.5 degrees/minute.
As shown in Fig 1, the half-rise (τr) and half-decay time (τd)
for a single EOG trace were measured, and the rate constant was estimated using Eqs (2) and (3). The multiple values of half-rise and half-decay times at two steady-state temperatures was found to be better represented by EC50 of the cumulative frequency distributions as compared to mean values. Similarly, the EC50s of the cumulative frequency distributions of rate constant were used to characterize the overall activation-deactivation at two temperatures.
2.9. Statistical Analysis
Data averaging, ANOVA, t-test, curve fitting, and graph plotting were conducted using Origin 2015 (Northampton, MA, USA) and 2010 Microsoft Excel.
3. Results
3.1. Stability and Repeatability of Olfactory Responses to Odorant
Response amplitude was found to be fairly stable during repetitive odorant application. Notably, the mean values of the relative change of two consecutive EOG traces stimulated by the same odorant pulse were │ΔV/V│=3.5 ±
0.9% (SE); │Δτr/τr│=2.2±0.7% (SE); │Δτd/τd│=3.9±0.9%
(90 traces). The drift slopes estimated for the same records
of repeated EOG recording were 0.8 ± 0.2% min-1
(10 consecutive traces, 200 s). Patch clamp amplifier
performance was stable during the experiments with OE. The ramp-pulse experiments exhibited a linear dependency across the entire range of tested currents, and repeatability was found to be greater than 99%. The slew rate was smaller
than10 μV/s, while the mean experimental rate of the EOG
signal was on the order of 1,000 μV/s. The conditions of
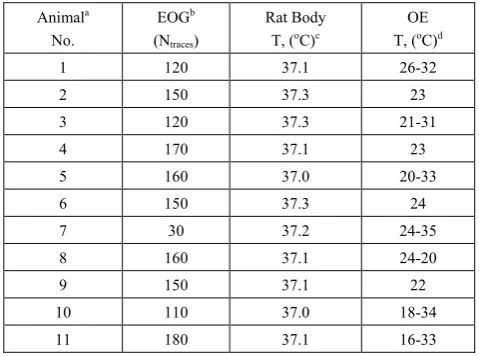
EOG experiments and the number of recorded EOG traces are mentioned in Table 1.
Table 1. Conditions of EOG Measurements Animala
No.
EOGb
(Ntraces)
Rat Body
T, (oC)c T, (OE oC)d
1 120 37.1 26-32
2 150 37.3 23
3 120 37.3 21-31
4 170 37.1 23
5 160 37.0 20-33
6 150 37.3 24
7 30 37.2 24-35
8 160 37.1 24-20
9 150 37.1 22
10 110 37.0 18-34
11 180 37.1 16-33
a – number of experimental animals; b – number of electroolfactogram traces; c – animal temperature before surgery; d – temperature of olfactory epithelium during the experiment.
3.2. Kinetics of Responses to Odorant at Different Temperatures
In the majority of cases, the isolated olfactory epithelia responded to a 0.25-second long pulse of odorant vapor by generating electronegative EOG responses that were synchronized with stimulus onset. Typical EOG responses at varying temperatures are illustrated in Figure 1 b.
Differences were apparent in how olfactory epithelia responded at different temperatures. The maximal amplitude of the EOG dramatically decreased as temperatures increased from 20 to 34 oC. The shape of the EOG curve also
changes with a rise in temperature. The kinetic and thermodynamic analyses of EOG curves at different temperatures are given below.
3.3. Thermodynamic Analysis of EOG Recordings The EOG kinetic properties were used to calculate thermodynamic parameters (Ea, ΔH, ΔS, and ΔG). The
processes of activation and deactivation of EOG were thought to be an overcoming a single apparent potential barrier. Therefore, the apparent thermodynamic parameters elucidate the entire process of EOG generation. The models describe the overall activation-deactivation processes.
related to the change of relative area under EOG peak for
various steady-state temperatures; and 4. from the
cumulative frequency distribution at two temperatures. 3.4. Arrhenius and Eyring equations
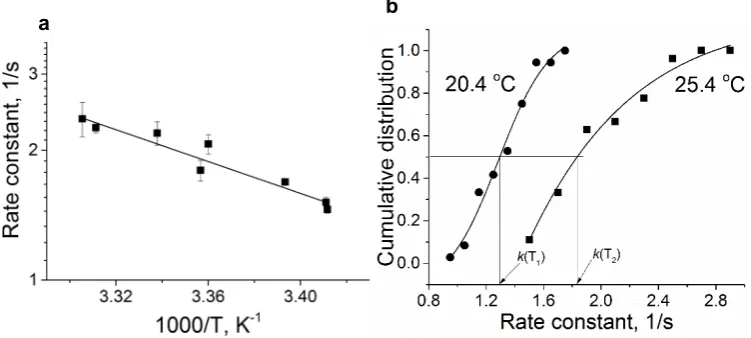
Figure 2 a illustrates Arrhenius plot of experimental EOG recordings at steady state temperature in a range of 21-31°C for the rate constant. The example of calculating
thermodynamic properties of EOG processes using Arrhenius and Eyring equations and experimental results are provided in the Supplementary information. The parameters of Ea, ΔH, ΔS, T ΔS, and ΔG for this experiment in addition to
six more experiments using Arrhenius plot are illustrated in Table 2.
Table 2. Thermodynamic analysis of the EOG activation/deactivation of isolated olfactory epithelium at elevated temperatures
Method Animal
number T, oC
Ea Kcal.mol-1
∆H
Kcal.mol-1
∆S
calK-1mol-1
T∆S
Kcal.mol-1
ΔG
Kcal.mol-1
Arrhenius1 3 21-31 8.4±0.8 7.8±0.7 -30.8±2.0 -9.2±0.8 16.9±1.2
Arrhenius1 5 20-30 -1.1±0.2 -1.7±0.2 -63.1±4.0 -18.8±0.4 17.1±1.0
Arrhenius1 11 16-31 5.1±0.3 4.5±0.3 -38.3±2.0 -11.4±0.6 15.9±1.0
Arrhenius1 10 18-32 -7.6±1.9 -8.1±2.0 -85.2±6.0 -25.4±2.0 17.2±4.3
Arrhenius2 5 22-28 0.9±2.0 0.3±1.0 -59.3±9.0 -17.7±3.0 17.0±5.0
Arrhenius3 3 21-29 7.3±2.0 6.7±3.0 -45.4±5.0 -13.5±0.4 20.2±0.9
Cumulative4 3 20 & 25 6.1±0.2 5.5±0.4 -38.8±3.0 -11.6±0.8 17.1±1.1
Cumulative4 5 20 & 30 -1.2±0.01 -1.8±0.01 -63.4±3.0 -17.2±0.7 17.5±0.6
Cumulative4 11 16 & 22 3.7±0.4 3.1±0.3 -57.3±3.0 -17.10.8 17.4±0.6
Cumulative4 7 25 & 30 2.2±0.3 1.6±0.2 -51.9±2.0 -15.5±0.7 17.1±0.8
Cumulative4 10 21 &29 -5.4±0.4 -5.9±0.5 -70.8±4.2 -21.1±1.1 15.1±0.7
Cumulative4 1 26 & 33 1.8±0.4 1.3±1.4 -54.6±4.0 -16.3±1.1 17.4±1.5
1, 4 EOG rate constants measured at steady-state temperatures by Arrhenius and Cumulative distribution methods, respectively. 2. EOG rate constants measured at the slow transient temperature changed at ~1.5 oC/min. 3- EOG rate constants measured by the relative area change under the EOG peak. 4 EOG rate constants measured
by the cumulative frequency distributions of EOG rate constant at two temperatures.
Figure 2. Temperature dependence of olfactory responses. a. Arrhenius plot. The points are experimental data obtained at the temperature range of 21-31
oC and plotted by using equation (5); this line is a linear regression: R-Square 0.93, Intercept 6.47±0.62; Slope -1.84±0.18. Data collected from one
epithelium, 12 recordings, 120 EOG traces. b. Cumulative frequency distributions of EOG rate constant at two temperatures. The cumulative distribution
function of rate constant
3.5. Cumulative Frequency Distributions of EOG Rate Constant at Two Temperatures
Using Eqs (13-16) and (8), the apparent thermodynamic
parameters Ea, ΔH, ΔS, T ΔS, and ΔG for the
activation-deactivation can be calculated from the experimental data through the cumulative distribution
function of the rate constant at two steady-state temperatures.
Figure 2b illustrates the cumulative distribution function of the rate constant at two steady-state temperatures. Points are the rate constant times obtained by using frequency distribution of rate constant at temperatures of 20.4 and 25. 4°C. Based on the rate constant cumulative distributions, we
have the values of k1=1.3 1/s and k2=1.8 1/s at temperatures
T1=293.4 K and K2=298.4 K.
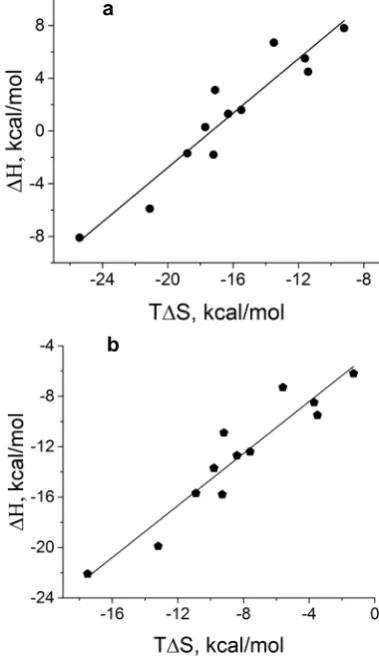
Figure 3. Entropy-enthalpy correlation. a. Thermodynamic correlation of enthalpy and entropy contribution for activation and deactivation of
olfactory response. TΔS values were taken from Table 2(column “Entropy contribution TΔS, kcal mol-1”), while ΔH values were drawn from the column “Enthalpy, ΔH, kcal mol-1”). The points are experimental data from
Table 2 while a line is a linear regression: R-Square=0.89;
Intercept=17.9.0±1.9 kcal/mol; Slope=1.03 ±0.11. b. Thermodynamic correlation of enthalpy and entropy contribution for binding of odorants to
odorant. TΔS values were taken from Table 4 (column “Entropy
contribution TΔS, kcal mol-1”), ΔH values were from the column “Enthalpy, ΔH, kcal mol-1”). The points are experimental data from Table 2 while a line
is a linear regression: R-Square=0.89; Intercept=-4.29±1.0 (SE) kcal/mol;
Slope=1.03±0.11 (SE)
The example of calculating the thermodynamic properties of EOG processes using cumulative frequency distributions of EOG rate constant at two temperatures from the experimental results are given in Supplementary information.
The parameters of Ea, ΔH, ΔS, T ΔS, and ΔG for this
experiment as well as for six more experiments are depicted in Table 2.
3.6. Thermodynamic Correlates of
Activation-Deactivation of Olfactory Respond to the Odorant
When the enthalpy changes (ΔH) were plotted as a
function of the energy of entropy contribution (TΔS)
provided in Table 2, the data were fitted with a single line that corresponded to the equation ΔH= ΔGo+TΔS, where
ΔGo=17.6 ±1.4 kcal/mol and slope =1.01±0.08 (Figure 3 a).
The average values of thermodynamic parameters in Table 2 are as follows: Ea=1.7±1.4 (SE) kcal/mol; ΔH=1.1±1.4 (SE)
kcal/mol; ΔS=-54.9±4.4 (SE) cal mol-1K-1; T ΔS=-16.2±1.3
(SE) kcal/mol; ΔG=17.2±0.3 (SE).kcal/mol.
4. Discussion
In the majority of cases, the olfactory epithelium responded to 0.25 second long puffs of odorant by generating electronegative EOG responses that were synchronized with the delivery of stimulus. Typical EOG responses are shown in Fig 1 b. The shape and kinetics of EOG responses change with a rise in temperature. The mean time of half-rise (τr)
decreased significantly at the level 0.05 from 225.4±6.2 (SE) ms to 184.1±1.3 (SE) ms when temperature increased from 16 to 20°C [F(1, 70)=354, p=0.0]. In a similar manner, the mean decay time (τd) decreased significantly from 529.1±20
(SE) ms to 416.4±3.6 (SE) ms at the same elevation of
temperature (F(1, 66)=89, p=0.0].
The thermodynamic EOG model shows a rather broad variation of enthalpy (ΔH) from 8.9 to – 8.1 kcal/mol, while the entropy contribution (TΔS) changes from -8.1 to -26.1 kcal/mol (Table 2). As evidenced in Figure 3 a, the change in
enthalpy (ΔH) was compensated by a change in entropy
contribution (TΔS), which allowed the change in Gibbs
free energy (ΔG) =ΔH-TΔS to remain unchanged. This phenomenon called enthalpy-entropy compensation had been observed in the thermodynamics of several physical-chemical and biological processes [52, 53]. Notably,
ΔG0 obtained from the enthalpy-entropy correlation plot is
not significantly different from the average value of
ΔG=17.2±0.3 (SE).kcal/mol that is found in 12 experiments,
as shown in Figure 3 a. The positive and negative values of the change of enthalpy indicate that overall EOG processes could be endothermic or exothermic, whereas the change of entropy contribution was negative at the experimental conditions of our experiments. The change of the total EOG Gibbs free energy is positive, which indicates the exothermic process [46].
Enthalpy-entropy compensation was observed in other molecular recognition components involved in the olfactory transduction cascade (adenylyl cyclase, cyclic
nucleotide-gated channels, and
phosphodiesterase-Ca2+calmodulin). Importantly, the
adenylyl cyclase activity was measured in cilia preparation by the radioactive assay [48-50]. The thermodynamic parameters calculated by Arrhenius and Eyring equations using the experimental adenylyl cyclase activity at 19.7 and 33°C showed ∆H=-1.8 kcal/mol and T∆S=-13.7 kcal/mol that compensated each other, which led to free energy of binding of 11.9 kcal/mol (Table 3).
a
Table 3. Thermodynamic properties of the processes involved in the olfactory transduction cascade
Process ∆H
Kcal.mol-1
∆S
calK-1mol-1
T∆S
Kcal.mol-1
ΔG
Kcal.mol-1 Ref.
EOG 0.6 -55.3 -16.8 17.2 e
a AC -1.8 -45.9 -13.7 11.9 [54]
bCNG 12 -30 -8.9 21 [41]
c PDE 3.8 49.5 14.7 -10.9 [55]
dOBP -50 -63.4 -18.9 -31.3 [56]
a-Adenylyl cyclase activation in rat olfactory cilia. Adenylyl cyclase activity was measured in cilia preparation and hemodynamic parameters were calculated from Arrhenius plots. b-Olfactory-type cyclic nucleotide-gated channels. The thermodynamic parameters obtained from the opening and closing time of cyclic nucleotide gated (CNG) channels were calculated from Arrhenius and Eyring equations. c-Phosphodiesterase binding by Ca2+calmodulin. ΔH and the
equilibrium association constant (KA) were measured using isothermal titration
calorimetry. The steady state value of ΔG was found as –RTlnKA, and ΔS as (ΔH- ΔG)/T. d-Rat odorant binding protein. Thermodynamic parameters of recombinant rat OBP3 were measured using isothermal titration calorimetry. e-present work.
The thermodynamic parameters shown in table 2 are overall parameters of EOG processes which are inclusive of all components involved in the olfactory transduction cascade (olfactory receptors, adenylyl cyclase, cyclic
nucleotide-gated channels, and phosphodiesterase-Ca2+calmodulin). If the components of
EOG processes are assumed to be coupled and reversible, their thermodynamic properties are additive [57]. The overall free energy of EOG processes,
∆Goverall= ∆Greceptors+∆GAC +∆Gchannels+∆GPDE, (24)
where ∆Greceptors is a free energy change of odorant/olfactory
receptor interaction, ∆GAC refers to free energy change of the
αG-protein component with adenylyl cyclase, ∆Gchannels
denotes a free energy change of the cAMP interaction with the ion channel, and ∆GPDE signifies a free energy of the
Ca2+calmodulin and phosphodiesterase interactions.
Similarly, ∆Soverall and ∆Hoverall can be depicted as follows:
∆Soverall= ∆Sreceptors+∆SAC +∆Schannels+∆SPDE, (25)
∆Hoverall= ∆Hreceptors+∆HAC +∆Hchannels+∆HPDE, (26)
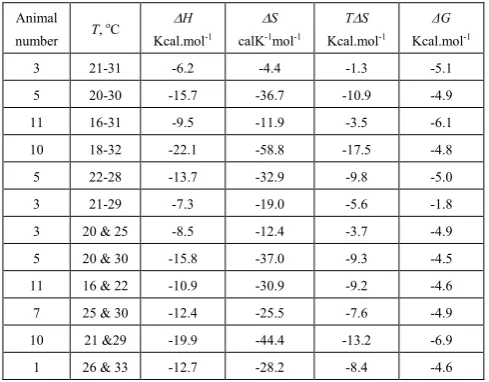
Using values of thermodynamic parameters for overall EOG processes (Table 2), along with values of those for EOG components (Table 3), the thermodynamic properties of odorant receptor interaction were estimated with equations (24-26) and illustrated in Table 4. The average values of thermodynamic parameters shown in Table 4 are:
ΔH=-12.9±1.4 (SE) kcal/mol; ΔS=-28.5±4.3 (SE) cal mol-1K-1; TΔS=-8.3±1.3 (SE) kcal/mol; ΔG=-4.84±0.34
(SE).kcal/mol.
When the enthalpy changes (ΔH) were plotted as a
function of the energy of entropy contribution (TΔS) outlined in Table 4, the data were fitted with a single line that
corresponded to the equation ΔH= ΔGo+TΔS, where
ΔGo=-4.3 ±1.0 kcal/mol and slope =1.03±0.08 (R-square
0.89) (Figure 3 b). This plot indicates the enthalpy-entropy compensation in the process of the interaction odorant and olfactory receptors. The changes in enthalpy and entropy are
found to be negative. They both vary significantly, but entropy contribution always compensates enthalpy, so that Gibbs energy remains unchanged. The change in the Gibbs free energy change, ΔG<0, that suggests the ergogenic and spontaneous process.
Table 4. Thermodynamic properties of odorant receptor interactions
Animal number T, oC
∆H
Kcal.mol-1 ∆S
calK-1mol-1
T∆S
Kcal.mol-1
ΔG
Kcal.mol-1
3 21-31 -6.2 -4.4 -1.3 -5.1 5 20-30 -15.7 -36.7 -10.9 -4.9 11 16-31 -9.5 -11.9 -3.5 -6.1 10 18-32 -22.1 -58.8 -17.5 -4.8 5 22-28 -13.7 -32.9 -9.8 -5.0 3 21-29 -7.3 -19.0 -5.6 -1.8 3 20 & 25 -8.5 -12.4 -3.7 -4.9 5 20 & 30 -15.8 -37.0 -9.3 -4.5 11 16 & 22 -10.9 -30.9 -9.2 -4.6 7 25 & 30 -12.4 -25.5 -7.6 -4.9 10 21 &29 -19.9 -44.4 -13.2 -6.9 1 26 & 33 -12.7 -28.2 -8.4 -4.6
In a single contact, the EOG measuring electrode records the electrical activity of the set of several olfactory sensory neurons. Owing to the heterogeneity of receptor distribution in the olfactory epithelium [58], the likelihood of connecting to the same set of receptors in the different epithelia is minimal. The delivery of the same odorant to different epithelia (different sets of receptors) evoked EOG responses with radically different changes of enthalpy and entropy, and thus with dissimilar binding profiles. The broad range of enthalpy/entropy alterations of many different receptors in response to a single odorant indicates the promiscuous binding to several olfactory receptors. While this unique property is useful to balance the binding profiles with receptors, it is unfortunately of no use for odorant recognition. The marked difference in enthalpy is compensated by entropy contribution bringing the same binding affinity. Thus, from the standpoint of thermodynamic model, the binding properties, including many attributes of the “shape” model, are not likely to be used by olfactory receptors for recognition of odorants. Whilst the binding properties of odorants and receptors help in accommodating the odorant inside the receptor binding pocket, they do not generate the recognition signal that is more likely produced by specific vibrations.
The universality of the entropy- correlation can probably be attributed to the fact that one of the major mechanisms of this phenomenon is predicated on the interaction with water universally present in the majority of observations [53, 59]. The values of ∆H and -TΔS represent a summation of all chemical interactions between ligand and protein, or in part between odorant and olfactory receptor. In our experiments and literature analysis, ∆H and -TΔS balance each other at
unchanged owing to enthalpy-entropy compensation. Consequently, it is difficult to expect the binding properties of odorants to serve as a foundation of molecular recognition by olfactory receptors.
In the next study we will analyze individual steps of the olfactory transduction cascade.
5. Conclusions
1. Amplitude and area under peak of electroolfactogram recorded in isolated rat olfactory epithelium are shown to reduce at elevated temperatures in the range of 16 – 35 oC.
2. The energy associated with the change of apparent entropy, TΔS, correlates with the change in apparent enthalpy, ΔH, keeping the apparent free energy ΔG= ΔH-TΔS constant.
3. Thermodynamic enthalpy-entropy compensation in our experiments and those in literature is not found to be consistent with shape mechanism of olfaction.
ACKNOWLEDGEMENTS
The work was funded by National Institute of Science and Technology (NIST) grant: 70 NANB14H324.
DISCLAIMER
Certain commercial equipment, instruments, or materials are identified in this paper to specify the experimental procedure adequately. Such identification is not intended to imply recommendation or endorsement by the National Institute of Standards and Technology, nor is it intended to imply that the materials or equipment identified are necessarily the best available for the purpose.
REFERENCES
[1] Asahina, K., V. Pavlenkovich and L. B. Vosshall (2008). "The survival advantage of olfaction in a competitive environment." Current biology: CB 18(15): 1153-1155. [2] Boesveldt, S., J. R. Yee, M. K. McClintock and J. N.
Lundström (2017). "Olfactory function and the social lives of older adults: a matter of sex." Scientific Reports 7: 45118. [3] Herz, R. S. (2016). "The Role of Odor-Evoked Memory in
Psychological and Physiological Health." Brain Sciences 6(3): 22.
[4] Krusemark, E. A., L. R. Novak, D. R. Gitelman and W. Li (2013). "When the Sense of Smell Meets Emotion: Anxiety-State-Dependent Olfactory Processing and Neural Circuitry Adaptation." The Journal of Neuroscience 33(39): 15324-15332.
[5] Lancet, D. and N. Benarie (1993). "Olfactory Receptors." Curr Biol 3(10): 668-674.
[6] Handbook of olfaction and gustation. Hoboken, New Jersey, Wiley Blackwell.
[7] Dyson, G. M. (1937). "Raman effect and the concept of odour." Perfumery Essent. Oil Record 28: 13-19.
[8] Dyson, G. M. (1938). "The Scientific basis of odour." Chem Ind 57: 647-651.
[9] Wright, R. H. (1954). "Odour and chemical constitution." Nature 4409: 831.
[10] Wright, R. H. (1961). "Odour and Molecular Vibration." Nature 190(4781): 1101-1102.
[11] Turin, L. (1996). "A spectroscopic mechanism for primary olfactory reception." Chem Senses 21(6): 773-791.
[12] Hoehn, R. D., D. E. Nichols, H. Neven and S. Kais (2018). "Status of the Vibrational Theory of Olfaction." Frontiers in Physics 6: 1-16.
[13] Fischer, E. (1894). "Einfluss der Configuration auf die Wirkung der Enzyme." Berichte der deutschen chemischen Gesellschaft 27(3): 2985-2993.
[14] Moncrieff, R. W. (1944). The chemical senses. London, L. Hill.
[15] Moncrieff, R. W. (1954). "The characterization of odours." J. Physiol. 125: 453-465.
[16] Amoore, J. E. (1952). "Stereochemical specificities of human olfactory receptors." Perfum Essent Oil Rec 43: 321-323. [17] Amoore, J. E. (1963). "Stereochemical theory of olfaction."
Nature 198: 271-272.
[18] Askim, J. R., M. Mahmoudi and K. S. Suslick (2013). "Optical sensor arrays for chemical sensing: the optoelectronic nose." Chemical Society Reviews 42(22): 8649-8682.
[19] Katada, S., T. Hirokawa, Y. Oka, M. Suwa and K. Touhara (2005). "Structural Basis for a Broad But Selective Ligand Spectrum of a Mouse Olfactory Receptor: Mapping the Odorant-Binding Site." The Journal of Neuroscience 25(7): 1806-1815.
[20] Malnic, B., P. A. Godfrey and L. B. Buck (2004). "The human olfactory receptor gene family." Proceedings of the National Academy of Sciences of the United States of America 101(8): 2584-2589.
[21] Deupi, X. and B. K. Kobilka (2010). "Energy Landscapes as a Tool to Integrate GPCR Structure, Dynamics, and Function." Physiology 25(5): 293-303.
[22] Launay, G., S. Téletchéa, F. Wade, E. Pajot-Augy, J.-F. Gibrat and G. Sanz (2012). "Automatic modeling of mammalian olfactory receptors and docking of odorants." Protein Engineering, Design and Selection 25(8): 377-386. [23] Li, Y. D., Z. Peterlin, J. H. Ho, T. Yarnitzky, M. T. Liu, M.
[24] Wolf, S., L. Gelis, S. Dorrich, H. Hatt and P. Kraft (2017). "Evidence for a shape-based recognition of odorants in vivo in the human nose from an analysis of the molecular mechanism of lily-of-the-valley odorants detection in the Lilial and Bourgeonal family using the C/Si/Ge/Sn switch strategy." Plos One 12(8): 22.
[25] Zhang, L., Y. Yuan, T. Ren, Y. Guo, C. Li and X. Pu (2018). Shining Light on Molecular Mechanism for Odor-selectivity of CNT-immobilized Olfactory Receptor.
[26] Saberi, M. and H. Seyed-allaei (2016). "Odorant receptors of Drosophila are sensitive to the molecular volume of odorants." Scientific Reports 6: 25103.
[27] Jang, S. and C. Hyeon (2017). "Kinetic Model for the Activation of Mammalian Olfactory Receptor." J Phys Chem B 121(6): 1304-1311.
[28] Reddy, G., J. D. Zak, M. Vergassola and V. N. Murthy (2018). "Antagonism in olfactory receptor neurons and its implications for the perception of odor mixtures." Elife 7. [29] Block, E., S. Jang, H. Matsunami, S. Sekharan, B. Dethier, M.
Z. Ertem, S. Gundala, Y. Pan, S. Li, Z. Li, S. N. Lodge, M. Ozbil, H. Jiang, S. F. Penalba, V. S. Batista and H. Zhuang (2015). "Implausibility of the vibrational theory of olfaction." Proc Natl Acad Sci U S A 112(21): E2766-2774.
[30] Turin, L., S. Gane, D. Georganakis, K. Maniati and E. M. C. Skoulakis (2015). "Plausibility of the vibrational theory of olfaction." Proc Nat Acad Sci 112(25): E3154.
[31] Haffenden, L. J. W., V. A. Yaylayan and J. Fortin (2001). "Investigation of vibrational theory of olfaction with variously labelled benzaldehydes." Food Chemistry 73(1): 67-72.
[32] Franco, M. I., L. Turin, A. Mershin and E. M. Skoulakis (2011). "Molecular vibration-sensing component in Drosophila melanogaster olfaction." Proc Natl Acad Sci U S A 108(9): 3797-3802.
[33] Gane, S., D. Georganakis, K. Maniati, M. Vamvakias, N. Ragoussis, E. M. Skoulakis and L. Turin (2013). "Molecular vibration-sensing component in human olfaction." PLoS One 8(1): e55780.
[34] Gronenberg, W., A. Raikhelkar, E. Abshire, J. Stevens, E. Epstein, K. Loyola, M. Rauscher and S. Buchmann (2014). "Honeybees (Apis mellifera) learn to discriminate the smell of organic compounds from their respective deuterated isotopomers." Proceedings of the Royal Society B: Biological Sciences 281(1778): 20133089.
[35] Maniati, K., K. J. Haralambous, L. Turin and E. M. C. Skoulakis (2017). "Vibrational Detection of Odorant Functional Groups by Drosophila melanogaster." Eneuro 4(5).
[36] Scott, J. W. and P. E. Scott-Johnson (2002). "The electroolfactogram: A review of its history and uses." Microscopy Research and Technique 58(3): 152-160. [37] Viswaprakash, N., J. C. Dennis, L. Globa, O. Pustovyy, E. M.
Josephson, P. Kanju, E. E. Morrison and V. Vodyanoy (2009). "Enhancement of Odorant-Induced Response in Olfactory Receptor Neurons by Zinc Nanoparticles." Chem. Senses 34: 547-557.
[38] Jia, H., O. M. Pustovyy, P. Waggoner, R. J. Beyers, J. Schumacher, C. Wildey, J. Barrett, E. Morrison, N. Salibi, T. S. Denney, V. J. Vodyanoy and G. Deshpande (2014). "Functional MRI of the olfactory system in conscious dogs." PLoS One 9(1): e86362.
[39] Viswaprakash, N., E. M. Josephson, J. C. Dennis, S. Yilma, E. E. Morrison and V. J. Vodyanoy (2010). "Odorant Response Kinetics from Cultured Mouse Olfactory Epithelium at Different Ages in vitro." Cells Tissues Organs 192(6): 361-373.
[40] Gupta, S. and A. Auerbach (2011). "Temperature Dependence of Acetylcholine Receptor Channels Activated by Different Agonists." Biophysical Journal 100(4): 895-903. [41] Nache, V., J. Kusch, C. Biskup, E. Schulz, T. Zimmer, V. Hagen and K. Benndorf (2008). "Thermodynamics of activation gating in olfactory-type cyclic nucleotide-gated (CNGA2) channels." Biophysical Journal 95(6): 2750-2758. [42] Brauchi, S., P. Orio and R. Latorre (2004). "Clues to
understanding cold sensation: Thermodynamics and electrophysiological analysis of the cold receptor TRPM8." Proceedings of the National Academy of Sciences of the United States of America 101(43): 15494-15499.
[43] Segel, I. (1975). Biochemical Calculations. New York, john Wiley & Sons.
[44] Eyring, H., S. Lin and S. Lin (1980). Basic chemical kinetics. New York, John Wiley & Sons.
[45] Tinoco, I. J., K. Sauer and J. C. Wang (1978). Physical Chemistry, Principles and Applications in Biological Sciences. Englewood Cliffs, NJ, Prentice-Hall, Inc.
[46] Anslyn, E. V. and D. A. Dougherty (2006). Modern Physical Organic Chemistry, University Science Books.
[47] Lapid, H. and T. Hummel (2013). "Recording Odor-Evoked Response Potentials at the Human Olfactory Epithelium." Chemical Senses 38(1): 3-17.
[48] Lapid, H., H. S. Seo, B. Schuster, E. Schneidman, Y. Roth, D. Harel, N. Sobel and T. Hummel (2009). "Odorant Concentration Dependence in Electroolfactograms Recorded From the Human Olfactory Epithelium." Journal of Neurophysiology 102(4): 2121-2130.
[49] Lapid, H., S. Shushan, A. Plotkin, H. Voet, Y. Roth, T. Hummel, E. Schneidman and N. Sobel (2011). "Neural activity at the human olfactory epithelium reflects olfactory perception." Nat Neurosci 14(11): 1455-1461.
[50] Doty, R. L., D. S. Kreiss and R. E. Frye (1990). "Human Odor Intensity Perception - Correlation with Frog Epithelial Adenylate-Cyclase Activity and Transepithelial Voltage Response." Brain Research 527(1): 130-134.
[51] Koce, A. and T. Valentincic (2000). "The amplitude of the electroolfactogram in catfish correlates with the proportion of responding ORNs." Pflugers Archiv-European Journal of Physiology 439(3): R171-R172.
[53] Fox, J. M., M. Zhao, M. J. Fink, K. Kang and G. M. Whitesides (2018). "The Molecular Origin of Enthalpy/Entropy Compensation in Biomolecular Recognition." Annu Rev Biophys.
[54] Shirley, S. G., C. J. Robinson and G. H. Dodd (1987). "The influence of temperature and membrane-fluidity changes on the olfactory adenylate cyclase of the rat." Biochem J 245(2): 613-616.
[55] Brokx, R. D., M. M. Lopez, H. J. Vogel and G. I. Makhatadze (2001). "Energetics of target peptide binding by calmodulin reveals different modes of binding." J Biol Chem 276(17): 14083-14091.
[56] Portman, K. L., J. Long, S. Carr, L. Briand, D. J. Winzor, M. S. Searle and D. J. Scott (2014). "Enthalpy/Entropy Compensation Effects from Cavity Desolvation Underpin Broad Ligand Binding Selectivity for Rat Odorant Binding Protein 3." Biochemistry 53(14): 2371-2379.
[57] Yon-Kahn, J. and G. Herve (2010). Molecular and cellular enzymology. London New York, Springer Heidelberg Dordrcht.
[58] Lansky, P. and W. M. Getz (2001). "Receptor heterogeneity and its effect on sensitivity and coding range in olfactory sensory neurons." Bulletin of Mathematical Biology 63(5): 885-908.