ISSN: 2231-5381
http://www.ijettjournal.org
Page 5
Temperature as a Factor Determining on Water
Electrolysis
Wilmer Licona Buelvas1, Karen Cecilia Pájaro Ávila2, Álvaro Realpe Jiménez, Ph.D 3
1,2
Research Scholar, 3 Professors
Chemical Engineering Program, Engineering Faculty University of Cartagena
Cartagena de Indias, Colombia
Abstract— The increase of the consumption of fossil fuels has led to its unsustainability for being a non-renewable energy, and to be the main cause of greenhouse gases. This has stimulated the search of new sources of energy, such as hydrogen which is friendly to the environment and can meet energy demands presented today.
In this investigation, the effect of the temperature and concentration of the electrolyte on the production of hydrogen, was studied, using an electrolyzer of 7 plates. The results indicate that at high temperatures, there is low electrical potentials in the cell, this indicates high ionic conductivity, low electrical resistance and consequently highr efficiency of the electrolysis process.
Keywords— Electrolysis of water, hydrogen, renewable energy,
electric potential
I. INTRODUCTION
Nowadays the use of the fossil fuels has originated serious problems to our ecosystems, conducing the need to use sources renewables energy, which appear as an alternative to reduce this impact [1].
Much of the CO2 emissions come from fossil fuel combustion presented in the cars [2]. However, the high fuel consumption and a considerable increase in its price have become unsustainable for these fuels, thus encouraging an incessant search of new technologies, to reduce consumption in cars [3]. It is as well, such as hydrogen is converted into an option to replace fossil fuels as a primary energy source, since this is the most abundant element in the universe, it is clean, safe and pollution risks are almost non-existent, since the hydrogen energy does not produce radioactivity, and its contribution to the greenhouse effect is minimal [4].
The electrolysis of water to produce hydrogen has been studied since 100 years ago [5-7]. However, in recent years, the hydrogen has been considered as one of the best solutions to produce clean and safe energy, thereby encouraging the development of future applications in electrolyzer [8].
Despite all the research that turns around the hydrogen production, only 5% of hydrogen is produced from the electrolysis of water due the high consumption of electrical
energy required to separate the water molecule, because water is a very stable molecule [9].
The objective of this research is to design, build and implementation of an electrolyzer in order to study the effect of temperature, concentration and electric current in hydrogen production.
II. METHODOLOGY
A. Materials and equipments
The electrolyzer was designed by means of electrochemical and thermodynamic relations; it consists of 7 plates in Steel 316. The electrolyzer was connected to a power source, model - HY 1803 D-MASTECH, that was fixed between 0-3 amps. A water bath was used to control the temperature at 30, 45 and 60 ° C, and for the subsequent collection of hydrogen was used a beaker of 150 mL, that was submerged upside down in a container. The collection time of hydrogen was measured with a stopwatch. The sodium hydroxide solution was used as electrolyte in different concentrations to 1, 2, 3, 4 and 5 percent.
B. Experimental Process
Figure 1 shows the experimental assembly used to determine the relation of temperature with production of hydrogen. The electrolyzer of plates (F) was immersed in water bath to keep different temperature values. The electrolyzer is connected to the variable power source (B) and it is fed with electrolyte stored in a container (E).
ISSN: 2231-5381
http://www.ijettjournal.org
Page 6
Hydrogen and oxygen generated in the electrolyzer iscollected into a beaker (H) submerged upside down in a bowl (I) that contains water, which allows to determine the volume of gas formed by displacement of water in the beaker.
C. Experimental Design
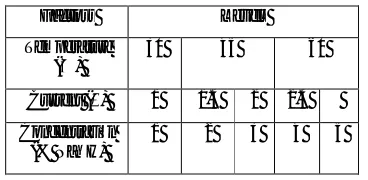
A multifactor design was made with two duplicate. The factors are temperature, concentration of the electrolyte, and current, at the levels indicated in table 1. The dependent variable is the hydrogen mass flow.
TABLE1.FACTORSANDLEVELS
Factors Levels
Temperature (℃)
30 45 60
Current (Å) 1 1.5 2 2.5
Concentratión (% NaOH)
1 2 3 4 5
III. MATHEMATICAL MODEL OF ELECTROLYZER The mathematical model of the plate electrolyzer was developed considering thermodynamic and electrochemical phenomena, to calculate the area of the electrode. It was assumed temperature and pressure of reference of 298.15 K and 1 bar, respectively. The values of the enthalpy and entropy of the water, hydrogen and oxygen at temperature and pressure of reference, are shown in table 2.
TABLE2. VALUESOFENTHALPYANDENTROPYOF FORMATION.
Molecule ΔHº (j/mol) Δsº (j/mol K) water -285800 69,9
Hydrogen 0 130,6
Oxygen 0 205
Reference: Marangio, 2008
The following equations are used to calculate the entropy and enthalpy of reaction at a temperature different than the reference [10]:
( ) = +4
5 +
2
3 +
4
7 (1)
( , ) = + 4 + 2 +4
3 − (2)
where the values of the constants , , and are given in Table 3.
TABLE3.VALUESOFCOEFICIENTSOFENTHALPYYENTROPY
Molecule aj bj cj dj
Water 180 -85,4 15,6 -0,85
Hydrogen 79,5 -26,3 4,23 -0,19
Oxygen 10,3 5,4 -0,18 0
Reference: Marangio, 2008
It was estimated the values of enthalpy and entropy change at the work temperature, from data at reference conditions (see Table 2).
∆ =∆ − ∆ =∆ +1
2∆ − ∆ (3)
∆ =∆ − ∆ =∆ +1
2∆ − ∆ (4)
From equation (5), the Gibbs energy is calculated using (3) and (4).
∆ =∆ + ∆ (5)
Then, by using Faraday`s constant ( = 96485.3383 ) determined thermoneutral voltage ( ) given by the equation (6).
The enthalpy change given in equation (5), is replaced in equation (7), to calculate the reversible voltage ( ).
= ∆
2∗ (6)
= ∆
2∗ (7)
Considering the production of H2, it proceeds to calculate the current (I) required for the electrolysis using the equation (8).
= (8)
where: = 0.95 is Faraday`s efficiency, = 1is the number of cells in the electrolyzer, is the molar flow of hydrogen , and = 2 is the electrons charge.
Now, through the Butler-Volmer equation, we can calculate the overvoltage at the anode and cathode, as follows:
, = arcsinh2
,
(9)
, = arcsinh2
,
ISSN: 2231-5381
http://www.ijettjournal.org
Page 7
where is the temperature of the cathode, is thetemperature of the anode, , is the reference current in the
cathode, and , is the reference current at the anode. For the
calculation of diffusion overvoltage, the Nernst equation is used (11).
= ln
.
(11)
where , y are the partial pressures of water vapor, hydrogen and oxygen, respectively.
The working voltage is equal to the ideal voltage ( ) plus the overvoltage given by equations (9), (10) and (11).
= + , + , + (12)
By using the previous equations the total area of the electrolyzer is calculated by (13).
Area = I i (13)
IV.RESULTS AND DISCUSSION
A. Effect of temperature on the voltage of the electrolytic cell
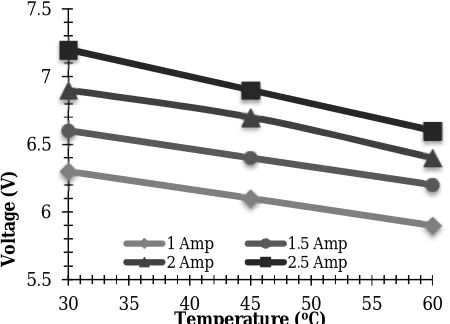
The figures 2, 3 and 4 show the effect of temperature on the cell voltage at different currents. Temperature is one of the most important variables in the electrolysis, because the efficiency increases with increasing the temperature [11], due to the required potential to produce the same quantity of hydrogen is reduced considerably.
Figure 2 Relation of the electrical potential with the temperature at different currents and a concentration of 1 %.
Figure 3 Relationship of the electrical potential with the temperature at c different currents and a concentration of 3%.
Figure 4 Relationship of the electrical potential with the temperature at different currents and a concentration of 5%
The demand of the required voltage decreases with increasing temperature at concentrations of 1, 3 and 5% [12], causing the cell more efficient, since it needs less energy for the same hydrogen production. This behavior is due to the rupture potential of a molecule decreases with increasing temperature.
In addition, it is expected that the ionic conductivity of the electrolyte, and the reaction surface increase with increasing temperature, so this phenomenon can be predictable in the realization of the electrolysis [13]. Also, it is observed that voltage decreases with increasing the electrolyte concentration, this is due to the electrolyte ions decrease the cell resistance.
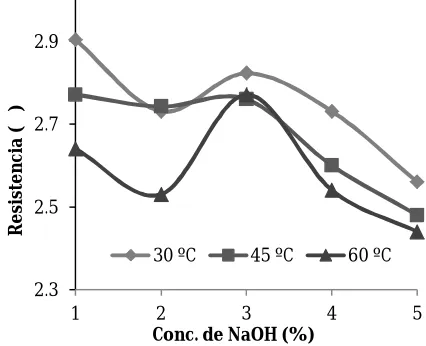
B. Effect of the Concentration and Temperature of the electrolyte on the Resistance
Figures 5, 6, 7 and 8 show the effect of the concentration and the temperature of the electrolyte on the resistance of the electrolytic cell.
5.5 6 6.5 7 7.5
30 35 40 45 50 55 60
Vo
lt
a
g
e
(
V)
Temperature (oC)
1 Amp 1.5 Amp 2 Amp 2.5 Amp
5.6 6.1 6.6 7.1
30 35 40 45 50 55 60
Vo
lt
a
g
e
(
V
)
Temperature (oC)
1 Amp 1.5 Amp 2 Amp 2.5 Amp
5.3 5.8 6.3
30 35 40 45 50 55 60
Vo
lt
a
g
e
(
V)
Temperature (oC)
ISSN: 2231-5381
http://www.ijettjournal.org
Page 8
Figure 5 Variation of the electrical resistance with the concentration of NaOHat different temperatures and 1 amp.
Figure 6 Variation of the electrical resistance with the concentration of NaOH at different temperatures and 1,5 amp.
Figure 7 Variation of the electrical resistance with the concentration of NaOH at different temperatures and 2 amp.
Figure 8 Variation of the electrical resistance with the concentration of NaOH at different temperatures and 2,5 amp.
The results show that the resistance decreases with increasing concentration and temperature of electrolyte at different currents studied. This is explained, through the mass transfer phenomena that occur in the electrolyzer, since an increase in temperature favors the molecular collisions between ions of the electrolyte. High number of molecular collisions facilitates the passage of an electric current through the electrolyte; therefore, the resistance decreases by increasing the efficiency of the electrolytic cell. Furthermore, the electrical conductivity of the stainless steel electrodes increases with increasing temperature, by favoring the passage of current and thus reducing the electrical resistance [14].
C. Effect of Cell Temperature on Hydrogen Generation
Figure 9 shows the effect of temperature on hydrogen production at different currents and a concentration of NaOH 1%. The mass flow of hydrogen increases with increasing temperature of the electrolytic, due to the reaction potential decreases for division of the water molecule [15]. In addition, the surface reaction and ionic conductivity of the electrolyte increases with temperature [16]. The same behavior was similar at all electrolyte concentrations.
5.2 5.4 5.6 5.8 6 6.2 6.4 6.6
1 2 3 4 5
R
e
si
st
a
n
ce
(
Ω
)
Conc. de NaOH (%)
30 ºC 45 ºC 60 ºC
3 3.2 3.4 3.6 3.8 4 4.2 4.4 4.6
1 2 3 4 5
R
e
si
st
a
n
ce
(
Ω
)
Conc. de NaOH (%)
30 ºC 45 ºC 60 ºC
2.1 2.3 2.5 2.7 2.9 3.1 3.3 3.5 3.7
1 2 3 4 5
R
e
si
st
a
n
ce
(
Ω
)
Conc. de NaOH (%)
30 ºC 45 ºC 60 ºC
2.3 2.5 2.7 2.9
1 2 3 4 5
R
e
si
st
e
n
ci
a
(
Ω
)
Conc. de NaOH (%)
ISSN: 2231-5381
http://www.ijettjournal.org
Page 9
Figure 9 Relation of mass flow with temperature at differentcurrents and a concentration of 1 % of NaOH.
Also, the mass flow of hydrogen increases with increasing the electrical current, according to Faraday`s law (see Eq. 14), which says that “The mass of substance that is deposited, or is released in an electrode, is directly proportional to the amount of electric current flowing through the electrolyte "[17].
= × (14)
where I is the current intensity, t is the time, F is Faraday´s constant, M is the molar mass of the substance and n is the number of electrons.
V.CONCLUSIONS
An electrolyzer of plates in stainless steel was designed and built based on the thermodynamic and electrochemical principles. The mass flow of hydrogen increases with increasing the temperature and concentration of electrolyte due to the high temperature decreases the potential required to rupture of the water molecule. Also, the resistance decreases with increasing concentration and temperature of electrolyte at different currents studied. This is explained, through the mass transfer phenomena that occur in the electrolyzer, since an increase in temperature favors the molecular collisions between ions of the electrolyte.
ACKNOWLEDGMENT
The authors thank the University of Cartagena for financing the research project.
REFERENCES
[1] Uned Biblioteca (2013). Energía y Desarrollo sostenible. [On line], Available: http://www.uned.es/biblioteca/energiarenovable3/ impacto.htm consultado en 2013-06-23.
[2] T.N. Vezirog, lu, I. Gürkan, M.M. Padki. (1989) “Remediation of greenhouse problem through replacement of fossil fuels by hydrogen” International Journal of Hydrogen Energy, Volume 14, Issue 4, Pages 257-266.
[3] Sabine Fuss, Szolgayová Jana; “ Fuel price and technological uncertainty in a real options model for electricity planning” ; Energy, Volume 87, Issue 9, Pages 2938-2944; September 2010.
[4] Winter Carl-Jochen. (2009) “Hydrogen energy — Abundant, efficient, clean: A debate over the energy-system-of-change” International Journal of Hydrogen Energy, Volume 34, Issue 14, Supplement 1, Pages S1-S52.
[5] JW. Richards “Secondary reactions in electrolysis”. Journal of the Franklin Institute1901; 152(9):201–24.
[6] JW. Richards “Modern theories of electrolysis”. Journal of the Franklin Institute1896; 141(3):192–218.
[7] JW. Richards “The electrolysis of water”. Journal of the Franklin Institute1905;160(11):377–90.
[8] V.I. Grigoriev, V.N. Porembsky, Fateev; “Pure hydrogen production by PEM electrolysis for hydrogen energy”; “Hydrogen Energy and Plasma Technology Institute”; Volume 31, Issue 2, February 2006, ISBN 0360-3199; Rusia
[9] FN Lin, WI Moore, SW Walker. “Economics of liquid hydrogen from water electrolysis”. International Journal of Hydrogen Energy 1985; 10:811–5.
[10] F. Marangio*, M. Santarelli, M. Calı. (2008) Theoretical model and experimental analysis of a high pressure PEM water electrolyser for hydrogen production”.
[11] Gómez Clara et Al; “conductividad de las soluciones electrolíticas”; [en línea]. 2010 [February 28, 2013] Disponible en la web: http://ocw.uv.es/ciencias/1-1/teo_conductividad_nuevo.pdf
[12] S.K Mazloomi, Nasri Sulaiman; “Influencing factors of water electrolysis electrical efficiency”;Volume 16, Issue 6, August 2012.Malaysia.
[13] Gómez Clara et Al; “conductividad de las soluciones electrolíticas”; [en línea]. 2010 [February 28, 2013].Disponible en la web: http://ocw.uv.es/ciencias/1-1/teo_conductividad_nuevo.pdf
[14] [Online]. 2010 [February 28, 2013]. Available: http://www.cenidet.edu.mx/subaca/web-ktro/submenus/investigacion/ tesis/9%20Nestor%20Ramirez%20Morales.pdf
[15] V.M Nikolic, G.S Tasic, A.D Maksic, D.P Saponjic, S.M Miulovic, M.P Marceta. Raising efficiency of hydrogen generation from alkaline water electrolysis – Energy saving. International Journal of Hydrogen Energy 2010;35(22):12369–73
[16] J Udagawa, P Aguiar, NP Brandon. Hydrogen production through steam electrolysis: model-based steady state performance of a cathode-supported intermediate temperature
[Online]. 2011[May 20, 2013]. Available: http://www.educa. madrid.org/web/ies.isidradeguzman.alcala/departamentos/fisica/temas/r edox/faraday.html].
0.0E+00 1.0E-05 2.0E-05 3.0E-05 4.0E-05 5.0E-05 6.0E-05 7.0E-05 8.0E-05 9.0E-05
25 30 35 40 45 50 55 60 65
M
a
ss
f
lo
w
o
f
H
2
Temperature (oC)