[Jain et al., 5(6): June, 2018]
ISSN 2349-0292
Impact Factor 3.802
GLOBAL JOURNAL OF ADVANCED ENGINEERING TECHNOLOGIES AND
SCIENCES
PERFORMANCE OF DIFFERENT FADING CHANNEL OVER SVD DETECTION
BASED SPECTRUM SENSING IN COGNITIVE RADIO NETWORK
Er Shraddha Jain*, Er Deepak Pancholi, Er Pawan Sharma
*1
M.tec Student, Lakshmi Narain College of Technology (LNCT), Indore, India
2Assistant Professor, Lakshmi Narain College of Technology (LNCT), Indore, India
3Assistant Professor, Lakshmi Narain College of Technology (LNCT), Indore, India
DOI: 10.5281/zenodo.1286747
ABSTRACT
One of the most challenging issues in cognitive radio system is to sense the spectrum environment accurately and determine whether the primary user is active, or not over a specific band reliably. So, there is need of good sensing algorithm have the property have low sensing time, ability to detect primary signal at low SNR. In this paper, Singular Value Decomposition (SVD) spectrum sensing methodologies for cognitive radio are studied over different fading channels as AWGN channel, Rayleigth fading channel, Rician fading channel & Nakagami Fading Channel Energy detection method is classical method of detection but it requires knowledge of noise power for signal detection and it gives poor performance under low SNR The proposed detection method overcomes the drawback of energy detection method. SVD does not require the knowledge of signal properties, channel and uncertainty noise parameter in such a way it is suitable for blind spectrum sensing. Threshold is computed using random matrix theory (RMT) is exploited to formulate the detection method depending on sample covariance matrix of received signal. The Singular Value Decomposition (SVD) based detection algorithm is simulated by using MATLAB Software Platform. In this Paper, Simulation Result shows that SVD algorithm using Covariance matrix approach over Nakagami fading channel gives approx. 0.025 to 0.035 better performance of detection at low SNR with compare to reference AWGN & other different fading channel.
KEYWORDS: Spectrum sensing, Energy detection, RMT, Eigen Value, fading channels, Probability of detection, probability of false alarm).
INTRODUCTION
Digital Communication & Wireless technology is one of the fastest growing technologies in the past two decades [1]. The present era is an era of technology in which Everyone is surrounded with devices which utilize wireless radio transceivers for communications with each other, such as mobile phones (2G/3G/4G cellular networks), Internet, laptops (Wi-Fi/Bluetooth), FM & AM radios, Television, etc. and it play a crucial role in our daily life. In other word, we can say that communication take place one of essential part in our life. The frequency lies in the range of 3 Hz to 3 THz are referred as the radio frequencies. Radio Spectrum is used in various wireless communication systems and services as satellite-based, mobile, fixed and low power communication systems. Generally, wireless communication operates on frequency that lies in the frequency band of 3MHz to 30GHz. Radio spectrum is very precious and limited natural resources so spectrum management, controlling issues and monitoring are the primary objective of wireless communication worlds globally and nationally. Most countries have their own regulatory agencies and which is supported by respective governments that are responsible for the utilization of the spectrum.
[Jain et al., 5(6): June, 2018]
ISSN 2349-0292
Impact Factor 3.802
In responding to the idea of cognitive radio (CR) coined by Joseph Mitola [2], IEEE 802.22 working Group was formed in 2004. IEEE 802.22 standard is known as Cognitive radio standard, because it contains cognitive features. Federal Communications Commission (FCC) coordinates the usages of radio spectrum resources and the regulation of radio emissions. In order to maintain the primary (licensed) users right to interference free operation, the secondary users which are unlicensed user need to regularly sense the allocated band and reliably detect the presence of the licenced user signals in this way, secondary user need to have cognitive radio capability. As an example, in the IEEE 802.22 standard, the secondary users need to detect the TV and wireless microphone signals and upon their detection, they are required to vacate the channel within two seconds [3]. For TV primary signals, a probability of detection of 90% and a probability of false alarm of 10% should be maintained [4]. Therefore, spectrum sensing plays an important role in the cognitive radio technology to prevent interference to the primary users and to reliably and quickly find the spectrum hole and utilizes the opportunity.METHOD OF SPECTRUM SENSING IN COGNITIVE RADIO
A cognitive radio does not have capability to detect spectrum hole itself within the radio environment simultaneously, therefore good spectrum sensing method is required which able to senses radio spectrum within small duration of time. There are various methods of spectrum sensing. In literature the spectrum sensing techniques have been classified in the following three categories [5].
Figure 1. Methods of Spectrum Sensing [5]
WIRELESS REGIONAL AREA NETWORK (WRAN)
The IEEE 802.22 is standard for wireless regional area network (WRAN), whose object is to use cognitive radio techniques in its development. IEEE 802.22 based wireless regional area network devices sense TV channels and identify transmission opportunities. The functional requirement of this standard is at least 90% probability of detection and at most 10% probability of false alarm for TV signal [6]. Basically, at geographical areas it gives high data rate services by utilizing the unused TV channels in the VHF/UHF frequency range [7]. This standard is capable to operate in various TV channel bandwidth, 6, 7 and 8MHz [8].
Table 1: Comparison between IEEE 802.22 and other IEEE 802.xx standards in term of transmission distance, data rate and frequency range [9]
S.no IEEE Standards
IEEE 802.xx Transmission distance Data rate Frequency range
1 WPAN IEEE802.15 20-50m 10Mbps 2.4GHz
2 WLAN IEEE802.11 Less than 150m 11/54Mbps 2.4 /5GHz
3 WMAN IEEE802.16 1-2km 54Mbps 5 GHz
4 WRAN IEEE802.22 Less than 100km 27/32Mbps 54-862 MHz
[Jain et al., 5(6): June, 2018]
ISSN 2349-0292
Impact Factor 3.802
respectively. The WMAN is also called as WiMAX. The appropriate ranges of Pd and Pf for spectrum sensing technique are (90-95%), and (1-10%) respectively [10].RELATED WORK
Cognitive radio as a new approach for efficient utilization of electromagnetic spectrum concept is given by S. Haykins [11]. The cognitive radio is defined as an intelligent wireless communication system that is aware of its environment and use the methodology of understanding by building to learn from the environment and adopt to statistical variations in the input stimuli having to primary objectives in mind, first one is highly reliable communication whenever and wherever needed and the second one is efficient utilization of radio spectrum. In these paper [12] authors discuss about the interference temperature as new metrics for the quantification and management of interference. The paper [13] addresses three fundamental cognitive task, radio scan analysis, channel-state estimation and predictive modelling and transmission power control and dynamic spectrum management. The concept Eigen value is use for spectrum sensing in CR is first proposed by Y. Zeng and Y.-C. Liang in 2007, in method the ratio of Maximum-minimum eigenvalue is used for detection [46] further more implementation in 2009, concept of maximum eigenvalue for spectrum sensing in CR [14]. Basically, in this method the correlation among the received signal is catches by the covariance matrix. Result show performance of MED is better than energy detection for correlated signals. To set the threshold and obtain the probability of false alarm Random matrix theorise is used. They performed verification and simulation of this technique by use of wireless microphone signal and independent and identically distributed signal. Singular value decomposition (SVD) method is used to detect the presence of wireless signal this concept is implement by Mohd. Hasbullah Omar, Suhaidi Hassan, Angela Amphawan, and Shahrudin Awang Nor in 2011 [15]. SVD method is used to find maximum and minimum eigenvalues. On comparing with ED, it gives the better result in low SNR. CR must avoid the interference from primary user and any other signal. SVD of data matrix is help to obtain dominant singular values in which the existence of other signal can also be detected.
SYSTEM MODEL & METHEDOLOGY
For system model, We consider a system of one cognitive radio (CR), one primary user (PU) and fusion center (FC).When a signal from PU is transmitted, the received signal by the CR for the detection of PU can be modeled under two hypotheses (H0 & H1), is gives as follows
The two hypotheses are given respectively by formula as follows:
𝐻0: 𝑥(𝑛) = 𝜂(𝑛) (4.1)
𝐻1: 𝑥(𝑛) = 𝑠̅(𝑛) + 𝜂(𝑛) (4.2)
Where 𝑠̅(𝑛) is the received signal samples including the effects of path loss, multipath fading and time dispersion, and 𝜂(𝑛) is the received white noise assumed to be identically distributed signal, and with mean zero and variance 𝜎𝜂2.
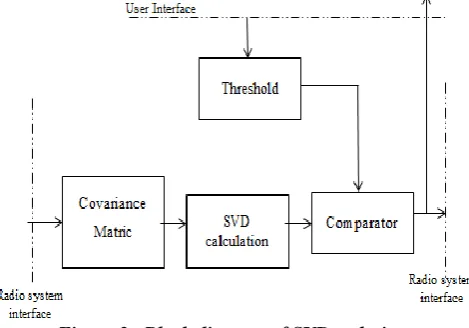
Figure 2. Block diagram of SVD technique
The received signal at receiver can be given as:
𝑥(𝑛) = ∑ ℎ(𝑘)𝑠𝑗(𝑛 − 𝑘) + 𝑁
𝑘=0
[Jain et al., 5(6): June, 2018]
ISSN 2349-0292
Impact Factor 3.802
At receiver the discrete signal denoted by 𝑥(𝑛), s(n) is the source signal, ℎ(𝑘) is channel response and order of the channel is 𝑁. η(n) are the noise samples.Fading Channel
A fading channel is classified from communication channel that having different fading attributes during the signal transmission [16, 17]. The fading is occurring due to the multipath propagation. At the receiver, Signal arrives from different paths, which have different delays and variation in path gains [18]. These paths of propagation could be constructive or may be destructive. The received signal is nothing but the algebraic summation of the different paths of propagation Therefore, some of the paths are added and the other are subtracted [19]. In mobile radio channels, to describe the statistical time varying nature of the received envelope of an individual multipath component or envelope of a flat fading signal, or the Rayleigh fading channel is used. It is well known that the envelope of the sum of two quadrature Gaussian noise signals obeys a Rayleigh distribution.
𝑓(𝛾) = 1 𝛾exp (−
𝛾
𝛾), 𝛾 ≥ 0 (4.3)
When there is a dominant stationary signal component present, such as a line-of-sight propagation path then, the small-scale fading envelope distribution is Rician. In such a situation, random multipath components arriving at different angles are superimposed on a stationary dominant signal [22]. At the envelope detector output of an, this has the effect of adding a dc component to the random multipath. Just as for the case of detection of, a sine wave in thermal noise, the effect of a dominant signal received with many weaker multipath signals gives increases to the Rician distribution. In contrast to the Rayleigh & Rician distribution, In which a single parameter that can be used to match the fading-channel statistics, the Nakagami is a two-parameter distribution, with the parameters the Nakagami distribution can be used to model fading-channel conditions that are either more or less severe than the Rayleigh distribution and it includes the Rayleigh distribution as a special case. m is the Nakagami-m fading parameter, describing the severity of fading; m < 1 suggests severe fading, while m >1 indicates less severe fading.
Considering a subsample L of consecutive outputs are as follow
𝑋(𝑛) = [𝑥(𝑛), 𝑥(𝑛 − 1), … … . . , 𝑥(𝑛 − 𝐿 + 1)]T (4.4) 𝜂(𝑛) = [𝜂(𝑛), 𝜂(𝑛 − 1), … … . . , 𝜂(𝑛 − 𝐿 + 1)]T (4.5) 𝑆(𝑛) = [𝑠(𝑛), 𝑠𝑥(𝑛 − 1), … … . . , 𝑠(𝑛 − 𝐿 + 1)]T (4.6) As we get,
𝑋(𝑛) = 𝐻 𝑆(𝑛) + 𝜂(𝑛) (4.7)
Where H is matrix of row L and column is N+L.
𝐻 = [
∑1,1𝑥 ⋯ ∑1,𝑛𝑥
⋮ ⋱ ⋱
∑𝑛,1𝑥 ⋯ ∑𝑛,𝑛𝑥
] (4.8)
The following assumption is to be assumed on the basis of statistical properties of transmitted symbols a channel noise
1) Noise is white
2) transmitted signal and Noise are uncorrelated
As 𝑅𝑥(𝑁𝑠) is the sample covariance matrix of the received signal 𝑅𝑥(𝑁𝑠) =
1
𝑁𝑠∑ 𝑥̂(𝑛)𝑥̂
†𝐻(𝑛) 𝐿−2+𝑁𝑠
𝑛=𝐿−1 (4.9)
Where L is the smoothing factor, Ns is the number of samples
Factorization of matrix is the help of singular value decomposition; SVD determines original data in a coordinate system in which covariance matrix is diagonal. In SVD, Q can be factorized as
𝑄 = 𝑈 ∑ 𝑉T (4.11)
Where
UT U = IM×M (4.12)
VVH = IL×L (4.13)
[Jain et al., 5(6): June, 2018]
ISSN 2349-0292
Impact Factor 3.802
Eigenvalue represent the variance in the element as λmax is the largest Eigenvalue and λmin denote the smallest Eigenvalue. The ratio of maximum to minimum Eigenvalue (λmax/ λmin) is termed as Eigen ratio.Threshold Determination
The detection threshold in terms of desired probability of false alarm is calculated by using the results of the theorem in [22] and [23], as follows (in our case, M = l)
𝛾 = ((√𝑁𝑠+ √𝐿)2/(√𝑁𝑠+ √𝐿)2) × (1 +
(√𝑁𝑠+√𝐿) 2 3
(𝑁𝑠𝐿) . 𝐹1
−1(1 − 𝑃
𝑓)) (4.14)
Where
𝑁𝑠 = Number of Samples 𝐿 = Smoothing factor 𝑃𝑓 = Probability of false alarm 𝑃𝑑 = Probability of detection 𝛾 = Threshold value
𝐹−1 Represent the inverse of cumulative distribution function (CDF) of Tracy widom distribution of order 1 [21]. Tracy widom distribution is Probability distribution function of the largest Eigenvalues of random Hermitian matrix.
Algorithm
1) Initialization of Parameter which include Number of samples (N), Smoothing factor (L) and Probability of false alarm (Pf).
2) Construct Covariance matrix, Q given in equation (4.8).
3) Decomposition of matrix, as given in equation (4.10), by using Singular Value Decomposition (SVD), to form equation Q = U ∑VT.
4) After decomposition, Obtain Maximum and minimum Eigenvalue of matrix as represent as λmax and λmin.
5) Compute threshold value, ℽ by using equation (4.14)
6) Calculate the ratio of maximum Eigenvalue to minimum Eigenvalue and compare it with the threshold. If (λ_max)/(λ_min)> ℽ it means primary signal is present otherwise the signal is absent.
RESULT ANALYSIS AND DISCUSSION
The results are averaged over minimum 2000 test using Monte-Carlo Simulation written in MATLAB. Simulation results are taken using BPSK modulated random primary signal. Independent and identically distributed noise samples with Gaussian distribution are used. It assumed that during the period of samples, channel is not changing. To find the threshold, we require Probability of false alarm (Pf) less than or equal to 0.1 and Probability of detection (Pd) greater than or equal to 0.9 is required to find the value of threshold as, it required by IEEE 802.22 standards.
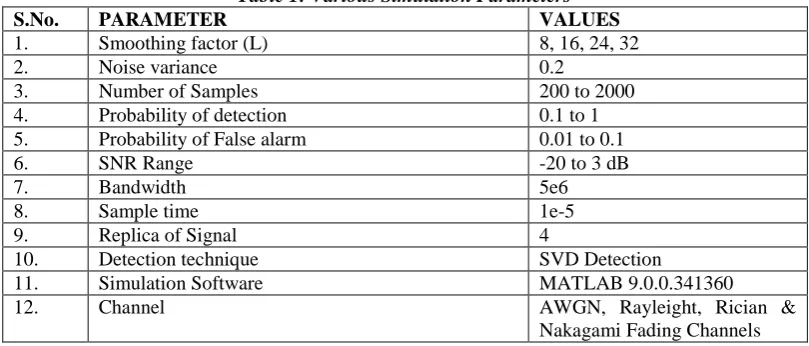
Table 1: Various Simulation Parameters
S.No. PARAMETER VALUES
1. Smoothing factor (L) 8, 16, 24, 32
2. Noise variance 0.2
3. Number of Samples 200 to 2000
4. Probability of detection 0.1 to 1
5. Probability of False alarm 0.01 to 0.1
6. SNR Range -20 to 3 dB
7. Bandwidth 5e6
8. Sample time 1e-5
9. Replica of Signal 4
10. Detection technique SVD Detection
11. Simulation Software MATLAB 9.0.0.341360
12. Channel AWGN, Rayleight, Rician &
[Jain et al., 5(6): June, 2018]
ISSN 2349-0292
Impact Factor 3.802
Figure 6.6 depicts Receiver operating characteristic (ROC) curve of SVD detection method with Probability of detection versus Probability of false alarm at different fading channel. For Smoothing factor = 16, Number of Sample = 1500.Figure 3: ROC for Probability of detection (Pd) Versus Probability of false alarm (Pf) at over different fading Channel.
ROC curve in Figure 3, it clear that Pd values is higher at 0.1 Pf by using Nakagami fading channel, But initially when the value of Pf is 0.01 the we get the good Probability of Detection over Rician channel. As while increase the value of probability of false alarm the there will be variation in different values as we receive good performance at Nakagami channel on increases the value of Pf whereas at 0.04 value of Pf the response of Nakagami fading channel is very weak whereas AWGN Channel performance is good.
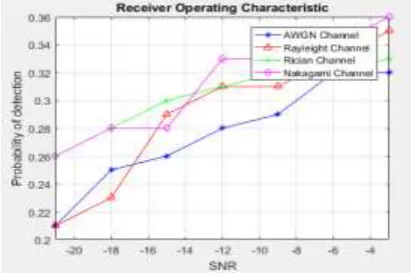
Figure 6.6 depicts Receiver operating characteristic (ROC) curve of SVD detection method by using factorization covariance matrix with Probability of detection versus SNR at different fading channel. For Smoothing factor = 16, Number of Sample = 500.
Figure 4: ROC for Probability of detection (Pd) Versus SNR at over different fading Channel.
ROC curve in Figure 4, it clear that performance of the Nakagami fading channel & Rician fading channel using SVD technique performance over a value of SNR is -21dB. As lowering the value of SNR at -18 dB we get the good response of AWGN Channel as comparing to Rayleight channel. At the value of SNR is -14dB we get good response of Nakagami Fading channel as compare to other fading channel whereas, we get the same value of Pd over Rayleight and Rician channel and get lower response over AWGN channel. On decreasing the value of SNR approx -4dB we get good performance at Nakagami Channel approx. 0.0195 as compare to Rayleight fading channel and we get poor response over AWGN fading Channel over 0.05 value of Pd on comparing with Nakagami Fading channel
CONCLUSION
[Jain et al., 5(6): June, 2018]
ISSN 2349-0292
Impact Factor 3.802
different wireless channel. Here, we get good response of Nakagami fading channel at lower SNR whereas on higher SNR Values AWGN Wireless channel performance is good. Similarly, on higher values of probability of false alarm values we get good Performance approx 0.36 value of Probability of detection. At lower value of Probability of false alarm as 0.01 we get Rician fading channel performance is best below 0.025 values of Probability of detection among all fading channel.REFERENCES
[1] Maya Chouksey and A. K. Srivastava, “A Technological Development of Wireless Communication after World War," International Journal of Wireless Communications and Networking, June 2012.
[2] J. Mitola III, "Cognitive Radio: An integrated agent architecture for software radio architecture," Ph. D Dissertation, Royal Institute of Technology (KTH), 2000.
[3] W.-Y. L. I. F. Akyildiz, M. C. Vuran, and S. Mohantly, "Next Generation/dynamic spectrum access cognitive radiowireless network: A survey," Elsevier Computer Networks Journal, vol. 50, 2006. pp. 2127-2159,
[4] I.F. Akyildiz, Y. Altunbasak, F. Fekri, R. Sivakumar, “AdaptNet: adaptive protocol suite for next generation wireless internet”, IEEE Communications Magazine 42, 2004, pp. 128–138.
[5] Pawan Sharma, Angeeta Hirwe, “Simulation Platform for Performance Analysis of Energy Detection based Spectrum Sensing Technique in Cognitive Radio”, International Journal of Innovative Research in Computer and Communication Engineering (IJIRCCE)”, Vol. 4, Issue 7, July 2016,
[6] O. A. Alghamdi, M. A. Abu-Rgheff and M. Z. Ahmed, "MTM Parameters Optimization for 64-FFT Cognitive Radio Spectrum Sensing using Monte Carlo Simulation," in Proc. The Second International Conference on Emerging Network Intelligence, 2010, pp. 107-113.
[7] C. Stevenson, G. Chouinard, L. Zhongding, H. Wendong, S. Shellhammer and W. Caldwell, "IEEE 802.22: The first cognitive radio wireless regional area network standard," IEEE Communications Magazine, vol. 47, pp. 130-138, 2009.
[8] C. Stevenson, G. Chouinard, L. Zhongding, H. Wendong, S. Shellhammer and W. Caldwell, "IEEE 802.22: The first cognitive radio wireless regional area network standard," IEEE Communications Magazine, vol. 47, pp. 130-138, 2009.
[9] Mohd. Hasbullah Omar, Suhaidi Hassan, Angela Amphawan and Shahrudin Awang Nor, “SVD-Based Signal Detector for Cognitive Radio Networks”, in Proceedings of 2011 UK Sim 13th International Conference on Modelling and Simulation, University of Cambridge (Emmanuel College), United Kingdom, 30 March - 1 April 2011, pp. 513 – 517.
[10]Y. Zeng, Choo Leng Koh, and Y. Liang, "Maximum eigenvalue detection: theory and application," IEEE International Conference on Communications, Beijing, 2008, pp. 4160-4164.
[11]Mohd. Hasbullah Omar, Suhaidi Hassan and Shahrudin Awang Nor, “Eigenvalue-Based Signal Detectors Performance Comparison”, to appear in the Proceeding of the 17th Asia-Pacific Conference on Communications (APCC2011), 2-5 October 2011, Kota Kinabalu, Sabah, Malaysia.
[12]Rohitha Ujjinimatad and Siddarama R Patil, “Sensing Algorithm for Cognitive Radio Networks based on Random Data Matrix”, International Journal of Computer Applications (0975 – 8887) Volume 62– No.3, January 2013
[13]Min Jia, Xue Wang, Fang Ben, Qing Guo, Xuemai Gu, “An improved spectrum sensing algorithm based on energy detection and covariance detection” IEEE/CIC International Conference on Communications in China (ICCC), 2015
[14]Y. Zeng and Y.-C. Liang, “Maximum-minimum eigenvalue detection for cognitive radio,” in IEEE Eighteenth International Symposium on Personal, Indoor and Mobile Radio Communications PIMRC, Sep. 2007, pp. 1 – 5.
[15]Zhai xuping, pan Jianguo, “energy-Detection based Spectrum Sensing for cognitive radio,” Iet conference on wireless, Mobile and Sensor Networks, , 2007, pp. 944–947.
[16]F. F. Digham, M. S Alouini and M.K Simon, “On the energy detection of unknown signals over fading channels”, Proc. IEEE International Conference on Communication (ICC003), pp. 3575-3579, May 2003.
[17]Y. Zeng, Choo Leng Koh, and Y. Liang, "Maximum eigenvalue detection: theory and application," IEEE International Conference on Communications, Beijing, 2008, pp. 4160-4164.
[Jain et al., 5(6): June, 2018]
ISSN 2349-0292
Impact Factor 3.802
[19]Min Jia, Xue Wang, Fang Ben, Qing Guo, Xuemai Gu, “An improved spectrum sensing algorithm based on energy detection and covariance detection” IEEE/CIC International Conference on Communications in China (ICCC), 2015[20]S.Lavanya, B.Sindhuja, M.A.Bhagyaveni, "Implementation of an Adaptive Spectrum Sensing Technique In Cognitive Radio Networks" presented in a International level conference on International Conference on Computing and Communications Technologies (ICCCT), organised by IEEE, 2015, India.
[21]R. Zhang and Y.-C. Liang, “Exploiting multi-antennas for opportunistic spectrum shar-ing in cognitive radio networks," Selected Topics in Signal Processing, IEEE Journal of, vol. 2, no. 1, pp. 88-102, 2008. [22]Z. Han, R. Fan, and H. Jiang, “Replacement of spectrum sensing in cognitive radio," Wireless
Communications, IEEE Transactions on, vol. 8, no. 6, pp. 2819-2826, 2009.
[23] E. Visotsky, S. Kuffner, and R. Peterson, “On collaborative detection of TV transmissions in support of dynamic spectrum sharing,”1st IEEE International. Symposium on New Frontiers in Dynamic Spectrum Access Networks, No. 11, pp. 338–345, 2005.
![Figure 1. Methods of Spectrum Sensing [5]](https://thumb-us.123doks.com/thumbv2/123dok_us/8682878.1733917/2.595.140.450.326.502/figure-methods-spectrum-sensing.webp)