Evaluation of Kinetic Models of Beta-Carotene
Adsorption from Palm Oil onto Bentonite
Tabligh Permana, Erliza Noor, Yandra Arkeman
Abstract: In this work, the adsorption of beta-carotene from palm oil onto bentonite was performed under 35 bleaching conditions that were made using a combination of 4 variables. They were varying concentrations of beta-carotene in palm oil (300, 400, 500 mg/kg), varying dosage percentages of bentonite (0.5, 1.25, 2 %), varying surface areas of bentonite (190, 225, 275 m2/g), and varying temperatures (50, 80, 110 oC). The experimental data was analyzed by using several kinetic models (intra-particle diffusion, Elovich equation, pseudo-first order, and pseudo-second order). Kinetic parameters, coefficient of determination, and adsorption curve of models were evaluated to determine the best kinetic model to describe the adsorption of beta-carotene from palm oil onto bentonite. The experimental data was described accurately by the intra-particle adsorption model only at the adsorption process with low adsorption rate. The Elovich equation model showed a tendency to give negative values of sorption capacity at the beginning period of the adsorption process with low initial adsorption rate. At the adsorption process with low and medium adsorption rate constants, the adsorption curve of the pseudo-first order model showed a tendency to move away from the experimental data, but the pseudo-second order model still followed the experimental data. The pseudo-second order model was the most appropriate kinetic model to describe the adsorption of beta-carotene from palm oil onto bentonite.
Index Terms: Bentonite, Beta-carotene, Kinetic model, Palm oil.
————————————————————
1.
Introduction
Palm oil has an orange-red color appearance, due its natural pigments content,10, 7. Carotenoids are the pigments that are responsible for the color of palm oil, and is present mainly as beta-carotene,19. Cooking oil is the main product of the palm oil industry. The carotenoids content can influence the appearance, flavor, and stability of prepared foods,11. The bleaching process is an important step in the palm oil industry,10. It can removes the unwanted beta-carotene from palm oil,8 and produces a more acceptable color of cooking oil. The bleaching process can be performed more effectively by using the adsorption method,21,11. The bleaching process commonly uses activated bentonite to adsorb the beta-carotene in palm oil,25,14,8,15,24,6. Bentonite is activated through acid activation process, and it produces the desired changes in the physicochemical properties of bentonite,16,2,17. The adsorption of beta-carotene onto bentonite can be analyzed using a kinetic model, and it is affected by temperature, dosage percentage of bentonite, concentration of beta-carotene, and the bentonite’s properties,10,25,1,19. Some authors have concluded that the adsorption followed the pseudo-first order kinetic model,25, the zero order kinetic model,19,5, and also the pseudo-second order kinetic model,3. The differences in results on the authors’ conclusion were because they applied these processes under heavily limited and specific conditions. A kinetic model can be used to create the model to control the bleaching process. The use of appropriate process parameters (temperatures, dosage percentage of bentonite, and bentonite specification) can control the bleaching process.
The application of inappropriate kinetic model to the process control model can lead to the failure of or an inefficient bleaching process. Based on these conditions, it is important to determine the most appropriate kinetic model that can analyze the bleaching process for all conditions of the bleaching process. The objective of this work is to determine a kinetic model that can analyze the bleaching process for all the conditions of the bleaching process (temperature, dosage percentage of bentonite, concentration of beta-carotene, and bentonite properties). Various commercial activated bentonite were chosen as they are the most common industrially-used adsorptive agent used. The pseudo-first order kinetic model, the intra-particle diffusion model, the pseudo-second order kinetic model, and the Elovich equation were used to evaluate the kinetics of the bleaching process.
2.
Material and Method
Adsorbent
Three commercials calcium bentonite (PT. Clariant) were selected and used for the adsorption experiments. They were already activated by the manufacturer, and have varying surface areas (190 m2/g, 225 m2/g, 275 m2/g).
Palm oil preparation
The commercial refined and bleached palm oil was mixed with beta-carotene (Puritan’s Pride) to make 3 different concentrations of beta-carotene in palm oil (300, 400, 500 mg/kg). The mixtures were put in an ultrasonic bath at room temperature (Ultrasonic bath, Sonorex super 10P, Bandelin), and stirred periodically until completely homogenized.
Batch adsorption
Batch adsorption experiments were carried out in pyrex glass container under constant stirring at 35 combinations of factors (temperature, dosage of bentonite, concentration of beta-carotene, and surface area of bentonite), and at atmospheric pressure. The combinations were obtained from a box-bahnken design and 6 additional combinations. Table 1 represents the 35 combinations of factors as the conditions of batch adsorption experiment. The experiments were performed at three different value for each factor: temperature
_____________________________________
Tabligh Permana, MSc Student, Department of
Agro-Industrial Technology, Bogor Agricultural University, Bogor, Indonesia.
E-mail: tabligh.permana@gmail.com
Prof. Dr. Ir. Erliza Noor, Department of Agro-Industrial
Technology, Bogor Agricultural University, Bogor, Indonesia.
Prof. Dr. Ir. Yandra Arkeman, MEng., Department of
Agro-Industrial Technology, Bogor Agricultural
24 𝑇 (50, 80, 110oC), dosage percentage of bentonite 𝑑𝑏 (0.5,
1.25, 2%), beta-carotene concentrations 𝐶 (300, 400, 500 mg/kg), and surface area of bentonite 𝑏𝑞 (190, 225, 275 m2/g). Batch adsorption experiments were performed using the following procedures: heating 50 grams of beta-carotene solution in palm oil up to the selected temperature under constant stirring at 350 rpm (heating plate, Cimarec; mixer with paddle agitator, IKA RW 20.n); the addition of bentonite; maintaining this heating condition for 50 minutes at the selected temperature; sampling of 1ml of each mixture every 10 minutes during the heating; separating the bentonite using a centrifuge (Centrifuge, minispin Corning); then measuring the beta-carotene concentration of samples. For the analysis of adsorption kinetic, time zero was considered at the time of bentonite addition. Duplicate experiments were performed according to the previous procedure. The adsorbate concentrations in solid phase 𝑞 (g/kg) at time 𝑡, and at equilibrium 𝑞 (g/kg) were calculated from following mass balance equations,25.
𝑞 = (( ( ))) 1000⁄ (1)
𝑞 = (( ( ))) 1000⁄ (2)
Where 𝑊 = the weight of experimented palm oil (kg) 𝑊 = the weight of bentonite (kg)
𝐶 = the initial concentration of beta-carotene (mg/kg)
𝐶 = the concentration of beta-carotene in liquid phase at time 𝑡 (mg/kg)
𝐶 = the concentration of beta-carotene in liquid phase at equilibrium (mg/kg)
Analytical measurement
The concentration of beta-carotene was determined by measuring the absorbance of samples at the maximum absorption wavelength (460nm). The samples were then diluted and homogenized using refined and bleached palm oil as the solvent, and using the solvent as the blank sample (Spectrophotometer Genesys 10 S, Thermo-Scientific, USA).
Modeling
The experimental data was analyzed using 4 kinetic models (the pseudo-first order rate equation, the pseudo-second order rate equation, the intra-particle diffusion, and the Elovich equation). The analysis was performed by using the OriginPro 2017 and Levenberg-Marquardt interactive method. The analysis produced a kinetic curve, several kinetic parameters, and coefficients of determination (𝑅 ) for each kinetic model at a 95% confidence interval.
3.
Results
Adsorption kinetic model
Adsorption kinetic of beta-carotene in palm oil onto bentonite can be described by kinetic models. Some authors stated that the kinetic should be described by zero order rate equation, and others said the kinetic can be efficiently described by the pseudo-first order rate equation, the pseudo-second order rate equation, or other kinetic models. Kinetic model of beta-carotene adsorption can be used to analyze the performance
of adsorption process, and it is influenced by some factors. They are beta-carotene concentration, dosage of bentonite, temperature, properties of bentonite, and duration of process. The application of right kinetic model can give the right mechanism of beta-carotene adsorption, and lead the process to be efficiently controlled. In this work, the adsorption kinetic was analyzed by 4 kinetic models (the pseudo-first order, the pseudo-second order, the intra particle diffusion, the Elovich equation). The zero order rate equation was neglected to analyze the adsorption kinetic, since some authors have stated that the kinetic can be described by zero order rate equation at some particular conditions. This decision was carried out considering that every adsorption process has to reach the equilibrium state, and zero order rate equation cannot accommodate the equilibrium state. Model of the pseudo-first order equation, 12,26,24 :
𝑞 = 𝑞 (1 − 𝐸𝑋𝑃 (−𝑘 𝑡)) (3)
Model of the pseudo-second order equation, 12,27,25 :
𝑞 = (4)
Model of the intra-particle diffusion, 25 :
𝑞 = 𝑘 𝑡 + 𝐶 (5)
Model of the Elovich equation,3 :
𝑞 = ln(𝛼𝛽) + ln(𝑡) (6)
Where 𝑞 = sorption capacity at time 𝑡 (g beta-carotene/kg bentonite)
𝑞 = sorption capacity (g beta-carotene/kg bentonite) at equilibrium
𝑡 = time of process (minute)
𝑘 = the pseudo-first order constant (minute-1)
𝑘 = the pseudo-second order constant (kg/g.min-1)
𝑘 = the intra-particle diffusion rate constant (g/kg.minute0.5)
𝐶 = the boundary layer thickness (g/kg) 𝛼 = initial adsorption rate (g/kg.minute) 𝛽 = Elovich desorption constant (g/kg)
Kinetic parameters
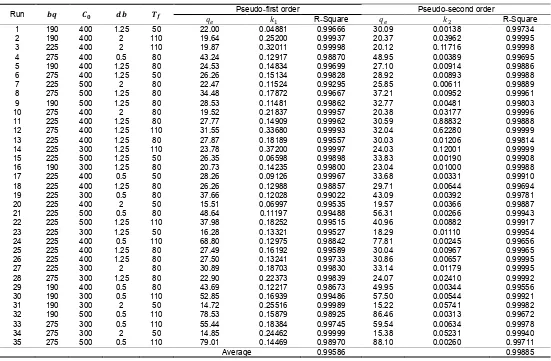
Elovich equation), 𝐾 and 𝐶 (the intra-particle diffusion). Table 1 presents the kinetic parameters for the pseudo-first order and the pseudo-second order at all experiments. The adsorption capability of bentonite is increasing with increasing of surface area of bentonite, temperature, and bentonite dosage,1,3. Table 1 shows the value of 𝑞 from pseudo-second order for all experiments were bigger than the pseudo-first order. The pseudo-first order and the pseudo-second order model showed the same result for run 35 as the experiment that had the biggest value of 𝑞 , 79.01 g/kg and 88.10 g/kg, respectively. These results show that the combination of high value of surface area, temperature, beta-carotene concentration, and low value of bentonite dosage can produce a high value of 𝑞 . The first order and the pseudo-second order models also showed the same result for run 31 as the experiment that had the lowest value of 𝑞 , 14.72 g/kg and 15.22 g/kg, respectively. These results show that the combination of low value of surface area, beta-carotene concentration, temperature, and high value of bentonite dosage can produce low values of 𝑞 . Run 1 obtained the lowest values of rate constant for both the pseudo-first order and the pseudo-second order, 0.04881 minute-1 for 𝑘 and 0.00138 kg/g.minute-1 for 𝑘 . These results mean that combinations of low values of surface area, bentonite dosage, temperature, and high value of beta-carotene concentration can produce low values of rate constant for both the pseudo-first order and the pseudo-second order. For the pseudo-pseudo-first order, the highest value of rate constant obtained from run 14, the value of 𝑘 was 0.372 minute-1. The results show that the adsorption process of palm oil with low beta-carotene concentration, high temperature, and high bentonite dosage will produce high values of 𝑘 . For the pseudo-second order model, the highest value of rate constant was obtained from run 11, 0.88832 kg/g.minute, it was a different run if compared to the pseudo-first order. Table 2 presents the kinetic parameters for the Elovich equation and the intra-particle diffusion at all experiments. For the Elovich equation, the values of α increased as the surface area, bentonite dosage, and temperature increased. For the intra-particle diffusion, run 35 obtained the highest value of diffusion rate constant, 11.46 g/kg.minute0.5. It means that a high concentration of beta-carotene in palm oil, a high temperature of process, a large surface area of bentonite, and a low dosage percentage of bentonite can produce high values of 𝑘 . Overall, intra-particle diffusion model showed a lower correlation to the experimental data.
Analysis of kinetic models
The average of coefficient determinations for the pseudo-first order, the pseudo-second order, and the Elovich equation were high (R2 = 0.99586, 0.9985, 0.9989, respectively). For the intra-particle diffusion model, the average of coefficient determination was low (R2 = 0.86728). The pseudo-first order, the pseudo-second order, and the Elovich equation models showed higher correlations to the experimental data, but the intra-particle diffusion model showed lower correlations to the experimental data. Fig. 1 presents the intra-particle adsorption curves of run 1, 15, 17, and 20. The intra-particle diffusion model showed high correlations to the experimental data at run 1, 15, 17, and 20 (fig. 1). Since the average of coefficient determination of the intra-particle diffusion model was low, it showed high values of coefficient determination at run 1, 15, 17, and 20 (0.9936, 0.98323, 0.94664, and 0.9839,
respectively) (Table 2). These results were carried out from the experiments that were performed at low temperature, 50 oC (Table 2). This means, the intra-particle diffusion model had a tendency to show a high correlation to the experimental data only at low temperature/energy.
Fig. 1. Adsorption curve of the intra-particle diffusion model at run 1, 15, 17, and 20.
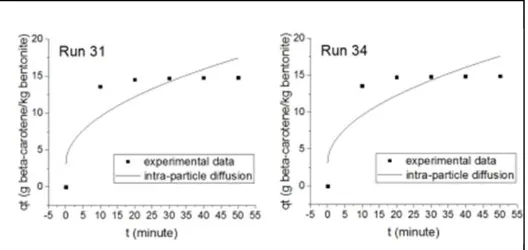
Since the adsorption processes were applied at 50 oC, run 31 and 34 showed low correlations to the experimental data (fig. 2). Run 31 and 34 produced low coefficients of determination (0.76992 and 0.77165, respectively) (Table 2). Run 31 and 34 were performed at low concentration of beta-carotene in palm oil, and high bentonite dosage. These conditions led the process of adsorption relatively faster, and the intra-particle diffusion can not describe the processes anymore, since they were performed at low temperature.
Fig. 2. Adsorption curves of the intra-particle diffusion model at run 31 and 34.
26 experiments that were performed at 80 oC and 110 oC showed
low coefficients of determination (Table 2).
Fig. 3. Adsorption curves of the intra-particle diffusion model at run 2, 12, 14, and 28.
Fig. 4. Adsorption curves of the Elovich equation model at run 1, 15, 20, and 17.
Due to the intra-particle diffusion is only a limited part of adsorption mechanism (beginning period of adsorption process), the results of analysis for the intra-particle diffusion were varied,25,4. At beginning period, the adsorption rate is controlled by film-diffusion step first,26,27, then intra-particle diffusion mechanism will take the control until certain period,22. When the kinetic rate of adsorption process is high, the process will be controlled by more than one adsorption mechanism at several steps, and the adsorption process cannot be described by intra-particle diffusion model anymore,20. Based on the results of analysis, due to its
limitation to describe some runs of experiment, the intra-particle diffusion model was not the most appropriate kinetic model to describe the adsorption of beta-carotene onto bentonite. The Elovich equation model showed the opposite result to the intra-particle diffusion model. Fig. 4 shows the Elovich equation model produced negative values of 𝑞 at the beginning period of adsorption processes of run 1, 15, 17, and 20. Since the coefficient of determinations at run 1, 15, 17, and 20 were high (0.99753, 0.99793, 0.99639, and 0.99933, respectively) (Table 2), due to its tendency to give negative value of 𝑞 at the beginning period (fig. 4), the Elovich equation cannot efficiently describe the experimental data at run 1, 15, 17, and 20. These results were in contrary to the analysis results for the intra-particle diffusion model. Table 2 shows run 1, 15, 17, and 20 were the experiments that produced the lowest value of initial adsorption rate than others (2.41, 4.30, 10.50, and 2.91 g/kg.minute, respectively). The adsorption processes with low initial adsorption rate were produced negative values of 𝑞 at the beginning period of adsorption process.
Fig. 5. Adsorption curves of the Elovich equation model at run 2, 12, 14, and 31.
Fig. 5 presents the Elovich equation adsorption curves at run 2, 12, 14, and 31. They showed a good correlation to the experimental data, but at the beginning period showed the adsorption process performed very fast (fig. 5). Table 2 shows run 2, 12, 14, and 31 produces very high values of initial adsorption rate (2.11E6, 2.69E16, 3.26E21, and 9.01E6 g/kg.minute, respectively), and also high values of coefficient of determination (0.99964, 0.9999, 0.99993, 0.99924, respectively). Very high value of initial adsorption rate means beta-carotene was adsorbed onto bentonite very fast and immediately reached the equilibrium period (fig. 5). The same pattern of adsorption curves for the Elovich equation model also happened to other runs with high values of initial adsorption rate. Run 2, 12, and 14 were performed at high temperature and medium or high dosage of bentonite, these conditions led the adsorption processes to produce a higher adsorption rate. Run 31 was performed at low temperature,
but the use of high dosage percentage of bentonite, large surface area of bentonite, and low concentration of beta-carotene were led the adsorption processes to perform the adsorption as fast as the processes that were performed at high temperature.
Fig 6. Adsorption curves of the Elovich equation model at run 5, 11, 16, and 32.
Fig 7. Adsorption curves of the pseudo-first order model and the pseudo-second order model at run 3, 12, 14, and 31.
Fig. 6 shows run 5, 11, 16, and 32 had a perfect correlation to the experimental data at the whole periods of experiments. Run 5, 11, 16, and 32 also showed high values of coefficient of determination (0.99759, 0.99589, 0.99839, and 0.99923, respectively). The same results also happened to other runs that had initial adsorption rate 16.77 until 179.76 g/kg.minute. The runs with initial adsorption rate less than 16.77 g/kg.minute produced adsorption curves with negative value
of 𝑞 at beginning period, and the runs with initial adsorption rate more than 179.76 g/kg.minute produced adsorption curves that immediately reached the equilibrium condition at beginning period. Based on the limitation ability of the Elovich equation model to describe the experimental data at some runs, the Elovich equation model was not the most appropriate model to describe the adsorption of beta-carotene onto bentonite. For the Elovich equation model, the adsorption mechanism is divided into 2 steps. The first step is the initial adsorption at beginning period, this step is influenced by the initial adsorption rate and the Elovich desorption constant. The second step is chemisorption diffusion, this step is influenced only by the Elovich desorption constant within time. The first step is the shorter period, and the second step is the longer period. The analysis of experimental data by the Elovich equation produced a high average value of coefficient of determination. These results of analysis show that the adsorption of beta-carotene onto bentonite was followed the chemisorption mechanism.
Fig. 8. Adsorption curves of the pseudo-first order model and the pseudo-second order model at run 21, 24, 32, and 35.
28 around the first 10 minutes of processes (fig. 7). At the
beginning period, the pseudo-second order adsorption curves were increased faster than the pseudo-first order adsorption curves. The pseudo-first order and the pseudo-second order had a tendency to show a big difference value of 𝑞 at the adsorption process with medium or low value of adsorption rate constant. Run 21, 24, 32, and 34 had relatively medium values of adsorption rate, and showed a big difference value of 𝑞 between the pseudo-first order and the pseudo-second order models (7.67, 9.01, 7.93, and 9.09 g/kg, respectively). These conditions can be seen at the adsorption curves in fig. 8. At 50 minute of process, the adsorption curves of the pseudo-first order were began to move away from the
experimental data, and had a tendency to reach the equilibrium condition. At the same time, the adsorption curves of the pseudo-second order were still followed the experimental data. These conditions caused the value of 𝑞 from the pseudo-second order model always bigger than the pseudo-first order model. Based on these conditions, the pseudo-first order had a limitation to describe the adsorption of beta-carotene from palm oil onto bentonite, since the pseudo-first order model produced a high average value of coefficient of determination. According to these conditions too, the pseudo-second order was the most appropriate model to describe the adsorption of beta-carotene from palm oil onto bentonite.
Table 1. Kinetics Parameters of Adsorption of Beta-carotene onto Bentonite According to the Pseudo-first Order, and the Pseudo-second Order at Several Combinations of Factors.
Run 𝒃𝒒 𝑪 𝒅𝒃 𝑻 Pseudo-first order Pseudo-second order
𝑞 𝑘 R-Square 𝑞 𝑘 R-Square
1 190 400 1.25 50 22.00 0.04881 0.99666 30.09 0.00138 0.99734
2 190 400 2 110 19.64 0.25200 0.99937 20.37 0.03962 0.99995
3 225 400 2 110 19.87 0.32011 0.99998 20.12 0.11716 0.99998
4 275 400 0.5 80 43.24 0.12917 0.98870 48.95 0.00389 0.99695
5 190 400 1.25 80 24.53 0.14834 0.99699 27.10 0.00914 0.99886
6 275 400 1.25 50 26.26 0.15134 0.99828 28.92 0.00893 0.99988
7 225 500 2 80 22.47 0.11524 0.99295 25.85 0.00611 0.99889
8 275 500 1.25 80 34.48 0.17872 0.99667 37.21 0.00952 0.99961
9 190 500 1.25 80 28.53 0.11481 0.99862 32.77 0.00481 0.99803
10 275 400 2 80 19.52 0.21837 0.99957 20.38 0.03177 0.99996
11 225 400 1.25 80 27.77 0.14909 0.99962 30.59 0.88832 0.99888
12 275 400 1.25 110 31.55 0.33680 0.99993 32.04 0.62280 0.99999
13 225 400 1.25 80 27.87 0.18189 0.99557 30.03 0.01206 0.99814
14 225 300 1.25 110 23.78 0.37200 0.99997 24.03 0.12001 0.99999
15 225 500 1.25 50 26.35 0.06598 0.99898 33.83 0.00190 0.99908
16 190 300 1.25 80 20.73 0.14235 0.99800 23.04 0.01000 0.99988
17 225 400 0.5 50 28.26 0.09126 0.99967 33.68 0.00331 0.99910
18 225 400 1.25 80 26.26 0.12988 0.98857 29.71 0.00644 0.99694
19 225 300 0.5 80 37.66 0.12028 0.99022 43.09 0.00392 0.99781
20 225 400 2 50 15.51 0.06997 0.99535 19.57 0.00366 0.99887
21 225 500 0.5 80 48.64 0.11197 0.99488 56.31 0.00266 0.99943
22 225 500 1.25 110 37.98 0.18252 0.99515 40.96 0.00882 0.99917
23 225 300 1.25 50 16.28 0.13321 0.99527 18.29 0.01110 0.99954
24 225 400 0.5 110 68.80 0.12975 0.98842 77.81 0.00245 0.99656
25 225 400 1.25 80 27.49 0.16192 0.99589 30.04 0.00967 0.99965
26 225 400 1.25 80 27.50 0.13241 0.99733 30.86 0.00657 0.99995
27 225 300 2 80 30.89 0.18703 0.99830 33.14 0.01179 0.99995
28 275 300 1.25 80 22.90 0.22373 0.99839 24.07 0.02410 0.99992
29 190 400 0.5 80 43.69 0.12217 0.98673 49.95 0.00344 0.99556
30 190 300 0.5 110 52.85 0.16939 0.99486 57.50 0.00544 0.99921
31 190 300 2 50 14.72 0.25516 0.99989 15.22 0.05741 0.99982
32 190 500 0.5 110 78.53 0.15879 0.98925 86.46 0.00313 0.99672
33 275 300 0.5 110 55.44 0.18384 0.99745 59.54 0.00634 0.99978
34 275 300 2 50 14.85 0.24462 0.99999 15.38 0.05231 0.99940
35 275 500 0.5 110 79.01 0.14469 0.98970 88.10 0.00260 0.99711
Average 0.99586 0.99885
Table 2. Kinetics Parameters of Adsorption of Beta-carotene onto Bentonite According to the Elovich Equation, and the Intra-particle Diffusion at Several Combinations of Factors.
Run 𝒃𝒒 𝑪 𝒅𝒃 𝑻 Elovich equation Intra-particle diffusion
α β R-Square 𝒌𝒅 𝑪 R-Square
1 190 400 1.25 50 2.41 0.13812 0.99753 2.94 0.06254 0.99360
2 190 400 2 110 2.11E6 0.91913 0.99964 2.72 4.08017 0.77721
3 225 400 2 110 2.69E19 2.47595 0.99990 2.77 4.04916 0.76339
4 275 400 0.5 80 53.30 0.12979 0.99951 6.29 5.55154 0.90992
5 190 400 1.25 80 85.25 0.27845 0.99759 3.50 3.77000 0.87064
6 275 400 1.25 50 108.29 0.26742 0.99844 3.76 4.03831 0.86909
7 225 500 2 80 16.77 0.22451 0.99977 3.27 2.58000 0.92490
Run 𝒃𝒒 𝑪 𝒅𝒃 𝑻 Elovich equation Intra-particle diffusion
α β R-Square 𝒌𝒅 𝑪 R-Square
9 190 500 1.25 80 21.46 0.17791 0.99454 4.09 3.41242 0.91150
10 275 400 2 80 2.24E5 0.80490 0.99953 2.74 3.73000 0.79807
11 225 400 1.25 80 113.03 0.25281 0.99589 3.96 4.29000 0.86434
12 275 400 1.25 110 6.62E16 1.34994 0.99990 4.29 7.15000 0.73997
13 225 400 1.25 80 646.80 0.32077 0.99820 3.96 4.15760 0.84039
14 225 300 1.25 110 3.26E21 2.26610 0.99993 3.22 5.48300 0.73150
15 225 500 1.25 50 4.30 0.12665 0.99793 3.74 0.94142 0.98323
16 190 300 1.25 80 52.74 0.31205 0.99839 2.98 3.02322 0.88081
17 225 400 0.5 50 10.50 0.15097 0.99639 4.11 2.32553 0.94664
18 225 400 1.25 80 33.09 0.21478 0.99959 3.81 3.41000 0.90858
19 225 300 0.5 80 33.09 0.13877 0.99987 5.49 4.49725 0.92104
20 225 400 2 50 2.91 0.22610 0.99933 2.21 0.70818 0.98390
21 225 500 0.5 80 31.45 0.10020 0.99944 7.08 5.38551 0.92886
22 225 500 1.25 110 827.07 0.23327 0.99989 5.41 6.53413 0.84370
23 225 300 1.25 50 25.53 0.36299 0.99942 2.35 2.21312 0.89734
24 225 400 0.5 110 84.32 0.08157 0.99932 9.98 8.75505 0.91176
25 225 400 1.25 80 189.69 0.27625 0.99972 3.92 4.43825 0.86065
26 225 400 1.25 80 44.24 0.21670 0.99870 3.92 3.83817 0.89214
27 225 300 2 80 1243.58 0.30894 0.99933 4.44 5.38126 0.83502
28 275 300 1.25 80 2.72E4 0.57802 0.99986 3.20 4.47381 0.80147
29 190 400 0.5 80 39.84 0.12041 0.99862 6.37 5.24133 0.92049
30 190 300 0.5 110 510.61 0.15058 0.99987 7.56 8.66207 0.85684
31 190 300 2 50 9.01E6 1.35318 0.99924 2.03 3.10511 0.76992
32 190 500 0.5 110 344.94 0.08979 0.99923 11.34 12.00267 0.87558
33 275 300 0.5 110 1814.67 0.16835 0.99940 7.86 9.75758 0.83507
34 275 300 2 50 3.28E6 1.26994 0.99848 2.04 3.10939 0.77165
35 275 500 0.5 110 179.76 0.07983 0.99946 11.46 11.20827 0.89173
Average 0.99890 0.86728
The adsorption mechanism that works at the pseudo-first order and the pseudo-second order is different. At the pseudo-first order, the first step of the adsorption mechanism is interaction between active sites at the surface of bentonite with molecules of beta-carotene. This step is a fast process. Then the molecules of beta-carotene at the surface will be physically absorbed to bentonite particle, and this step takes time longer than the first step,18. Due to this condition, so the adsorption kinetic is controlled by the second step,9. The rate of physical adsorption of beta-carotene onto bentonite is influenced by the adsorption capacity of bentonite, instead of the concentration of beta-carotene in palm oil,25. The adsorption rate at the first step of adsorption for the pseudo-second order is highly influenced by the concentration of beta-carotene in palm oil. At the next step, the adsorption rate is influenced by the activity of bentonite’s active sites,25. The adsorption process for the pseudo-second order follows the chemisorption mechanism,19. More active the bentonite to chemically interact with beta-carotene molecules, the adsorption rate will be higher, and that activity is increasing as the increase of temperature,13. At this point, the diffusion mechanism will be taken over by chemisorption mechanism,25. The acidity level of bentonite, and the number of hydrogen ion active sites at molecule structure of bentonite are influencing the activity of bentonite in chemisorption process,23. The physical interaction between the molecules of beta-carotene and the active sites at the surface of bentonite is occurred through the hydrogen bond. The chemical interaction between carbon atoms at the molecules of beta-carotene and the oxygen at the surface of bentonite is occurred through the covalent bond,9.
4.
Conclusion
Results presented in this work conclude that the intra-particle diffusion model can describe the adsorption of beta-carotene onto bentonite only at the process with low adsorption rate, and it shows low average value of coefficient of determination. The adsorption curves of the Elovich equation model show high correlation to the experimental data, and high average value of coefficient of determination, but they have a tendency to produce negative values of sorption capacity at the beginning period of adsorption processes with low initial adsorption rate. At high temperature and bentonite dosage, the Elovich equation model produces very high initial adsorption rate, and leads the adsorption curves to immediately reach the equilibrium condition at the beginning period of adsorption processes. The adsorption curves of pseudo-first order and the pseudo-second order models show high correlation to the experimental data, and high average values of coefficient of determination. The pseudo-first order and the pseudo-second order models also show relatively same value of equilibrium sorption capacity at the adsorption processes with high adsorption rate constant. At the adsorption processes with low and medium adsorption rate constant, the adsorption curves of the pseudo-first order model show a tendency to move away from the experimental data, but the pseudo-second order model are still following the experimental data. The pseudo-second order model is the most appropriate kinetic model to describe the adsorption of beta-carotene from palm oil onto bentonite.
References
30 clay, Scholars Research Library-Archives of Appl. Sci.
Research 4(5):158-166, 2012.
[2] Ajemba R. O., Igbokwe P. K., Onukwuli O. D., Optimization of color pigments removal from palm oil by activated ukpor clay using response surface methodology, Reserach J. of Appl. Sci. Eng. and Tech.
6(3):423-432, 2013.
[3] Ajemba R. O., Onukwuli O. D., Adsorptive removal of colour pigment from palm oil using acid activated Nteje clay: Kinetics, equilibrium, and thermodynamics, J. of Physicochemical Problems of Mineral Processing
49(1):369-381, 2012.
[4] Alkan M., Demirbas O., Dogan M., Adsorption kinetics and thermodynamics of an anionic dye onto sepiolite, Microporous and Mesoporous Materials 101:388-396, 2007.
[5] Al-Zahrani A. A., Al-Shahrani S. S., Al-Tawil Y. A., Study on the activation of Saudi bentonite, part II: Characterization of the produced active clay and its test as an adsorbing agent, J. of King Saud University, Eng. and Sci. 13(2):193-203, 2000.
[6] Bakhtyar K. A., Muhammad A. A., Karim J. J., Acid activation and bleaching capacity of some local clays for decolourizing used oils, Asian J. Chem. 23 (6):2449-2455, 2011.
[7] Brooks D. D., Bleaching factors that affect the oil loss, Proceedings of the 1999 PROIM, International palm oil congress, pp. 45-51, 1999.
[8] Christidis G. E., Scott P. W., Dunham A. C., Acid activation and bleaching capacity of bentonite from the Island of Milos and Chios, Aegean, Greece, Appl. Clay Sci. 12:329-347, 1997.
[9] Christidis, G. E, Kosiari S., Decolorization of vegetable oils: a study of the mechanism of adsorption of beta-carotene by an acid-activated bentonite from Cyprus, J. of Clays and Clay Minerals 51(3):327-333, 2003.
[10]Egbuna S. O., Development of kinetic model for adsorption of carotenoids on activated clay in the bleaching of palm oil, Int. J. of Research in Eng. and Tech. Vol. 3 Issue 01:371-380, 2014.
[11]Egbuna, S. O., Mbah C. N., Chima T. O., Determination of optimal process conditions for acid actiation of ngwo clay in bleching of palm oil. Int. J. of Computational Eng. Research Vol. 05 Issue 08:17-29, 2015.
[12]Ho Y. S., McKay G., A comparison of chemisorption kinetic models applied to pollutant removal on various sorbents, Process Safety and Environmental Protection
76(B4):332-340, 1998.
[13]Kheok S. C., Lim E. E., Mechanism of palm oil bleaching by montmorillonite clay activated at various
acid concentrations, J. of the American Oil Chemists Society (59):129-131, 1982.
[14]Kirali E., Lacin O., Statistical modeling of acid activation on cotton oil bleaching by Turkish bentonite, J. Food Eng. 75:137-141, 2006.
[15]Makhoukhi B., Didi M. A., Villemin D., Azzouz A., Acid activation of bentonite for use as a vegetable oil bleaching agent, Grasasy Aceites. 60(4):343-349. 2009.
[16]Motlagh M. M., Youzbashi A. A., Rigi Z. A., Efect of acid activation on structural and bleaching properties of bentonite, Iranian J. Mat. Sci. Eng. 8(4):50-56, 2001.
[17]Mustapha S. I., Mohammed A. A., Zakari A. Y., Mohammed H. A., Performance evaluation of local clays from northern Nigeria for the refining of palm oil, J. of Chem. Eng. and Materials Sci. 4(5):58-66, 2013.
[18]Novakovic T., Rozic L., Petrovic S., Stanisavljev D., Desorption of beta-carotene from bentonite adsorbent under microwave irradiation, Macedonian J. of Chem. And Chemical Eng. 34(2), 2015.
[19]Nwankwere E. T., Nwadiogbu J. O., Yilleng M. T., Eze K. A., Kinetic investigation of the adsorptive removal of beta-carotene pigments from palm oil using unmodified natural clay, Pelagia Research Library-Advances in Applied Science Research 3(2):1122-1125, 2012.
[20]Pan B. C., Meng F. W., Chen X. Q., Pan B. J., Li X. T., Zhang W. M., Zhang X., Chen J. L., Zhang Q. X., Sun Y., Application of an effective method in predicting breakthrough curves of fix-bed adsorption onto resin adsorbent, J. of Hazardous Materials 124:74-80, 2005.
[21]Proctor A., Brooks D. D., Adsorptive separation of oils, In Bailey’s industrial oil & fat products, Eds. Shahidi F., sixth ed. John Wiley & Son, New York, pp.267-287, 2005.
[22]Qiu H., Lv L., Pan B. C., Zhang Q. J., Zhang W. M., Zhang Q. X., Critical review in adsorption kinetic models, J. of Zhejiang University-Sci. A 10(5):716-724, 2009.
[23]Sahidi F., Bailey’s Industrial Oil and Fat Products, 6th Edition, John Wiley and Sons, pp. 285-340, 2005.
[24]Selvaraj R., Younghun K., Cheol K. J., Kyunghee C., Jongheop Y., Batch adsorptive removal of copper ions in aqueous solutions by ion exchange resins: 1200H and IRN97H, Korean J. Chem. Eng. 21(1):187-194, 2004.
[26]Ugurlu M., Karaoglu M. H., Adsorption of ammonium from an aqueous solution by fly ash and sepiolite: Isotherm, kinetic, and thermodynamic analysis, Microporous and Meoporous Materials 139:173-178, 2011.