129 ________________________
Joyce. E1, School of Civil Engineering, University of East London, Linton University College, Malaysia
Deepak T.J2., Head of Discipline, Civil Engineering- FOSTEM, INTI International University, Malaysia, PH-0126352464. E-mail: deepak_tj@gmail.com
Using Four Types Of Notches For Comparison
Between Chezy’s Constant(C) And Manning’s
Constant (N)
Joyce Edwin Bategeleza, Deepak T. J., Eric L.W.K., Munir H. K.
Abstract: In this technical paper, Chezy’s and Manning’s constant were compared, using four different notches on the plain bed. The first phase of this
paper involves designing of the notches, using Auto Cad software followed by fabrication. The second phase involves carrying out Experiments in open channel Laboratory by using hydraulic bench. The final phase involves calculations of Chezy’s and manning’s constants. It was seen that, Chezy’s constant is directly proportional to actual discharge While Manning’s constant in inversely proportional to actual discharge. Chezy’s constant has higher value compared to Manning’s constant value. Also Manning’s Standard deviation is smaller compared to that of Chezy’s. This indicates the accuracy of the resistance coefficient due to the fact that the smaller the value of standard deviation the higher the level of accuracy. Therefore, the coefficient of resistance is more adaptable, simple and accurate in Manning’s constant.
Key words: Open channel flow, Hydraulic bench, Coefficients of Resistance, Actual discharge
————————————————————
I
NTRODUCTIONMany Researchers have been working on Open Channel over the years, to discover and upgrade the theory on Hydraulic structures and elements. The results obtained from previous experiment shows how Open Channel have been developed and modified to a large extent and it has become more useful in life than before. For example Resistance Coefficients (Manning’s and Chezy’s Constant) was discovered after a series of so many experiments. The comparison of these Resistance Coefficients (Manning’s and Chezy’s Constant) has often been done in Open channel laboratory, using weirs instead of using notches. The aim was to determine the accurate and adaptable coefficient of resistance. In order to come up with new results of the comparison, notches were used instead of weirs. The notches are considered to be more accurate than weirs (ASTM, 1993).
Table1: Summary of few typical values of manning’s (n)
Channel
type Surface material and form Manning’s n range
River earth, straight 0.02-0.025 earth, meandering 0.03-0.05 gravel(75-150mm) straight 0.03-0.04 gravel(75-150mm) winding 0.04-0.08 Unlined
canal earth, straight 0.018-0.025 rock, straight 0.025-0.045 lined canal Concrete 0.012-0.017 Lab
models Mortar 0.011-0.013
Perspex 0.009
(CIVE 2400 Fluid Mechanics, 2013)
CHEZY’S EQUATION
Chezy’s equation is the discharge equation which was improved by a French engineer around the year 1768. Its application is to compute the depth-discharge relationship. It is derived as shown below;
Force producing motion = friction force resting motion
2
KPLV
pgALS
o
Cancelling L in both sides and rearranging, it gives,
V=
S
0P
A
K
pg
Grouping all the constants, it gives Chezy’s roughness
coefficient, C=
K
pg
and
P
A
= R
Hence, substitute C and R into equation (ii) V=
C
RS
0 This is the standard Chezy’s formula (the first formula for uniform open channel flow) Where by V is the mean velocity of water flow, C is chezy’s constant, R is hydraulic mean depth and Sois the bed slope. Chezy’s constant(C) depends on the nature of Channel walls and with H. (Hamill.L, 2006)MANNING’S EQUATION
Manning’s Equation was introduced in1890, after a series of studies of evaluation of C (Chezy’s constant), so as to help engineers in producing results which are more adaptable compare to Chezy’s formula. It is due to the fact that, Chezy’s formula wasn’t able to provide results which could satisfy the engineers (especially Irrigation Engineers). Standard Manning’s formula (V = R2/3
S1/2/n), is very simple to use and it gives good results, compared to Chezy’s formula. Manning’s formula is one of the Empirical equations which can replace the variations of C (in Chezy’s formula) with m.Below is the formula which shows how the replacement is done.
By considering Chezy’s equation, V=
C
RS
0Replacing C with 6
1
Mm
orMR
16therefore the equation
becomes V = 2
1 3 2
130
M
Can also be replaced byn
k
or
n
z
. Hence the equation will
be, V=
2 1 3 2
s
m
n
k
or V=
2 1 3 2
S
R
n
z
Where:
V is Velocity, k or z is conversion constant, n is Manning’s roughness Coefficient, m or R is hydraulic radius and S is slope of the energy grade line. It is used in determining the Channel Uniform flow capacity. (J.B Calvert, 2007)
MATERIALS AND METHODS
MATERIALS
Acrylic plastic
The Notches are made of Acrylic plastic (in form of a sheet) instead of using metal. Grinder machine was used in the cutting work of the plastic according to the given specifications as shown below.
600 V-notch: opening (depth:121mm and angle: 600), size of 160mm(H) x 243mm(W)
900 V-notch: opening (depth:120mm and angle: 900), size of 160mm(H) x 243mm(W)
Rectangular notch: opening (depth:121mm and width: 46mm), size of 160mm(H) x 243mm(W)
Trapezoidal notch: opening (depth:91mm and width:137mm), size of 160mm(H) x 243mm(W)
METHODS
There were three types of quantitative variables used during the experiment, namely; Independent variable (water flow or discharge), controlled variable (width) and dependent variable (Height). The machine used in the experiment was hydraulic bench because the notches can be easily installed. Its length and width are 1000mm and 250mm respectively.
APPARATUS USED:
Hydraulic bench, Stop watch, Wing Nut screw Flow meter, Pump,Rectangular notch, Trapezoidal notch, 60o and 90o V-notch. The required apparatus were cleaned before proceeding with the experiment. Flow meter, stop watch and other required equipment were well checked and calibrated before starting the experiment. The rectangular Notch was clamped to the hydraulic bench by using the wing nut Screw. The discharge valve was adjusted into 0.5l/s and then the hydraulic bench was switched on and water was allowed to discharge. The water was left to flow within 2 minutes so as to get a steady water flow. Then Several readings of flow rate (Q), time, water level upstream/water head above the notch(H) and Channel width(B) were then taken while increasing the flow rate each time at an interval of 2 minutes. The rectangular notch was replaced by 600 V-notch and then the above procedures were repeated. Then 600 V-notch was replaced by 900 V-notch and the above procedures were repeated. Finally the 900 V-notch was replaced by Trapezoidal notch and the above procedures were repeated.
EMPERICAL STUDY
The Actual Discharge was obtained directly from the
experiment. Hence the Actual Discharge was used to find Chezy’s and Manning’s Constant using the formulas shown below.
AV
Q
Chezy’s Constant equation
RS V C
Where by
P
A
R
, A= wetted area in a channel while P= wetted perimeter in a channel.Manning’s Constant equation
V
S
R
n
2 / 1 3 / 2
Whereby,
Q = Actual Discharge, A = Flow cross section area, V = Mean velocity, R = Hydraulic mean radius, S = Bed slope, c = Chezy’s constant and n = Manning’s constant
Standard deviation equation
1 .
2
N x xi D
S
Whereby; S is Standard deviation, Xi is each value in the sample, X is mean of the values and N is number of samples
RESULTS AND DISCUSSION
Run Q(m3/s) B(m) H(m) V(m/s) C n
1 0.0005 0.0225 0.041 0.36134 2.3394 0.2265 2 0.00067 0.0225 0.047 0.48419 3.1347 0.169 3 0.00083 0.0225 0.052 0.59982 3.8833 0.1365 4 0.001 0.0225 0.057 0.72267 4.6787 0.1133 5 0.00117 0.0225 0.06 0.84553 5.4741 0.0968 6 0.00133 0.0225 0.064 0.96116 6.2227 0.0852 7 0.0015 0.0225 0.068 1.08401 7.0181 0.0755 8 0.00167 0.0225 0.071 1.20687 7.8135 0.0678 9 0.00183 0.0225 0.074 1.32249 8.5621 0.0619 10 0.002 0.0225 0.078 1.44535 9.3575 0.0566
Average V,C&n 0.90334 5.8484 0.1089 This part indicates sample of calculation of Manning’s constant, Chezy’s Constant and tables of results for each notch and discussion.
Rectangular notch
Sample of calculation to find C and n Bed slope (S) = 1 since is a plain bed
RS V
C
s
m
A
Q
V
1
.
68
/
0003
.
0
0005
.
0
131
m
P
A
R
0
.
24
000124
.
0
0003
.
0
4293
.
3
1
24
.
0
68
.
1
C
2288
.
0
68
.
1
1
24
.
0
23 12 2 / 1 3 / 2
V
S
R
n
Table 2: shows the results of Rectangular notch
Run Q(m3/s) B(m) H(m) V(m/s) C n
1 0.0005 0.024
8 0.0404 1.6801 3.429 5
0.228 8 2 0.00067 0.024
8 0.0496 2.2513 4.595 5
0.170 7 3 0.00083 0.024
8 0.0582 2.789 5.693 0.137 8 4 0.001 0.024
8 0.0683 3.3602 6.859 0.114 4 5 0.00117 0.024
8 0.0779 3.9315 8.025 0.097 8 6 0.00133 0.024
8 0.0874 4.4691 9.122
5 0.086 7 0.0015 0.024
8 0.0956 5.0403 10.28 9
0.076 3 8 0.00167 0.024
8 0.1038 5.6116 11.45 5
0.068 5 9 0.00183 0.024
8 0.1104 6.1492 12.55 2
0.062 5 10 0.002 0.024
8 0.1184 6.7204 13.71 8
0.057 2 Average V,C&n 4.2002
7
8.573 9 0.11
90o V-notch
Table 3: shows the results of 90o V-notch
60o V-notch
Table 4: shows the results of 600 V-notch
Ru
n Q(m 3
/s) B(m) H(m) V(m/s) C n
1 0.0005 0.013
6 0.05
0.6127
5 4.3539 0.1179
2 0.0006 7
0.013
6 0.057
0.8210
8 5.8343 0.088
3 0.0008 3
0.013
6 0.063
1.0171
6 7.2276 0.071
4 0.001 0.013
6 0.069
1.2254
9 8.7079 0.059
5 0.00117 0.013
6 0.074
1.4338
2 10.188
0.050 4
6 0.0013 3
0.013
6 0.079 1.6299 11.582
0.044 3
7 0.0015 0.013
6 0.084
1.8382
4 13.062
0.039 3
8 0.0016 7
0.013
6 0.089
2.0465
7 14.542
0.035 3
9 0.0018 3
0.013
6 0.091
2.2426
5 15.935
0.032 2
10 0.002 0.013
6 0.096
2.4509
8 17.416
0.029 5
Average V,C&n 1.5318
6 10.885
0.056 7
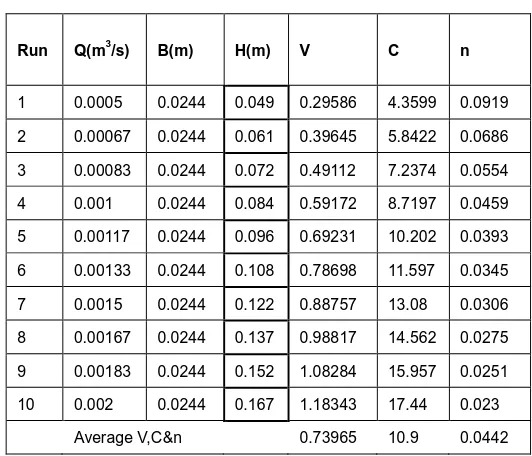
Trapezoidal notch
Table 5: shows the results of Trapezoidal notch
Run Q(m3/s) B(m) H(m) V C n
1 0.0005 0.0244 0.049 0.29586 4.3599 0.0919 2 0.00067 0.0244 0.061 0.39645 5.8422 0.0686 3 0.00083 0.0244 0.072 0.49112 7.2374 0.0554 4 0.001 0.0244 0.084 0.59172 8.7197 0.0459 5 0.00117 0.0244 0.096 0.69231 10.202 0.0393 6 0.00133 0.0244 0.108 0.78698 11.597 0.0345 7 0.0015 0.0244 0.122 0.88757 13.08 0.0306 8 0.00167 0.0244 0.137 0.98817 14.562 0.0275 9 0.00183 0.0244 0.152 1.08284 15.957 0.0251 10 0.002 0.0244 0.167 1.18343 17.44 0.023 Average V,C&n 0.73965 10.9 0.0442 Table 1 to 5 indicates the results of Velocity, chezy’s and manning’s constant obtained after the completion of the calculations. Chezy’s increases in all the tables while manning’s decreases.
Resistance Coefficients Statistical Analysis
Table 6: shows Average c and n and variances for the type of
notches
Type of Notches c n (Xi-X)2 (Xi-X)2
1. Rectangular notch 8.5739 0.11 0.2284 0.0009
2. 90 v-notch 5.8484 0.1089 10.2619 0.00084
3. 60 v-notch 10.885 0.0567 3.3605 0.00054
4. Trapezoidal notch 10.90 0.0442 3.4158 0.00128 Average of C & n 9.0518 0.07995
Sum 17.267 0.0036
132
Below are the graphs showing the relationship between Chezy’s, Manning’s and Flow rate.
y = 6859.2x - 9E-05
R² = 1
0
10
20
0
0.001
0.002
0.003
Ch
ezy
's(c)
Discharge Q(Cumecs)
Chezy's(c) Vs Flow
rate(Q)
Figure1: Chezy’s and Manning’s Vs Actual Discharge of
rectangular notch
Figure 2: Chezy’s and Manning’s Vs. Actual Discharge of 90o
V-notch
Figure 4: Chezy’s and Manning’s Vs. Actual Discharge of
Trapezoidal notch
133 the higher the discharge value, the lower the Manning’s value.
This implies that Chezy’s constant is inversely proportional to Manning’s constant.
Relationship between Chezy’s& the type of
notches and Manning’s & types of notches
0 5 10 15
C
h
ez
y'
s
V
ari
an
ce
Types of notches
Chezy's variance Vs
Type of notches
0 0.0005 0.001 0.0015
M
a
n
n
in
g'
s
va
ri
a
n
ce
Types of notches
Manning's variance
Vs Type of notches
Figure 5: Average Chezy’s and Manning’s variance Vs Type of
notches
By referring to the obtained standard deviation results of Chezy’s and Manning’s, the highest standard deviation is seen on Chezy’s while the lowest standard deviation is seen on Manning’s. This also helps to verify the level of accuracy between the two coefficients of resistance. Therefore, Manning’s has high level of accuracy than chezy’s because it has smaller value of standard deviation. In addition to that, the highest variance of chezy’s average is obtained on 90 v-notch and the lowest variance is obtained on rectangular notch. While highest variance of Manning’s average is obtained on trapezoidal notch and the lowest variance is found on 60 v-notch. This indicates how Chezy’s and Manning’s are indirectly related.
CONCLUSION
The fundamental objectives of this paper were accomplished. The results verified that Chezy’s constant increases as actual
discharge increases while Manning’s constant decreases as the actual discharge increases. It was observed from the graphs and the data that Chezy’s constant and Manning’s constant varies indirectly. This means that when chezy’s constant increase manning’s constant decrease. Also Chezy’s has big value of standard deviation compare to manning’s. The smaller the value of standard deviation the higher the level of accuracy, therefore Manning’s has high level of accuracy than chezy’s constant. In addition to that, it was discovered that the Coefficient of Resistance is more adaptable, simple and accurate in Manning’s constant. This is due to the fact that it gives small value which satisfy majority of the researchers. The evidence is seen from the record of the generally recognized tables and figures and from the standard deviation. These records help in giving a clear prove about Manning’s constant.
REFERENCE
[1] ASTM (1993) American Society for Testing and Materials. ASTM D5242. Standard method for open-channel flow measurement of water with thin-plate weirs. [Online] Available at: http://global.ihs.com (Accessed on 17th January 2013)
[2] B.C. Yen, (2002). Open Channel Flow Resistance. Journal of Hydraulic Engineering
[3] Calvert, J.B. (2007) Open-Channel Flow [Online]
Available at: http
//mysite.du.edu/etuttle/tech/opench.htm (Accessed on 20 January, 2013)
[4] Chow, V.T. (1959) Open-Channel Hydraulics. Singapore: McGraw-Hill
[5] CIVE 2400 Fluid Mechanics (2013) Open Channel ydraulics .[Online] availableat: www.efm.leeds.ac.uk/CIVE/CIVE2400/OpenChannel Hydraulics2.pdf (Accessed on 9th March, 2013)