University of Pennsylvania
ScholarlyCommons
Publicly Accessible Penn Dissertations
2018
Instrumentation, Data, And Algorithms For
Visually Understanding Haptic Surface Properties
Alexander Burka
University of Pennsylvania, [email protected]
Follow this and additional works at:
https://repository.upenn.edu/edissertations
Part of the
Robotics Commons
This paper is posted at ScholarlyCommons.https://repository.upenn.edu/edissertations/3099
Recommended Citation
Burka, Alexander, "Instrumentation, Data, And Algorithms For Visually Understanding Haptic Surface Properties" (2018).Publicly Accessible Penn Dissertations. 3099.
Instrumentation, Data, And Algorithms For Visually Understanding
Haptic Surface Properties
Abstract
Autonomous robots need to efficiently walk over varied surfaces and grasp diverse objects. We hypothesize that the association between how such surfaces look and how they physically feel during contact can be learned from a database of matched haptic and visual data recorded from various end-effectors' interactions with hundreds of real-world surfaces. Testing this hypothesis required the creation of a new multimodal sensing apparatus, the collection of a large multimodal dataset, and development of a machine-learning pipeline.
This thesis begins by describing the design and construction of the Portable Robotic Optical/Tactile ObservatioN PACKage (PROTONPACK, or Proton for short), an untethered handheld sensing device that emulates the capabilities of the human senses of vision and touch. Its sensory modalities include RGBD vision, egomotion, contact force, and contact vibration. Three interchangeable end-effectors (a steel tooling ball, an OptoForce three-axis force sensor, and a SynTouch BioTac artificial fingertip) allow for different material properties at the contact point and provide additional tactile data.
We then detail the calibration process for the motion and force sensing systems, as well as several proof-of-concept surface discrimination experiments that demonstrate the reliability of the device and the utility of the data it collects. This thesis then presents a large-scale dataset of multimodal surface interaction recordings, including 357 unique surfaces such as furniture, fabrics, outdoor fixtures, and items from several private and public material sample collections. Each surface was touched with one, two, or three end-effectors, comprising approximately one minute per end-effector of tapping and dragging at various forces and speeds. We hope that the larger community of robotics researchers will find broad applications for the published dataset.
Lastly, we demonstrate an algorithm that learns to estimate haptic surface properties given visual input. Surfaces were rated on hardness, roughness, stickiness, and temperature by the human experimenter and by a pool of purely visual observers. Then we trained an algorithm to perform the same task as well as infer quantitative properties calculated from the haptic data. Overall, the task of predicting haptic properties from vision alone proved difficult for both humans and computers, but a hybrid algorithm using a deep neural network and a support vector machine achieved a correlation between expected and actual regression output between approximately ρ = 0.3 and ρ = 0.5 on previously unseen surfaces.
Degree Type
Dissertation
Degree Name
Doctor of Philosophy (PhD)
Graduate Group
First Advisor
Katherine J. Kuchenbecker
Subject Categories
INSTRUMENTATION, DATA, AND ALGORITHMS FOR VISUALLY UNDERSTANDING HAPTIC SURFACE PROPERTIES
Alexander L. Burka
A DISSERTATION
in
Electrical and Systems Engineering
Presented to the Faculties of the University of Pennsylvania in Partial Fulfillment of the Requirements for the Degree of Doctor of Philosophy
2018
Supervisor of Dissertation
Katherine J. Kuchenbecker
Associate Professor, Department of Mechanical Engineering and Applied Mechanics
Graduate Group Chairperson
Alejandro Ribeiro
Associate Professor, Department of Electrical and Systems Engineering
Dissertation Committee
Jan Van der Spiegel
Professor of Electrical and Systems Engineering
David Brainard
RRL Professor of Psychology
Johannes Burge
Assistant Professor of Psychology
Trevor Darrell
INSTRUMENTATION, DATA, AND ALGORITHMS FOR VISUALLY UNDERSTANDING HAPTIC SURFACE PROPERTIES
© COPYRIGHT
2018
Alexander Lawrence Burka
This work is licensed under the Creative Commons Attribution NonCommercial-ShareAlike
3.0 License. To view a copy of this license, visit http://creativecommons.org/licenses/
by-nc-sa/3.0/.
In reference to IEEE copyrighted material which is used with permission in this thesis,
the IEEE does not endorse any of the University of Pennsylvania’s products or services.
Internal or personal use of this material is permitted. If interested in
reprinting/repub-lishing IEEE copyrighted material for advertising or promotional purposes or for
creat-ing new collective works for resale or redistribution, please go to http://www.ieee.org/
publications_standards/publications/rights/rights_link.html to learn how to
ob-tain a License from RightsLink. If applicable, University Microfilms and/or ProQuest Li-brary, or the Archives of Canada may supply single copies of the dissertation.
ACKNOWLEDGMENTS
The road to finishing this thesis was long and winding, and I could not have done it alone.
First, thank you to my advisor, Katherine Kuchenbecker, for finding space for me in her
research group, and for her supportive and patient mentoring, excellence in research, and
meticulous paper editing. Thank you to my previous advisor, Dan Lee, for supporting me
in the beginning of my time at Penn and encouraging me to pursue further research. Thank you as well to the other members of my thesis committee, Jan Van der Spiegel, David
Brainard, Johannes Burge, and Trevor Darrell, for helping guide my thesis from proposal
to this document. Thank you to my family and friends, especially Laura, for keeping me
relatively sane and believing (even when I didn’t) that I could get to this point.
Many people contributed to the Proton Pack project. Here is a list of some of them. The
design phase involved Siyao Hu, Shweta Krishnan, Stu Helgeson, and Conor O’Brien, as
well as our collaborators at UC Berkeley, Lisa Anne Hendricks, Yang Gao, and Trevor
Darrell. Jennifer Hui, Naomi Fitter, and Rebecca Khurshid provided helpful advice in the
early stages of the project. Sarah Allen and Abhinav Rajvanshi wrote important software
components during their internships.
We would not have such a large dataset without the help of Eric Young and Myles Cai, who
collected data with the Proton Pack, as well as Heather Culbertson, whose surface samples
were the first entries in our dataset, Michaela Wieland, who collected materials at the Max
Planck Institute and shipped them across the ocean, Matti Strese, who not only welcomed
me into his lab at TU Munich to gather data but loaned me a number of surface samples,
Lastly, I need to acknowledge Dougal Sutherland and Antal Spector-Zabusky, who improved
this manuscript by answering my endless questions about statistics and LATEX, respectively.
It’s been a great opportunity to work in the GRASP Lab, particularly with the Haptics
Group both at Penn and at MPI. During my PhD I was supported by the NSF under
the Complex Scene Perception IGERT program, award number 0966142, later under grant
ABSTRACT
INSTRUMENTATION, DATA, AND ALGORITHMS FOR VISUALLY
UNDERSTANDING HAPTIC SURFACE PROPERTIES
Alexander L. Burka
Katherine J. Kuchenbecker
Autonomous robots need to efficiently walk over varied surfaces and grasp diverse objects.
We hypothesize that the association between how such surfaces look and how they
phys-ically feel during contact can be learned from a database of matched haptic and visual
data recorded from various end-effectors’ interactions with hundreds of real-world surfaces.
Testing this hypothesis required the creation of a new multimodal sensing apparatus, the
collection of a large multimodal dataset, and development of a machine-learning pipeline.
This thesis begins by describing the design and construction of the Portable Robotic
Op-tical/Tactile ObservatioN PACKage (PROTONPACK, or Proton for short), an untethered
handheld sensing device that emulates the capabilities of the human senses of vision and
touch. Its sensory modalities include RGBD vision, egomotion, contact force, and contact vibration. Three interchangeable end-effectors (a steel tooling ball, an OptoForce
three-axis force sensor, and a SynTouch BioTac artificial fingertip) allow for different material
properties at the contact point and provide additional tactile data.
We then detail the calibration process for the motion and force sensing systems, as well as several proof-of-concept surface discrimination experiments that demonstrate the reliability
of the device and the utility of the data it collects. This thesis then presents a large-scale
dataset of multimodal surface interaction recordings, including 357 unique surfaces such
as furniture, fabrics, outdoor fixtures, and items from several private and public material
sample collections. Each surface was touched with one, two, or three end-effectors,
and speeds. We hope that the larger community of robotics researchers will find broad
applications for the published dataset.
Lastly, we demonstrate an algorithm that learns to estimate haptic surface properties given
visual input. Surfaces were rated on hardness, roughness, stickiness, and temperature by the
human experimenter and by a pool of purely visual observers. Then we trained an algorithm
to perform the same task as well as infer quantitative properties calculated from the haptic
data. Overall, the task of predicting haptic properties from vision alone proved difficult
for both humans and computers, but a hybrid algorithm using a deep neural network and
TABLE OF CONTENTS
ACKNOWLEDGMENTS . . . iii
ABSTRACT . . . v
CONTENTS . . . vii
LIST OF TABLES . . . ix
LIST OF CODE EXCERPTS . . . x
LIST OF FIGURES . . . xi
CHAPTER 1 INTRODUCTION . . . 1
1.1 Motivation . . . 2
1.2 Contributions . . . 3
CHAPTER 2 PROTON PACK HARDWARE . . . 7
2.1 Background . . . 7
2.2 Architectural Considerations. . . 12
2.3 Handheld Rig . . . 14
2.4 Backpack . . . 23
2.5 Summary . . . 29
CHAPTER 3 SOFTWARE . . . 30
3.1 Data Collection . . . 30
3.2 Postprocessing . . . 42
3.3 Summary . . . 50
CHAPTER 4 SURFACE DISCRIMINATION WITH ENGINEERED FEATURES . 51 4.1 Background . . . 52
4.3 Scan-Dependent Feature Pipeline . . . 53
4.4 Initial Proof-of-Concept Experiment . . . 55
4.5 Design Improvements. . . 60
4.6 Comparison with Scan-Free Features . . . 72
4.7 Summary . . . 85
CHAPTER 5 DATASET . . . 86
5.1 Description of Data. . . 88
5.2 Episode Length Experiment . . . 96
5.3 Data Format . . . 105
5.4 Summary . . . 108
CHAPTER 6 VISUO-HAPTIC MACHINE LEARNING. . . 109
6.1 Background . . . 110
6.2 Task Definition . . . 113
6.3 Human-Subject Baseline Study . . . 114
6.4 Machine Learning. . . 119
6.5 Summary . . . 148
CHAPTER 7 CONCLUSION. . . 150
7.1 Contributions . . . 151
7.2 Future Directions . . . 154
APPENDIX A CALIBRATION . . . 157
APPENDIX B SURFACE LIST . . . 167
APPENDIX C TERMINOLOGY . . . 186
LIST OF TABLES
TABLE 2.1 Human/robot operator pros and cons . . . 13
TABLE 3.1 Format of structure_times.csvand bluefox_times.csvfiles . . . 43
TABLE 3.2 Format of april.csv files . . . 43
TABLE 3.3 Format of teensy.ft.csv files. . . 44
TABLE 3.4 Format of teensy.acc.csv files . . . 44
TABLE 3.5 Format of teensy.gyro.csvfiles . . . 44
TABLE 3.6 Format of teensy.mag.csv files . . . 44
TABLE 3.7 Format of optoforce.csv files. . . 44
TABLE 3.8 Format of biotac.csvfiles. . . 45
TABLE 4.1 Best hyperparameters in initial proof-of-concept . . . 59
TABLE 4.2 Model performance in initial proof-of-concept . . . 60
TABLE 4.3 End-effector diameter of various haptic sensing systems . . . 64
TABLE 4.4 End-effector diameter comparison under Vicon tracking. . . 65
TABLE 4.5 Test set performance of small end-effector with Vicon tracking . . . . 66
TABLE 4.6 Motion tracking algorithm comparison . . . 69
TABLE 4.7 Optimal classifiers by end-effector and tracking method . . . 71
TABLE 4.8 Performance of the9.525mm end-effector with onboard tracking. . . 71
TABLE 4.9 Classification accuracies using scan-dependent and scan-free features 81 TABLE 6.1 Automatic peak-finding parameters . . . 124
TABLE 6.2 Train/test split . . . 126
TABLE 6.3 Cross-validation learning results (without feature selection). . . 130
TABLE 6.4 Final learning results (without feature selection). . . 131
TABLE 6.6 Final learning results (without feature selection). . . 133
TABLE 6.7 Human rating performance metrics . . . 148
TABLE A.1 Calibration results. . . 165
LIST OF CODE EXCERPTS 3.1 BioTac flow script . . . 41
3.2 BioTac flow record . . . 41
3.3 Pose transformation . . . 49
3.4 Force/torque transformation . . . 49
LIST OF FIGURES
FIGURE 2.1 Strain gauge . . . 9
FIGURE 2.2 BioTac sensor internals . . . 10
FIGURE 2.3 Sensors on the handheld rig. . . 15
FIGURE 2.4 Proton operation . . . 16
FIGURE 2.5 End-effector with high-bandwidth accelerometers. . . 18
FIGURE 2.6 Vicon marker fixture . . . 20
FIGURE 2.7 Proton Pack end-effectors . . . 21
FIGURE 2.8 Wiring diagram of rig and backpack . . . 25
FIGURE 2.9 Schematic of power distribution circuit . . . 26
FIGURE 2.10 Schematic of Teensy daughterboard and peripherals . . . 27
FIGURE 2.11 Schematic of ATI Mini40 conversion circuit . . . 27
FIGURE 2.12 Schematic of analog sensor acquisition circuit. . . 28
FIGURE 2.13 Two-layer PCB layout. . . 28
FIGURE 3.1 Modular software architecture . . . 31
FIGURE 3.2 Teensy packet structure . . . 36
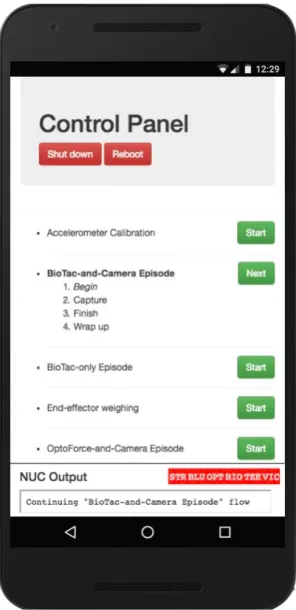
FIGURE 3.3 Smartphone web app . . . 38
FIGURE 3.4 Flowchart showing steps for gathering a dataset . . . 38
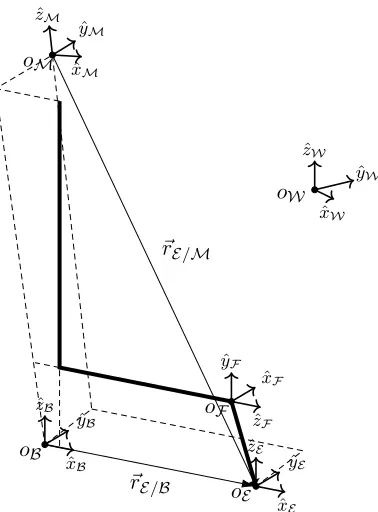
FIGURE 3.5 Coordinate frames . . . 48
FIGURE 4.1 Coordinate frames . . . 54
FIGURE 4.3 Sample data recording from the 2016 proof-of-concept experiment . 57
FIGURE 4.4 Scan-dependent feature pipeline . . . 58
FIGURE 4.5 Confusion matrix from initial proof-of-concept . . . 59
FIGURE 4.6 6.35mm tooling ball end-effector with external accelerometers . . . 61
FIGURE 4.7 Surface samples used in the 2017 validation experiment . . . 62
FIGURE 4.8 Comparison of accelerometer mounting positions . . . 62
FIGURE 4.9 Confusion matrix for small end-effector with Vicon tracking. . . 65
FIGURE 4.10 Fiducial frame . . . 67
FIGURE 4.11 Graphical comparison of motion tracking systems . . . 70
FIGURE 4.12 Confusion matrix for9.525mm end-effector with onboard tracking . 71 FIGURE 4.13 Confusion matrix for LMT classification using scan-free features . . 79
FIGURE 4.14 Comparison of classifiers using scan-dependent and scan-free features 82 FIGURE 4.15 Feature sensitivity to scan-time parameters . . . 84
FIGURE 5.1 Proton Pack operation . . . 90
FIGURE 5.2 Trace of end-effector position during a typical surface recording . . 92
FIGURE 5.3 Data gathered during a typical surface recording . . . 93
FIGURE 5.4 End-effector dragging force and speed histograms . . . 94
FIGURE 5.5 End-effector tapping force histograms . . . 94
FIGURE 5.6 Inputs and outputs of bilinear friction model . . . 100
FIGURE 5.7 Coefficients of online learned friction models . . . 101
FIGURE 5.8 Model error of online learned friction models . . . 102
FIGURE 5.9 Evaluation of online learned friction model at stopping point . . . . 103
FIGURE 5.10 Normal force histogram . . . 104
FIGURE 5.11 Tangential force histogram . . . 104
FIGURE 5.12 MATLAB dataset visualizer . . . 106
FIGURE 5.13 Freeze-frame of pinewood interaction video . . . 107
FIGURE 6.2 Top-5 error rates on ILSVRC. . . 112
FIGURE 6.3 Some surface images in the human-subject study dataset. . . 115
FIGURE 6.4 MTurk participant interface, showing a cork surface.. . . 115
FIGURE 6.5 Correlation matrices from the human-subject study . . . 117
FIGURE 6.6 Selected surface images with scan-free features . . . 121
FIGURE 6.7 Box plots of scan-free features aggregated over material categories . 122 FIGURE 6.8 T-CNN architecture . . . 125
FIGURE 6.9 Feature selection performance . . . 128
FIGURE 6.10 Haptic property correlation plots in CV training (no FS) . . . 134
FIGURE 6.11 Haptic property correlation plots in CV testing (no FS) . . . 135
FIGURE 6.12 Haptic property correlation plots in training (no FS) . . . 136
FIGURE 6.13 Haptic property correlation plots in testing (no FS) . . . 137
FIGURE 6.14 Haptic property correlation plots in CV training (with FS) . . . 138
FIGURE 6.15 Haptic property correlation plots in CV testing (with FS). . . 139
FIGURE 6.16 Haptic property correlation plots in training (with FS) . . . 140
FIGURE 6.17 Haptic property correlation plots in testing (with FS) . . . 141
FIGURE 6.18 Human rating confusion matrices in CV training (no FS) . . . 142
FIGURE 6.19 Human rating confusion matrices in CV testing (no FS) . . . 142
FIGURE 6.20 Human rating confusion matrices in training (no FS) . . . 143
FIGURE 6.21 Human rating confusion matrices in testing (no FS) . . . 143
FIGURE 6.22 Human rating confusion matrices in CV training (with FS) . . . 144
FIGURE 6.23 Human rating confusion matrices in CV testing (with FS). . . 144
FIGURE 6.24 Human rating confusion matrices in training (with FS) . . . 145
FIGURE 6.25 Human rating confusion matrices in testing (with FS) . . . 145
FIGURE A.1 Coordinate frames . . . 158
FIGURE A.2 Vicon calibration fixture . . . 159
FIGURE A.3 Vicon calibration sphere fit . . . 160
FIGURE A.5 Free-body diagram . . . 162
CHAPTER 1 : INTRODUCTION
The world is covered in surfaces. In going about our daily lives, we interact with many
different materials and have an intuitive understanding of how to do so. Cooking breakfast,
we pick up a raw egg with a precisely calibrated grip force to neither crush nor drop it, and avoid touching the red-hot stove burner. Getting into the shower, we step on a rug or hold
a handrail because wet tiles are slippery. Venturing outside, we don shoes with rubber soles
(high coefficient of friction with most materials) and step around reflective patches of the
sidewalk, which indicate puddles or ice patches.
These finely calibrated physical interactions are the result of lifelong learning. Humans aren’t
born with a database of material properties and interactions, but by exploring the world
in childhood we amass a repertoire of experience with different objects and environments,
allowing us to extrapolate typical material properties. Later, encountered objects can either be interpreted as a member of a known class, in which case the properties are remembered,
or viewed as novel but with properties inferred from known classes that seem to be similar.
Naturally, either of these heuristics can misfire – stale bread and wood-textured plastic are
examples of materials whose haptic properties may not agree with a visual impression – but
humans are generally quite good at picking up on patterns of this type.
In this thesis we are interested specifically in patterns that can be identified in visual input
and give a hint of haptic properties. This cross-modal inference is both useful and common
among humans. Many of the examples above involveanticipation of haptic percepts. After
1.1. Motivation
Many robotics applications can benefit from haptic sensing, and in particular relating haptic
sensing to other sensing modalities. Typical mobile robots attempt to navigate primarily
based on visual feature tracking, but this strategy neglects many dimensions of sensory
expe-rience that we use to understand our environment. When walking and manipulating objects,
humans (and other animals) exert forces that are finely calibrated to the properties of what
they are interacting with. Many of those properties are haptic in nature, such as weight, hardness, roughness, slipperiness, and temperature. Let us consider several examples.
A self-driving car needs to cope with a variety of road conditions, which vary with weather,
road type, local highway maintenance status, and other factors. The appearance of the
road changes drastically over the course of a day. However, it’s the haptic properties that
are important for a safety-conscious driver: besides gross geometric features like potholes,
roughness indicates an unpaved road section which deserves care, or rumble strips warning
of highway boundaries; yet a patch of ice or a thin layer of water is to be avoided for its
slipperiness. In a different scenario, a kitchen assistant robot needs to deal with objects sporting a wide variety of surface materials, from a knife (rubber handle, strong power grip)
to an ice cube (very slippery, strong precision grip) to a raw egg (same size as the ice cube
but a different material, gentle precision grip required).
Crucially, the common feature between these different situations is that the robotic agent
must adapt to the haptic properties of surfaces, and it’s helpful if that adaptation can begin
by anticipating the properties before coming into contact with the surface [1]. Humans
make these judgments and calibrations mostly subconsciously, relying on lifelong experience
to build up a virtual database of material categories and their haptic properties. But even beyond the “database lookup”, faced with a novel surface we can make reasonable predictions
by comparing it visually to known materials. This cross-modal inference is a little-studied
The physical world is full of a vast menagerie of materials of all shapes, sizes and textures. As
part of perceiving these complex scenes, robotics researchers should consider the importance
of haptic properties. Often it’s advantageous to try to infer such properties from vision,
for several reasons. First, many more robots have cameras than have haptic sensing, so
with an algorithm for visual inference such robots could still get some haptic information. Furthermore, even in the case of robots that do have haptic sensors, there are benefits to
making the prediction before coming into physical contact with an object. For example, the
original Roomba vacuuming robot maps its surroundings by bumping into things, but more
advanced mobile robots have non-contact sensors (lidar or cameras) that improve reliability
and make for less risk of knocking things over.
1.2. Contributions
The main contributions of this thesis are the design of a device and operating software for recording matched visuo-haptic information about surfaces in the field, a substantial
database of such recordings, and analysis of what can be automatically learned from the
data. We present the initial large-scale dataset gathered with this device along with our
experiences at each stage of the project, which should be useful for future researchers looking
to extend the dataset or collect similar data. The hardware is discussed in Chapter 2 and
software inChapter 3. To demonstrate effectiveness, we studied the performance of existing
classification algorithms on Proton Pack data, covered inChapter 4. After that, we turned
our focus to collecting a large-scale dataset of surface interactions, described in Chapter 5.
Chapter 6 discusses our initial efforts to apply modern machine learning techniques to our
dataset to fulfill the goal of inferring surface properties from visual input. Finally,Chapter 7
presents conclusions and directions for future research.
Here is an overview of the contributions, chapter by chapter:
– We chose to design and build the Proton as a portable, self-contained,
human-operated sensing system. A literature review situates the Proton in the context
of other custom haptic sensing devices.
– Each of the sensors is described, as well as the supporting hardware that we use
to interface with the Proton.
– The end-effectors, while interchangeable, are always carried on the Proton itself
in a “parking lot” fixture which allows the onboard computer to detect which
end-effector is active.
• Chapter 3: Software
– The Proton is run by a custom supervisor program written in Rust, which
com-municates with each sensor and records data, interfacing with the human operator
via a self-hosted web interface.
– A “flow” system allows orchestration of several sensors and operator inputs in
sequence, for constructing experimental setups in a simple configuration language.
• Chapter 4: Surface Discrimination with Engineered Features
– An initial proof-of-concept experiment (published in the proceedings of MFI
2016 [2]) classified five surfaces using quantitative features calculated from the
vibration data with the tooling ball end-effector. The experiment was successful
but revealed several problems with the Proton design.
– A second study (published in the proceedings of ICRA 2017 [3]) classified five
different surfaces with higher accuracy after improving the hardware design by
moving the accelerometers closer to the contact point. This study also verified
a new egomotion tracking algorithm using the onboard camera, avoiding the
– We compared the effectiveness of classification with different types of features
calculated from the vibration data: the “scan-dependent features” used in the
previous two studies, and the “scan-free features” developed by Strese et al. [4,5].
This work was published in the proceedings of the 2017 IEEE World Haptics
Conference [6].
• Chapter 5: Dataset
– A preliminary study (presented at the 2017 AAAI Spring Symposium on
Interac-tive Multi-Sensory Object Perception for Embodied Agents [7]) with one surface
found that one minute of data collection was sufficient to pin down estimation of
the friction coefficient.
– We present a new database of matched visual and haptic data from recordings of
three end-effectors interacting with 357 surfaces. We describe the format of the data, which will be publicly released, and present sample code to parse it.
• Chapter 6: Cross-modal Machine Learning
– A human-subject study (presented as a work-in-progress paper at Haptics
Sym-posium 2018) conducted online using Amazon Mechanical Turk investigated the
extent to which human participants agreed with the Proton operator on numerical
ratings of basic haptic properties (hardness, roughness, stickiness, and warmness)
when examining close-up surface images. Correlation between operator and
par-ticipant ratings was found to be relatively low, indicating that the vision-based inference task is difficult even for humans.
– We approached the same task using machine learning: given images as input, infer
the numerical ratings of haptic adjectives. Performance was mixed but consistent
with the human-subject study, perhaps indicating that the task is not feasible as
– We further trained machine learning regression models to infer the values of the
quantitative vibration features from visual images.
• Chapter 7: Conclusion
– We detail suggestions for future work in this area, including ideas for researchers
designing their own custom haptic sensing systems, collecting multimodal datasets,
and building machine learning pipelines.
• Appendix A: Calibration
– Extrinsic calibration: we present a procedure that uses a grounded Vicon motion
tracking system to infer the relationship between various coordinate frames
at-tached to the Proton from data recorded while rotating the apparatus around a
fixed end-effector.
– Gravity compensation: a second calibration routine, using data from the Proton
being moved in free space without touching anything, analyzes Vicon motion
track and ATI Mini40 six-axis force/torque sensor output to discover the
constant-magnitude offset in the latter due to the end-effector mass.
• Appendix B: Surface List
– All surfaces contained in our publicly released dataset are listed, with the available
CHAPTER 2 : PROTON PACK HARDWARE
We designed custom hardware and software for the Proton Pack so that we could tailor it to
the kind of data we intended to collect while improving upon prior designs in specific ways.
The design most closely resembles a larger version of Culbertson et al.’s Haptic Camera [8], though with three specific differences: the attached cameras allow for recording synchronized
video, the entire device is portable, and in some configurations there are haptic sensors at
the contact point. Portability is achieved by carrying all supporting hardware in a backpack
and tracking motion via the onboard camera instead of a stationary system such as Vicon
or magnetic tracking.
The following sections first describe the handheld sensing rig, in the context of other
hap-tic sensing devices, followed by the supporting hardware contained in the backpack. A
description of the software may be found in the next chapter.
Over the course of development of the Proton, design iterations caused several changes in
the hardware configuration. These changes and their motivations are discussed as well, but
the most weight is given to the final design.
2.1. Background
The field of mechanical haptic sensing remains rather primitive compared to the
high-resolution, distributed sensing organ that we call skin. Some researchers are working on
skin-type sensors for robots [9] (see [10] for discussion and review), but their focus is often on discrete sensorized end-effectors. Common sensing technologies used as proxies for
repli-cating the human sense of touch include acceleration, force/torque, pressure and temperature
An accelerometer measures the acceleration of itself and any object to which it is rigidly
attached. One common application is in measuring an object’s quasistatic acceleration due
to gravity, which provides information about orientation. No doubt due in part to the
proliferation of smartphones and other devices with inertial measurement units (IMUs),
small solid-state accelerometers are available with a range of bandwidths. We choose a sensor with multiple axes and a high bandwidth so that we can filter out the constant offset
due to gravity and capture the high-frequency vibrations caused by different materials in
contact with each other. Notably, Strese et al. have developed a series of “Texplorer” tactile
sensing devices centered around accelerometers [11,12].
The Texplorer devices also use force-sensing resistors (FSRs) to measure the forces exerted
on a surface. These are uniaxial devices that measure applied force by changing their
resistance. In our apparatus, we use a multi-axis sensor based around a similar technology.
A force/torque sensor such as the ATI Mini40 six-axis force/torque sensor uses pairs of
strain gauges (sometimes spelled gages) as the basic sensing unit. A strain gauge is a
uniaxial elastic deformation measurement device. Essentially, it is a variable resistor that
changes resistance at a rate directly proportional to change in length (see Fig. 2.1 on the
following page for an illustration of the operating principle). With a rosette of strain gauges,
multi-axial strain can be measured. Finally, six strain gauges allow for the calculation of
torque as well. Force/torque sensors therefore consist of a stiff material with known
stress-strain relationship equipped with these stress-strain-gauges. Force and torque are calculated by
taking the difference between the readings of each gauge and transforming through a known
calibration matrix.
There is another way to measure force and torque, without using strain gauges. The key idea,
tracking the deflection of a material whose stiffness is known, remains crucial. Instead of
attaching sensors directly to this material, we illuminate it and train a camera or light sensor
on it. Examples of this type of sensor include the OptoForce, the TacTip end-effector [14],
Figure 2.1: Strain gauge schematic. Image from [13].
OptoForce bounces light from a laser diode off of the reflective inner surface and measures the light intensity reflected onto planar-distributed sensors. The TacTip is similar in structure,
but the inside of the rubber dome features an array of pins which deform when the dome
contacts a surface, and an internal camera observes the geometrical pattern to learn about
the surface shape. In the case of the GelSight sensor, a block of gel with a retroreflective
surface is illuminated by different colors, and a camera captures the change in appearance
when the gel is deformed by an object or surface.
Lastly, the most complex haptic sensor featured on the Proton is the SynTouch BioTac,
which does not directly measure force or vibration at all. Instead, it tries to mimic the human fingertip morphologically, having a flexible textured membrane filled with incompressible
Figure 2.2: BioTac sensor internals. Image from [16].
deforms and pushes the fluid around, changing the conductance seen by an array of electrodes on the underside of the fingertip. The sensor also measures global pressure and temperature
of the fluid. By analyzing this multimodal data, detailed information about the surface can
be extracted.
2.1.1. Related Work
A 1986 paper by Stansfield [17] was one of the first to try to adapt the principles inherent
to the human tactile system to create a robotic haptic perception system. While researchers
had previously thought of touch in terms of passive sensing, Lederman and Klatzky had just discovered that humans experience and identify surfaces via “exploratory procedures” [18],
specific movements that elucidate the desired haptic property of the object. For example,
pressing into an object reveals its softness, while moving one’s finger along a surface shows
its roughness and stickiness. Stansfield programmed a PUMA 560 robot arm equipped with
a 160-element tactile array and a force/torque sensor to physically interact in specific ways
with objects. Following such an approach requires one to design the movements, control the
robot to execute the desired interaction, and interpret the resulting haptic data.
Following in the vein of Stansfield’s early work, several haptic sensing systems have recently been developed for material or texture classification by autonomous robots. These systems
use many kinds of haptic sensors, such as an ATI Nano17 force/torque sensor [19],
or polyvinyledine fluoride (PVDF) sensing elements embedded in a soft material [21, 22].
Other researchers employ the commercially available SynTouch BioTac biomimetic tactile
sensor [23,24], described above. As established by Lederman, Klatzky, and colleagues [25,
26], changing the speed or force of the contact interaction typically alters the amplitude
and frequency of the resulting haptic signals, although the surface continues to feel the same to the person executing the movement. Consequently, these haptic sensing projects
all carefully controlled the physical interactions between the sensing system and the surface
in question, specifically using a custom test rig [23], a robotic arm [22], or an upper-torso
humanoid [20,19].
More recent work in this domain focuses on active perception. For example, Xu et al. [27]
used a robot-mounted BioTac to collect haptic surface data via exploratory movements such
as pressure, lateral sliding, and static contact. When attempting to identify an object, the
robot selects the motion that will provide the most disambiguation between likely object candidates. Similarly, Lepora et al. [28] compared the performance of passive and active
perception under uncertainty, showing that active touch can somewhat compensate for noisy
sensors. Having a robot wield the sensing system using a set of pre-programmed motions
typically yields consistent contact force and scanning movements and therefore repeatable
haptic signals. However, significant effort must be expended to program the interaction
controller to function well for a wide variety of surface properties, which are unknown at the
start. One must also ensure that the motion of the robot itself does not generate significant
tactile vibrations, as they may obscure the sensations caused by contact [29]. These robotic
touch systems must typically be closely supervised by a human experimenter and are not easily portable.
The other major approach to capturing haptic surface data is to use a handheld sensing
system wielded by a human experimenter. For example, Pai and Rizun created the WHaT,
a wireless haptic texture sensor that includes a pair of miniature two-axis accelerometers
pen-shaped shell [30]. This design allows measurement of natural surface interactions through
a probe at the WHaT’s tip. Being wireless allows this sensing system to have a large
workspace; however, one key disadvantage of this design is that the sensor cannot track its
global position or orientation. To solve this problem, Andrews et al. [31] added the ARTag
optical motion tracking system [32] to a WHaT probe, and they used a linear Kalman filter to compensate for noise affecting the motion tracking measurements. This system was used
to measure both stochastic and patterned textures and to estimate surface compliance [31].
Another haptic sensing device is the ThimbleSense [33], which is worn on a human or robotic
fingertip. It includes an ATI Nano17 six-axis force/torque sensor within a thin shell, which
provides enough information to calculate the contact point. An external Vicon system is
used to track the position of each fingertip, although interactions with grasped objects can
occlude these markers. Another force-sensor-based haptic capture system is that of Höver et
al. [34]; a human operator can intuitively explore real objects using a PHANToM Desktop haptic interface that is equipped with a custom probing tool and a Nano17. The captured
force data can be interpolated and used to model arbitrary non-linear materials with
visco-elastic behavior [34]. Finally, Culbertson and colleagues created a haptic recording device
that has some similarities to the one presented in this chapter. Their device is small and
pen-shaped, containing a six-axis force/torque sensor, high-bandwidth accelerometers, and
an external magnetic tracking system for position measurement [8]. Because the magnetic
system is not portable, textures to be recorded must be brought to the sensing system, and
the operator cannot record surfaces in situ. Handheld haptic recording systems show great
promise for efficient collection of naturalistic surface interaction data, but existing haptic datasets such as the Penn Haptic Texture Toolkit [35] tend to contain very limited visual
information about the included surfaces.
2.2. Architectural Considerations
Before discussing the handheld part of the Proton, some discussion must be given to the
Characteristic Human Robot
1 Repeatable path no yes
2 Controllable force and speed somewhat yes
3 Adapt interaction to surface yes maybe
4 Avoids parasitic vibrations yes no
5 Setup difficulty easy hard
6 Flexibility of procedure low high
7 Robustness high low
8 Cost low high
Table 2.1: Pros and cons of using a human or robotic approach to operating the Proton.
the previous section, both solutions are possible and we determined that handheld operation
would have more advantages for our intended application.
Both human-operated and robot-mounted tactile sensing strategies have been tried before. A robot will be able to follow a scripted interaction every time, with a selectable range of
applied forces and movement speeds, but it will have trouble tailoring the interaction to a
specific surface (for instance, satisfying force or positioning requirements while in contact
with a surface of unknown properties) unless extensive relative processing is done. A human
operator, on the other hand, will generally make non-repeatable motions but is much more
able to adapt motions to a particular surface. The human can make these adjustments to
avoid the end-effector damaging the surface (or vice versa), as well to gather more informative
data. To extract more information from the interaction, exploratory procedures can be adjusted according to estimated properties of the material. For example, Van Hoof et al. [36]
present an information gain framework for doing this adjustment with a robotic platform,
but a human operator provides a shortcut. Importantly, robots typically have characteristic
vibrations caused by their actuators (though the severity of this issue can be traded for cost),
while humans do not owing to a completely different mechanism of automation. These pros
and cons are summarized inTable 2.1.
Of these,row 1androw 2seem to favor a robotic approach, whilerow 3androw 4are current
technological limitations that are likely to be overcome in the future. However, further design considerations serve to shift the balance. Since we are trying to extract the maximum
is of prime importance. Furthermore, the disadvantage implied by row 2can be mitigated
by monitoring the force and speed (referred to as “scan-time parameters”) applied by the
operator, and collecting sufficient amounts of data to ensure a good distribution. Lastly,
nonrepeatability, though initially a seeming problem, can be spun as a desirable human
touch since we want to focus the data collection on the areas of scan time parameter-space that will give rise to the most information, and humans have pre-existing intuition about
where that is. For the type of flexible data collection that we envisioned, consideration of
the cost and complexity of setting up a robotic system tipped the balance in favor of r a
human operator.
Considering the overriding concern of avoiding parasitic vibrations, and having mitigated or
disregarded all of the concerns, we designed the Proton around a human operator. A rigid
assembly holding all the sensors in a constant configuration relative to each other is to be
carried by hand and used as a tool for touching surfaces in various ways, while supporting hardware (i.e., battery, power distribution, data recording and storage) is located in the
backpack. No physical display or control interface is built in – instead, configuration and
control are done over the Internet via a wireless network hosted by the backpack computer.
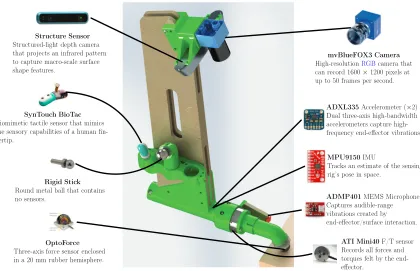
2.3. Handheld Rig
The handheld rig, shown in Fig. 2.3 on the next page, is designed around the operator’s
hands and contrasting goals for the visual and haptic modalities: the haptic sensors must
obviously touch the surface under study, while the cameras should be a significant distance away in order to get a wide field-of-view. In particular, to allow for the use of
structured-light depth cameras such as the Structure Sensor [37], the camera mount is placed 40cm
above the end-effector/surface contact point.
The base of the handheld rig is cylindrical and encloses anIMU. Above that, parallel plates
mvBlueFOX3 Camera
High-resolutionRGBcamera that can record 1600×1200 pixels at up to 50 frames per second.
ADXL335Accelerometer (×2) Dual three-axis high-bandwidth accelerometers capture high-frequency end-effector vibrations.
MPU9150IMU
Tracks an estimate of the sensing rig’s pose in space.
ADMP401MEMS Microphone Captures audible-range vibrations created by end-effector/surface interaction.
ATI Mini40F/T sensor Records all forces and torques felt by the end-effector.
Structure Sensor
Structured-light depth camera that projects an infrared pattern to capture macro-scale surface shape features.
SynTouch BioTac
Biomimetic tactile sensor that mimics the sensory capabilities of a human fin-gertip.
Rigid Stick
Round metal ball that contains no sensors.
OptoForce
Three-axis force sensor enclosed in a 20 mm rubber hemisphere.
Figure 2.3: Sensors on the handheld rig.
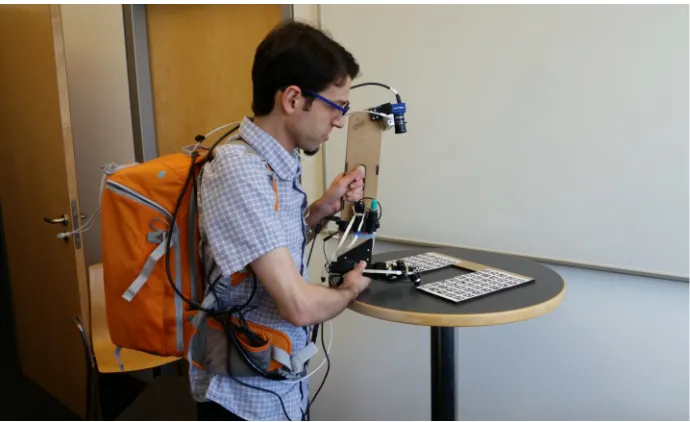
in the middle. As shown in Fig. 2.4 on the following page, the operator typically holds the
Proton with one hand on the handle and the other supporting the cylindrical base.
The cylindrical base is 3D-printed. Its two halves, which come apart to allow access to the
IMU mounted securely inside, are held together by a collar in the front. This collar holds
the Mini40, to which the end-effectors are attached using a quick-release clamp for easy
insertion and removal.
Three finger-shaped end-effectors may be clamped into the handle, differing only in the sensing hardware at the tip. Their 3D-printed shapes were dictated by the BioTac sensor,
which is intended to be held in a horizontal position, and a desire to have the point of contact
of all end-effectors at the same position relative to the rest of the rig. This design removes
a potential source of variation and simplifies the interpretation of the Mini40 readings.
Just below the handle is attached the “parking lot”. This innovative 3D-printed part
Figure 2.4: An experimenter holds the Proton, equipped with the OptoForce end-effector, in contact with a desk surface.
the Proton’s portability. The parking lot contains three keyed spaces where one of the
end-effectors can be placed when not mounted at the base. Internal limit switches detect
the presence of each end-effector, so the backpack computer can tell which end-effector is in
use and record data from the appropriate sensors.
All of the 3D-printed parts (shown in green inFig. 2.3on page15) were manufactured on a
Fortus 450mc FDM printer, using Nylon 12 with a0.005in layer resolution and solid fill.
2.3.1. Sensors
The Proton has two types of sensors: interchangeable and permanent. The three
inter-changeable end-effectors contain various haptic sensors. However, regardless of end-effector
choice several sensors are permanently mounted in fixed positions on the handheld rig. These
are the visual sensors, high-sensitivity force/torque sensor, and IMU. (High-bandwidth
ac-celerometers are always present, but they are mounted directly on the end-effectors so as to
The permanent sensors of the Proton fall into three main categories: visual, haptic, and
motion tracking. Originally, for calibration purposes and ease of prototyping, we used an
external motion tracking system. While such systems allow free movement within a given
three-dimensional space (several cubic meters), which would make the Proton more portable
than a desk-mounted system, this approach does not fulfill the design goal of a portable data collection device. Therefore, after finishing an initial proof of concept experiment, we
performed additional calibration in order to perform ungrounded motion tracking using the
onboard camera and fiducial markers placed in its field of view (see Sec. 2.3.1on page 19).
Cameras
Providing the Proton with the means to replicate high-acuity vision was an important design
goal. Humans can use 2D and 3D cues to infer surface properties before touching them, so
it’s an important sensory modality to include in our database. To this end, the Proton
features two cameras: a depth camera and a red-green-blue (RGB) camera.
The Structure Sensor is a compact structured-light depth camera. It uses an infrared
projector to overlay a pattern on the scene in its field of view, and an adjacent infrared
camera to detect how that pattern plays over objects at different distances. The technology
is similar to other depth cameras such as the Microsoft Kinect. Designed to be mounted on a
mobile device with its ownRGBcamera, the Structure does not include its own visible-light
camera.
The BlueFox is a high-end RGB camera. We use a mvBlueFOX3-1020C-2111 camera
with a Computar M2518-MPW2 or M1224-MPW2 lens. The latter lens has a wider field of
view (30.4◦
as opposed to 15◦
), which helps with motion tracking (seeSec. 2.3.1on page19). The camera records 1600×1200 pixel frames at up to50Hz.
When we record a surface using both of these cameras, the Proton acts as a
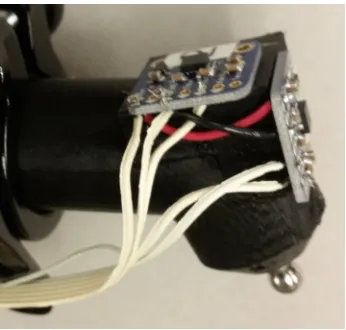
Figure 2.5: Final end-effector design with high-bandwidth accelerometers mounted orthog-onally and very close to the surface contact point.
Vibration
When interpreting the haptic properties of a surface by touching it with a tool, vibration
has a strong effect on how humans perceive the surface properties [38]. Tapping and drag-ging a tool on a surface produces characteristic vibrations at various frequencies. To capture
this information, the Proton uses two high-bandwidth accelerometers (ADXL335 in the final
version, though earlier we used the ADXL326) and a MEMS microphone (ADMP401). The
positioning of these sensors is shown in Fig. 2.3. At first, we mounted the high-bandwidth
accelerometers inside the Proton’s base to make them independent of the end-effector.
How-ever, pilot experiments confirmed that putting them closer to the end-effector resulted in
capturing more vibration data, so in the final version each end-effector has its own set of
ac-celerometers (shown inFig. 2.5). When mounting a given end-effector into the quick-release clamp, its accelerometers are connected via a six-pin connector (see Sec. 2.4.2on page 24).
The sensors themselves measure vibration on all three axes, but the Z-axis bandwidth is
lower than the other two axes, so we don’t want to use it. Instead, we take readings from
the X and Y axes of one accelerometer, then mount another accelerometer with its X or Y
Scan-time Parameters
With the sensors described in the previous section, we can measure with high fidelity the
vibrations caused by surface interaction. However, several factors besides the character
of the end-effector and surface influence these vibrations. These are characteristics of the
interaction itself, which we broadly term “scan-time parameters”. The most prominent
parameters are normal force and scanning speed. Since the Proton, having a human operator,
does not dictate these parameters exactly, we measure them.
Force To measure contact force, we use a Mini40 at the base of the Proton. (Note:
the OptoForce and BioTac end-effectors can measure force in some way, as described in
Sec. 2.3.2on page21, but we want to uniformly monitor the contact force independently of
which end-effector is active.) The sensor is mounted in between the end-effector mount point
and the rest of the Proton handle, as shown near the bottom of Fig. 2.3. This placement
ensures that all mechanical coupling of the end-effector to the Proton (excluding flexible
cables) goes through the Mini40, allowing it to capture all forces and torques. Cables are
taped down to minimize their contribution to any measurements.
The force and torque readings are obtained in the sensor’s local frame, which is rigidly
attached to the handheld rig. We would like to decouple the tangential and normal forces
to the surface, which requires transforming force vectors from the local to global frame. For this process we need to know the real-time orientation of the rig.
Motion At first, we used a straightforward yet undesirable method to track the Proton’s
motion through space: we attached infrared-reflective markers and used a
commercially-available Vicon motion tracking system. This system allowed us to track the rig anywhere
within view of the ceiling-mounted Vicon cameras, which is a three-dimensional volume
at least several cubic meters in size. However, it ties data collection to the fixed motion
Figure 2.6: “Tree” of infrared reflective markers that makes the handheld rig visible to the Vicon motion tracking system.
To set up Vicon tracking, we attach a fixture containing small spherical infrared-reflective
markers to the top of the handheld rig. Five markers in a non-coplanar, asymmetric
config-uration (shown inFig. 2.6) is enough to guarantee that when the Vicon system locks on, the
tracking is always pegged to the same orientation. The coordinate system attached to this
fixture is drawn in the Vicon software by hand, so it is not exactly aligned with any of the
other local frames. This problem is resolved by a custom calibration procedure described in
(a) Tooling ball (b) OptoForce sensor (c) BioTac sensor
Figure 2.7: Proton end-effectors
2.3.2. End-effectors
The three end-effectors which we have used for our data collection with the Proton were
chosen to represent those that might be present on a wide variety of hypothetical
haptic-sensing robots. They vary in haptic-sensing modalities at the contact point, as well as hardness
and friction characteristics.
Specifically, the three end-effectors end in a tooling ball, OptoForce sensor, and BioTac sensor respectively. These are shown in Fig. 2.7 and will be described more fully in the
following sections.
The end-effectors were redesigned after our first proof-of-concept experiment. The
improve-ments were validated in a second proof-of-concept [3].
Accelerometer Improvements
While the original design of the Proton called for high-bandwidth accelerometers in the
middle of the handle, we found that the vibration signal was muffled (seeFig. 4.8on page62).
Accordingly, the end-effectors were redesigned to mount the accelerometers as close to the surface contact point as possible. This is the configuration shown in Fig. 2.7.
First, we switched from ADXL326 to ADXL335 chips. Both are low-power MEMS
accelerom-eters with analog outputs and X/Y axis bandwidths of 0.5−1600Hz, the only difference
being output range: ±16g for the former and ±3g for the latter. Since we are
measur-ing relatively low-magnitude vibrations, the narrower output range means less quantization
error when digitizing the readings.
Second, we use both the ADXL326 and ADXL335 by way of Adafruit breakout boards,
which have built-in filter capacitors. The capacitors are 0.1µF which filters the output to
a bandwidth of 50Hz. This is good for typical IMU applications which need to filter out
vibration noise for stable motion tracking, but it attenuates the high-frequency vibrations
where we expect valuable information about the surface to be present [19, 4]. Therefore,
we replaced the filter capacitors with smaller4.7nF components, increasing the bandwidth
to 1064Hz, which is comparable to the 1000Hz bandwidth of the accelerometers used by
Culbertson et al. [8,39] as well as Romano and Kuchenbecker [19].
Tooling Ball
The simplest end-effector sports a steel tooling ball. Our custom 3D-printed end-effector
housing is shown with the tooling ball in Fig. 2.7a. Other than the high-bandwidth
ac-celerometers, there are no haptic sensors on the end-effector. However, it is hard and rigid,
meaning all forces and vibrations are transferred to the Mini40 with a minimal amount of
damping.
This end-effector is meant to represent robots that have no innate haptic sensing capabilities,
but may have other common sensors (such as accelerometers) that can be repurposed as such. At $20-$21 depending on diameter,1 the tooling ball is an inexpensive end-effector.
Tooling Ball Diameter Several tooling balls of different diameters were used in different
Proton design iterations, including 0.75in, 0.375in, and 0.125in, before settling on the
1
0.375in ball. Originally, the larger diameter was selected to make the end-effector relatively
heavy, guaranteeing high amplitude of forces and vibrations during surface interactions.
Later, that concern about low measurements turned out to be overblown, and we switched
to smaller tooling balls in order to resolve smaller surface contours. This redesign is covered
inSec. 4.5.2on page 63.
OptoForce
As introduced above, the OptoForce is a hemispherical rubber sensor that measures force by
recording the hemisphere’s deformation. We designed the end-effector housing (seeFig. 2.7b)
such that the surface contact point of the tooling ball and the OptoForce sensor would be
similarly positioned with respect to the body of the Proton. Force readings in all three axes
are generated, but only the Z axis is calibrated.
At¤750-900, this sensor is mid-range in terms of price and quality.
BioTac
As discussed above, the BioTac measures pressure, shape, pressure, and temperature in a
fingertip-shaped package. Our BioTac mounted in its end-effector is shown in Fig. 2.7c.
Similarly to the OptoForce mounting, this end-effector is designed to position and orient the
sensor so that the surface contact point is close to where the tooling ball would be, from the
perspective of the Proton base.
This end-effector is the most costly (approximately $12,000 per fingertip) and high fidelity of
the three, though its readings are not directly relatable to force or other commonly measured
haptic quantities.
2.4. Backpack
Many sensing systems require extensive supporting hardware. It’s not uncommon to see
power supply, function generator, and more. For the Proton, we wanted to eliminate all
factors that would tie the system to a lab bench, which meant finding a way for the operator
to carry a power supply, a computer to interface with hardware and record data, and any
additional hardware specific to the individual sensors (most notably, a signal conditioner for
the Mini40 and a daughterboard to interface with the analog sensors).
To meet these needs, we designed a backpack-enclosed support system including power
distribution circuitry which runs from AC or battery power, a miniature computer, as well
as the aforementioned signal conditioner and daughterboard.
2.4.1. Power Distribution
A high-level schematic of the hardware carried by the operator is shown inFig. 2.8 on the
next page. Double-lined boxes denote components on the handheld rig, while the rest is
contained in the backpack.
As seen in the upper right-hand corner of the figure, the entire system is powered from a
12V battery. This may be replaced with an AC adapter producing 12−19V when the
Proton is used in a stationary configuration. This main power source is connected directly
to the computer and, through a voltage regulator, to the Mini40 signal conditioner, Teensy
daughterboard, and a USB hub. As described in the following section, this daughterboard
handles the analog sensors and all data is eventually received by the computer through the
USB hub.
2.4.2. Smart Task Board
Some sensors natively communicate over USB (namely the cameras, OptoForce and BioTac),
but the rest require a lower-level interface. The Mini40, high-bandwidth accelerometers and
microphone output analog voltages that need to be converted to digital values. The IMU
consists of digital sensors, and outputs readings using the inter-integrated circuit (I2C)
Mini40
microphone accelerometer 1 accelerometer 2 IMU
OptoForce Structure BlueFox BioTac
5 V regulator
12 V battery
DAQ
wrist
board Cheetah
ADC
signal conditioner
parking lot
Teensy
USB hub
NUC computer
power data and power
Figure 2.8: Wiring diagram of rig and backpack. Reprinted from [2] © 2016 IEEE.
To manage this assemblage of sensors, we use a modified version of the “Smart Task Board”
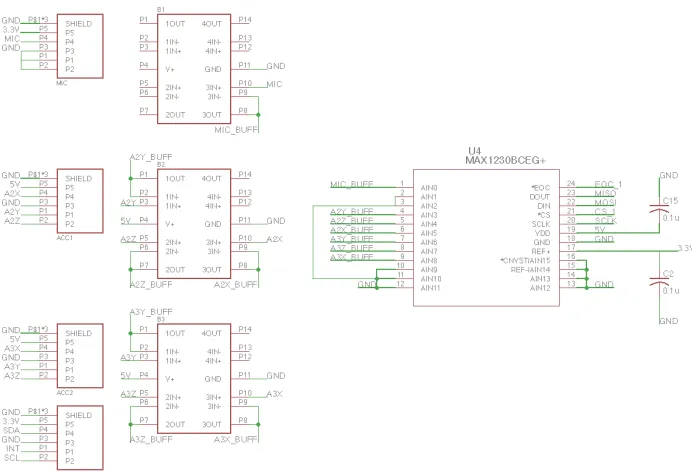
developed by Brown et al. for an earlier project [40]. Diagrammed inFigs. 2.9through2.13 on pages26–28, it features a differential amplifier necessary to condition the Mini40 readings,
analog-to-digital converters (ADCs) to digitize the Mini40, accelerometer and microphone
readings, and a Teensy 3.1 microprocessor to tie it all together. The Teensy’s firmware is
described in Sec. 3.1.2.
2.4.3. NUC Computer
We chose an Intel NUC5i3RYK as the nerve center of the Proton. This computer is quite
compact and comes with a Core i3 CPU,120GB disk space plus4GB RAM, and connectivity
including HDMI output, internal WiFi, Ethernet, and four USB3.0 ports. All storage is solid-state, meaning there are minimal moving parts to be damaged by vibration or impact when
carrying the Proton. The connectivity allows us to read from all of the sensors in real time
as well as wirelessly receive control signals. As described in the next chapter, the Proton
is not normally connected to traditional input/output devices such as mouse, keyboard and
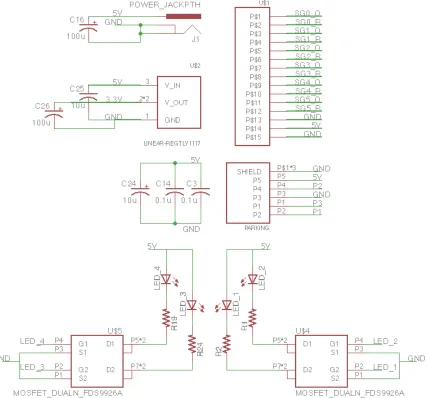
Figure 2.9: Schematic of power distribution circuit. Input power at5V is regulated to3.3V,
Figure 2.10: Schematic of Teensy daughterboard and peripherals. This diagram shows the power (right side) and the input/output pins (left side) of the Teensy 3.1. The Teensy controls the four status LEDs and communicates with sensors over the serial peripheral interface (SPI) andI2Cprotocols. While collecting sensor data, it sends data packets to the
onboard computer at3000Hz.
Figure 2.12: Schematic of analog sensor acquisition circuit. This part of the circuit covers the
analog accelerometers and the microphone. Another MAX1230ADCconverts measurements
from each accelerometer channel and the microphone. Also included in the lower left is the connector to theIMU, which does not need anADC but sends its accelerometer, gyroscope and magnetometer readings to the Teensy over I2C.
2.5. Summary
This chapter presented the design and implementation of the Proton, a versatile
visuo-haptic sensing system that will be used to gather a dataset we hope will be broadly useful
to robotics researchers and their robotic platforms. The Proton contains sensors that span
relevant parts of the haptic and visual perceptual space, designed to gather the types of
data encountered by many different robots, which may have haptic sensors, visual sensors
(2D or 3D), or both. Some robots may query our database in order to identify an unknown surface. Others may be trying to predict haptic sensations given visual data, or the reverse.
I also laid out the reasoning behind design decisions and tradeoffs we made, such as our
choice of a human operator and the selection of visual and haptic sensors. For the latter, we
tried to represent the wide range of haptic sensing capabilities that is likely to be represented
by real-world robots.
Hardware is only one part of the story. The next chapter will detail the software that
CHAPTER 3 : SOFTWARE
The hardware design detailed in the previous chapter provides the physical capability to
collect data, but many layers of software were involved in the project, several of them
custom-designed for the Proton Pack. This chapter details the software that runs on the Intel NUC (user interface and data recording), on the Teensy daughterboard (low-level
firmware), and on other computers for post-processing and analyzing the collected data.
3.1. Data Collection
The custom supervisor software that runs in real time on the Proton computer, interfacing
with the operator and recording data from the sensors, is written in Rust. Rust is a new
systems programming language that puts an emphasis on safety (i.e., avoiding crashes, data
corruption and undefined behavior) while running quickly and supporting data-race-free
concurrency. These properties were important in writing software with many independent modules that record data simultaneously from various sensors. In normal operation the
computer is operated in a headless fashion (communication only over wi-fi, without a mouse,
keyboard or monitor attached), so the supervisor must not crash.
3.1.1. General Architecture
The supervisor is organized into one manager thread and a number of separate services,
which each run on their own thread and communicate via message passing (see Fig. 3.1 on
the following page). A service is either a driver (communicating directly with a sensor) or user interface, but the message passing interface is the same. The messages are organized
as commands sentto services (start, stop, and data) and events bubbling up from services
Supervisor thread Console
interface
Web interface
Teensy driver BioTac
driver OptoForce
driver
BlueFox driver
Structure driver
Writer thread
Figure 3.1: Block diagram of supervisor software. Ovals represent the controlling threads (one to supervise the sensors, and one to write data to disk), while rectangles represent the threads that interface with the sensors and the operator.
of the data message are targeted at a particular service and contain some payload that the
service understands (e.g., capturing a camera frame or changing the sampling rate of an
accelerometer).
The goal of each sensor driver is to operate at the speed of the sensor so as not to miss any
data. Accordingly, the drivers send their data to a dedicated “scribe” thread that writes to
the hard drive. It is possible to have each sensor thread write data as it becomes ready, but
in this situation the threads end up contending with each other and slowing each other down.
By sending the data to be written to the writer thread, writes are automatically serialized
and the sensor threads do not have to wait for the disk before taking another reading. Every data packet is individually timestamped to ensure accurate temporal analysis.
Each service has a “step” function where it executes a repetitive action or responds to
messages, and the manager thread repeatedly invokes this function in one of threeblocking
modes. Inimmediatemode, used for services that are IO-bound or CPU-bound but otherwise
should run as fast as possible, the step is called again as soon as it finishes. Ininfinite mode,
the step is not called unless there is a message to process. Lastly, a service can specify a
rate). In this case, the manager thread uses a timer to try to match this period by inserting
a delay in between steps. Using a simple proportional controller, the delay is adjusted every
100 steps to compensate for the time taken by the step function itself.
3.1.2. Sensor Drivers
This section provides more details about the driver for each of the Proton’s sensors. The
drivers are launched in separate threads and activated only when a particular sensor is
selected for data collection.
Structure
The driver for the depth camera wraps OpenNI 2 [41], which is a general purpose interface
to “Natural Interaction” (i.e., Kinect-type) sensors. We read depth frames at 30 Hz at a
resolution of 1280×1024 pixels in the “100 µm” format. (It is also possible to read raw
infrared frames at 30 Hz, 640×480pixels, but this capability is needed only for debugging
purposes since the Structure sensor itself runs the scan-matching algorithm to calculate the
depth image.) Each frame is written to disk in a raw format, while timestamps are recorded
in a comma-separated value (CSV) file. On request, the driver encodes single frames to
portable network graphics (PNG) and sends them to the web app; these images facilitate
semi-real-time display and let the user check that the camera is working.
Bluefox
The architecture of the Bluefox driver is similar to that of the Structure driver, with some
extra features. Matrix Vision provides themvDeviceManager library, which is a
comprehen-sive object-oriented C API for accessing and configuring Matrix Vision cameras. Wrapping this vendor-provided driver, we use a pull model for retrieving camera images, requesting
a frame and waiting for the low-level driver to provide a buffer filled with captured pixels.
This buffer must be released before the thread can request another frame, so it is copied
![Figure 2.1: Strain gauge schematic. Image from [13].](https://thumb-us.123doks.com/thumbv2/123dok_us/9227437.1458231/26.612.216.432.67.407/figure-strain-gauge-schematic-image-from.webp)