*Address for correspondence
E-mail: kaila_harshad@yahoo.co.in
A New Improved RP-HPLC Method for Assay of
Rosuvastatin Calcium in Tablets
H. O. KAILA*, M. A. AMBASANA, R. S. THAKKAR, H. T. SARAVAIA AND A. K. SHAH
National Facility for Drug Discovery through New Chemical Entities Development and Instrumentation Support to Small Manufacturing Pharma Enterprises, Department of Chemistry, Saurashtra University, Rajkot-360 005, India
Kaila, et al.: RP-HPLC determination of rosuvastatin calcium
A reliable and sensitive isocratic stability indicating RP-HPLC method has been developed and validated for assay of rosuvastatin calcium in tablets and for determination of content uniformity. An isocratic separation of rosuvastatin calcium was achieved on YMC C8, 150×4.6 mm i.d., 5 µm particle size columns with a fl ow rate of 1.5 ml/min and using a photodiode array detector to monitor the eluate at 242 nm. The mobile phase consisted of acetonitrile: water (40:60, v/v) pH 3.5 adjusted with phosphoric acid. The drug was subjected to oxidation, hydrolysis, photolysis and thermal degradation. All degradation products in an overall analytical run time of approximately 10 min with the parent compound rosuvastatin eluting at approximately 5.2 min. Response was a linear function of drug concentration in the range of 0.5-80 µg/ml (r2= 0.9993) with a limit of detection and quantifi cation of 0.1 and 0.5 µg/ml respectively. Accuracy (recovery) was between 99.6 and 101.7%. Degradation products resulting from the stress studies did not interfere with the detection of rosuvastatin and the assay is thus stability-indicating.
Key words: Content uniformity, drug formulation, HPLC-PDA, method validation, Rosuvastatin calcium, stability- indicating
Research
Research Paper
Paper
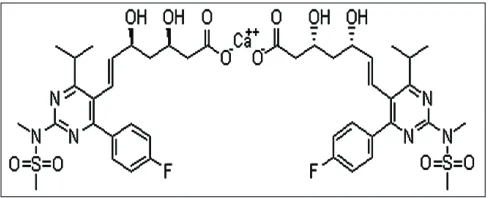
Rosuvastatin calcium is chemically,
bis[(E)-7[4-(4-fl uorophenyl)-6-isopropyl-2-[methyl (methyl-sulphonyl) amino]pyrimidin-5-yl](3R,5S)-3,5-dihydroxyhept-6-enoic acid] calcium salt (fi g. 1). It belongs to a class of drugs called statins, which are employed to lower hypercholesterolemia and related conditions and to prevent cardiovascular diseases. It increases the number of hepatic low density lipoprotein receptors involved in the catabolism of LDL and also inhibits hepatic synthesis of very low density lipoprotein[1-3].
A detailed survey of analytical literature for rosuvastatin revealed few methods based on a variety of techniques such as UV-spectrophotometry[4], high
performance thin layer chromatography (HPTLC)
[5] and HPLC[6,7]. Since a HPLC method has many
advantages over that of a HPTLC method for quantitation, HPLC is often the first choice for developing an analytical method as compared to HPTLC. Till date, none of the reported analytical procedure describe a simple, satisfactory and validated HPLC method for studying the effect of stress on pharmaceutical dosage forms as well as for assay and
Fig. 1: Structure of rosuvastatin calcium
determination of content uniformity of rosuvastatin calcium in tablet dosage forms. Table 1 shows comparison of published methods with the developed method.
The objective of this work was to de velop a simple, precise, reliable and rapid stability-indicating liquid chromatographic analytical method for assay of rosuvastatin calcium and for determination of the content uniformity of a tablet formula tion, to validate the method in accor dance with ICH[8] guidelines.
The validation procedure followed the guidelines of USP 30[9]. The method was successfully used for
Determination of content uniformity is nowadays, an important test included in USP 30[9]. Since there is no
literature report of a validated analytical method for determination of the content unifor mity of rosuvastatin calcium in pharmaceutical dos age forms (10 mg) this was performed in the current work.
MATERIALS AND METHODS
Rosuvastatin calcium reference standard (label claim 99.8% pure) was provided by Glenmark Pharmaceuticals Ltd., Ankleshwar, India. Tablets of rosuvastatin calcium, Zyrova, with a 10 mg label claim, manufactured by Zydus Cadila, Ahmedabad, India were procured from a local pharmacy. HPLC grade acetonitrile and orthophosphoric acid were obtained from Merck India Limited, Mumbai, India. Analytical grade hydrochloric acid, sodium hydroxide pellets and hydrogen peroxide solution 30% (v/v) were obtained from Ranbaxy Fine Chemicals, New Delhi, India and 0.45 μm membrane filter was obtained from Pall Life Sciences, Mumbai, India. High purity deionised water was obtained from a Milli-Q (Millipore, Milford, MA, USA) purifi cation system.
Chromatography:
The chromatographic system used to perform development and validation of this assay method consisted of an LC-10ATvp binary pump, an SPD-M10Avp photodiode array detector and a Rheodyne manual injector model 7725i with 20 μl loop (Shimadzu, Kyoto, Japan) connected to a multi-instrument data acquisition and data processing system
(Class-VP 6.13 SP2, Shimadzu). Chromatographic analysis was performed on YMC C8 (150˜4.6 mm id, 5 μm particle size) column. Separation was achieved using a mobile phase consist of acetonitrile-water (40:60, v/v) solution at a flow rate of 1.5 ml/min. The eluent was monitored using PDA detector at a wavelength 242 nm. The column was maintained at ambient temperature and injec tion volume of 20 μl was used. The mobile phase was fi ltered through 0.45
μm fi lter prior to use.
Preparation of stock, standard and test solutions: Stock solution (500 μg/ml) of rosuvastatin calcium reference standard was pre pared by transferring 25 mg, accurately weighed, into a 50 ml volumetric fl ask and adding 20 ml water- acetonitrile (50:50, v/v). The mixture was sonicated for 2 min to dissolve the rosuvastatin calcium and the solution was then diluted to volume with the same solvent mixture. Standard solution (50 μg/ml) was prepared by diluting 5 ml stan dard stock solution to 50 ml, in a volumetric
fl ask, with the same solvent mixture.
To prepare stock solution (500 μg/ml) for assay, 20 tablets were weighed and mixed. An aliquot of powder equivalent to the weight of 5 tablets was accurately weighed and transferred to 100 ml volumetric fl ask. Water-acetonitrile (50:50, v/v), 60 ml was added to the fl ask and the mixture was sonicated for 10 min with normal hand shaking. The contents of the fl ask were then left to return to room temperature and diluted to volume with the same solvent mixture. This solution (10 ml) was fi ltered through a 0.45-μm nylon syringe fi lter.
TABLE 1: COMPARISON OF PUBLISHED METHODS WITH DEVELOPED METHOD
Parameters Sankar et al.[7] Gomes et al.[8] Present method
Column RP-C18 (250×4.6 mm), 5 μm Lichrospher RP-C18 (250×4.6 mm), 5
μm
YMC C8 (150×4.6 mm), 5 μm
Mobile phase Water: acetonitrile (48:52, v/v) pH
3.0 phosphoric acid, containing 0.3% triethylamine
Methanol: water (60:40, v/v) pH 3.0 using phosphoric acid
Acetonitrile: water (40:60, v/v) pH 3.5 using phosphoric acid
Flow rate 1.0 ml/min 1.0 ml/min 1.5 ml/min
Detector UV UV PDA
Wave length 245 nm 238 nm 242 nm
LOD NA 1.55 (μg/ml) 0.1 (μg/ml)
LOQ NA 4.7 (μg/ml) 0.5 (μg/ml)
Linear range 5-30 (μg/ml) 6-22 (μg/ml) 0.5-80 (μg/ml)
R2 0.9999 0.999 0.9993
Stability study NA NA Solution stability, forced degradation study
and content uniformity were done
Remarks Less precise and accurate Less sensitive and accurate More sensitive, reliable and accurate
To prepare test solution (50 μg/ml) for assay 5 ml test stock solution was transferred to 50 ml volumetric flask and diluted to volume with water-acetonitrile (50:50, v/v). To prepare test solution (50 μg/ml) for determination of content uniformity one tablet was accurately weighed and transferred to a 200-ml volumetric fl ask. Water-acetonitrile (50:50, v/v) 100 ml was added to the fl ask and the mixture was sonicated for 10 min with normal hand shaking. The contents of the fl ask were left to return to room temperature, then diluted to volume with the same solvent mixture and
fi ltered through a 0.45 μm nylon syringe fi lter. Twenty tablets were weighed and the average weight of a tablet was used for assay calculation.
Method validation:
In the developed method, by using same concentration of analyte for the assay and for determination of content uniformity, both methods could be validated simultaneously except for determination of precision. The specifi city of the method was evaluated to ensure there was no interference from placebo components (prepared in solution) or from products resulting from forced degradation.
Forced degradation studies[10]:
To perform the forced degradation study 50 mg drug was subjected to acidic, alkaline, oxidizing, thermal and photolytic conditions. For acidic degradation the drug was heated under refl ux with 0.1 M HCl at 80° for 2 h and the mixture was neutralized. For alkaline degradation the drug was treated with 0.1 M NaOH at 80° for 2 h and the mixture was neutralized. For degradation under oxidizing conditions the drug was heated under refl ux with (6%, v/v) H2O2at 80° for 2 h. For thermal degradation the powdered drug was exposed at 70° for 48 h. For photolytic degra dation the powdered drug was exposed to sunlight for 48 h. The placebo was also subjected to the same stress con ditions to determine whether any peaks arose from the declared excipients. After completion of the treatments the solutions were left to return to room temperature and diluted with water-acetonitrile (50:50, v/v) to furnish 50 μg/ml solutions. The purity of the drug peak obtained from the stressed sample was measured using PDA detector. Fig. 2 shows the chromatogram of untreated drugs in tablet solution.
Linearity:
Eight solutions were prepared containing 0.5, 20, 30, 40, 50, 60, 70 and 80 μg/ml rosuvastatin calcium,
concentrations which corresponded to 1, 40, 60, 80, 100, 120, 140 and 160%, respectively, of the test solution concentration. Each solution was injected in duplicate. Linearity was evaluated by linear-regression analysis.
Precision:
System precision was evaluated by analyzing the standard solution five times and method precision (repeatability) was evaluated by assaying six sets of test samples prepared for assay determination and ten sets of samples prepared for determination of content uniformity, all on the same day (intra-day precision). System precision and method precision were also determined by performing the same procedures on a different day (inter-day precision), and by another person under the same experimental conditions (intermediate precision).
Accuracy:
Accuracy was assessed by determination of the recovery of the method at three different concentrations (corresponding to 50, 100 and 150% of test solution concentration) by addition of known amounts of standard to placebo preparation. For each concentration, three sets were prepared and injected in duplicate.
Robustness:
The robustness of the method was evaluated by assaying test solutions after slight but deliberate changes in the analytical conditions. The factor chosen for this study were the flow rate (±0.1 ml/ min), mobile phase composition (acetonitrile-water, 38:62 and 42:58, v/v) and using a different batch of HPLC column.
Solution stability:
Stability in solution was evaluated for the standard
solution and the test preparation. The solutions were stored at 5° and at ambient temperature without protection of light and tested after 12, 24, 36 and 48 h. The responses for the aged solution were evaluated by comparison with freshly prepared solutions.
System suitability:
The suitability of the chromatographic system was tested before each stage of validation. Five replicate injections of standard preparation were injected and asymmetry, number of theoretical plates and relative standard deviation of peak area were determined.
RESULTS AND DISCUSSION
In this work an analytical HPLC method for assay and determination of content uniformity of rosuvastatin calcium in a tablet for mulation was developed and validated. The basic chromatographic conditions were designed to be simple and easy to use and reproduce and were selected after testing the different conditions that affect HPLC analysis, for example column, aqueous and organic components of the mobile phase, proportion of mobile phase components, detection wavelength, diluents and concentration of analyte. The YMC Pack C8 column was used because of its advantages of high resolving capacity, better reproducibility, low-back pressure, and low tailing. For mobile phase selection, preliminary trials using mobile phases of different composition containing water adjusted to acid pH by addition of orthophosphoric acid and methanol resulted in poor peak shape. When methanol was replaced by acetonitrile better peak shape was obtained. The proportion of the mobile phase components was optimized to reduce retention times and enable good resolution of rosuvastatin calcium from the degradation products. A detection wavelength of 242 nm was selected after scanning the standard solution over the range 190-370 nm by use of the PDA detector. Detection at 242 nm resulted in good response and good linearity.
The drug substance was easily extracted from the pharmaceutical dosage form using water-acetonitrile (50:50, v/v). The tablet dispersed readily in water and the drug substance was freely soluble in acetonitrile. Solutions of standard and test preparations were found to be stable in this solvent mixture. By using the same concentration of analyte for assay and for determination of content uniformity both
methods could be validated simultaneously except for determination of precision.
After development of the analytical method, it was validated in accordance with ICH[8] and USP[9]
guidelines. This furnished evidence the method was suitable for its intended purpose. The specificity of the method was determined by checking for interference with the drug from placebo components. The specifi city of the method was also evaluated by checking the peak purity of the analyte peak during the forced degradation study. The peak purity of the rosuvastatin peak under different stress conditions was 1.00, which is satisfactory and indicates there was no interference with the analyte peak from degradation products. Major degradation up to 57% occurred under acidic conditions (fig. 3a). Under alkaline conditions the drug was degraded by approximately 36% (fig. 3b). The drug was approximately 32% degraded under oxi dizing conditions (fig. 3c). The drug was degraded 15% under thermal condition (fi g. 3d) and 30% degradation occurred under photolytic conditions (fi g. 3e).
To determine linearity a calibration graph was obtained by plotting rosuvastatin calcium concentration against peak area. Linearity was good in the concentration range 0.5-80 μg/ml. The regression eqn. was y= 46,956x+85,486 where x is the concentration in μg/ml and y is the peak area in absorbance units; the correlation coefficient was 0.9993.
covering the range of the method. Known amounts of rosuvastatin calcium (25, 50, and 75 μg/ml) were added to a placebo prepa ration and the amount of rosuvastatin recovered, in the presence of placebo interference, was calculated. The mean recovery of rosuvastatin calcium was between 99.6 and 101.7%, which is satisfactory (Table 2).
The robustness of the method was assessed by assaying test solutions under different analytical conditions deliber ately changed from the original condi tions. For each different analytical condition the standard solution and test solution were prepared separately. The result obtained from assay of the test solution was not affected by varying the conditions and was in accordance with the true value. System suitability data were also found to be satisfactory during variation of the analytical conditions (Table 3). The analytical method there fore remained unaffected by slight but deliberate changes in the analytical conditions.
During study of the stability of stored solutions of standards and test prepara tions for assay determination the solu tions were found to be stable for up to 36 h. Assay values obtained after 36 h were statistically identical with the initial value without measurable loss (Table 4).
Before each measurement of valida tion data a system suitability test was performed by measurement of general characteristics such as peak asymmetry, number of theoretical plates and RSD (%) of peak area observed for a standard solution. The values obtained were satisfactory and in accordance with in-house limits (Table 5).
The intensive approach described in this manuscript was used to develop and validate a liquid chromatographic ana lytical method that can be used for both assay and determination of content uni-formity of rosuvastatin calcium in a pharmaceutical dosage form. Degradation products produced as a result of stress did not interfere with detection of rosuvastatin calcium and the assay method can thus be regarded as stability indicating.
This HPLC method for assay and determi nation of content uniformity of rosuvastatin calcium in a tablet formulation was successfully developed and validated for its intended purpose. The method was shown to specifi c, linear, precise, accu rate, and robust. Because
Minutes
0 1 2 3 4 5 6 7 8 9 10
mAU
0 100 200
Rosuvastatin
Minutes
0 1 2 3 4 5 6 7 8 9 10
mAU
0 100 200
Rosuvastatin
Minutes
0 1 2 3 4 5 6 7 8 9 10
mAU
0 100 200
Rosuvastatin
5
mAU
0 100 200
Minutes
0 1 2 3 4 5 6 7 8 9 10
mAU
0 100 200
Rosuvastatin
Minutes
0 1 2 3 4 6 7 8 9 10
Rosuvastatin
Fig. 3: Chromatogram of forced degradation study.
Chromatogrphic profi les of rosuvastatin tablets after subjecting them to (a) acidic, (b) alkaline, (c) oxidative, (d) thermal and (e) photolytic degradation
significant variation; this is in accordance with the USP[9], which stipulates acceptance limits for drug
content uniformity and RSD as 85-115 % and <6 %, respectively.
The accuracy of the method was assessed by determination of recovery for three concentrations
a
b
c
d
forms, this method is recommended to the industry for quality control of drug content in pharmaceutical preparations.
ACKNOWLEDGEMENTS
The authors are grateful to the Glenmark Pharmaceuticals, Ankleshwar, India and Department of Chemistry, Saurashtra University (UGC-SAP Sponsored and DST-FIST Funded) Rajkot, Gujarat, India, respectively, for the gift samples of rosuvastatin calcium reference standard and for providing instrumental facilities. Special thanks are due to “National Facility for Drug Discovery through New Chemical Entities (NCE’s) Development and Instrumentation Support to Small Manufacturing Pharma Enterprises” Programme under Drugs and Pharma Research Support (DPRS) jointly funded by Department of Science & Technology, New Delhi, Government of Gujarat Industries Commissionerate and Saurashtra University, Rajkot.
REFERENCES
1. Sweetman SC, Martindale The Complete Drug Reference. 34th ed.
TABLE 2: ACCURACY STUDY DATA
Level % No Amount of drug added
(μg/ml) Amount of drug found (μg/ml) Recovery (%) Mean recovery (%) RSD (%)
50 1 25.21 25.18 99.88 100.55 0.78
2 25.41 25.77 101.42
3 25.52 25.61 100.35
100 1 50.4 50.25 99.70 99.59 0.12
2 50.83 50.56 99.47
3 50.72 50.51 99.59
150 1 74.97 76.02 101.40 101.66 0.23
2 75.24 76.55 101.74
3 75.45 76.84 101.84
RSD = Relative standard deviation
TABLE 3: ROBUSTNESS STUDY DATA
Conditions Assay (%) RT (min) System suitability data
Theoretical plates Asymmetry
1.4 ml/min Flow 101.21 5.93 8560 1.15
1.6 ml/min Flow 101.63 4.86 9102 1.11
Acetonitrile : water (38:62, v/v) 99.95 5.91 8643 1.10
Acetonitrile : water (42:58, v/v) 100.16 4.90 8751 1.08
Column change 99.84 5.41 7866 1.12
TABLE 4: SOLUTION STABILITY STUDY DATA
Time intervals, h Difference between assays for standard solution (%) Difference between assays for test solution (%)
At 5° At room temperature At 5° At room temperature
12 1.49 1.67 0.11 0.21
24 1.51 1.71 0.18 0.28
36 1.62 1.92 1.58 1.78
48 2.02 2.45 2.14 2.19
TABLE 5: SYSTEM SUITABILITY DATA
System
suitability data RSD
a (%) Theoretical plates Asymmetry
In-House limit NMTb2.0 NLTc 8000 NMTb2.0
Specifi city 0.62 8441 1.05
Linearity 0.28 8544 1.02
Precision
For Assay 0.45 8640 1.06
For Content
uniformity 0.37 8721 0.98
Intermediate Precision
For Assay 0.41 8667 1.01
For Content uniformity
0.55 8327 1.06
Accuracy 0.34 8591 1.00
Solution stability 0.27 8638 0.99
Robustness 0.46 8212 1.02
aRelative standard deviation, bnot more than, cnot less than
Accepted 20 September 2010 Revised 26 August 2010 Received 30 December 2009 Indian J. Pharm. Sci., 2010, 72 (5): 592-598 London: Royal Pharmaceuitical Society of Great Britain; 2005. p. 996.
2. Lennernas H, Fager G. Pharmacodynamics and pharmacokinetics of the HMG-CoA reductase inhibitors, similarities and differences. Clin Pharmacokinet 1997;32:403-25.
3. Nissen S, Nicholls S, Sipahi I, Libby P, Raichlen JS, Ballantyne CM, et al. Effect of very high-intensity statin therapy on regression of coronary atherosclerosis: the ASTEROID trial. J Am Med Assn 2006;295:1556-65.
4. Gupta A, Mishra P, Shah K. A simple UV Spectrometric determination of rosuvastatin calcium in pure form and pharmaceutical formulations. E J Chem 2009;6:89-92.
5. Sane RT, Kamat SS, Menon SN, Inamdar SR, Mote MR. Determination of rosuvastatin calcium in it’s bulk drug and pharmaceutical preparations by high- performance thin layer chromatography. J Planar Chromatogr Mod TLC 2005;18:194-8.
6. Sankar GD, Babu JP, Kumar AB, Krishna VM. RP- HPLC method for the estimation of rosuvastatin calcium in bulk and pharmaceutical dosage form. Acta Ciencia Indica Chem 2007;33:1-4.
7. Gomes F, Garcia P, Alves J, Singh A, Kedor-Hackmann E, Santoro M. Development and validation of stability – indicating HPLC methods for quantitative determination of pravastatin, fl uvastatin, atorvastatin and rosuvastatin in Pharmaceuticals. Anal Lett 2009;42:1784-804. 8. ICH, Harmonized Tripartite Guideline, Validation of Analytical
procedure: Text and Methodology, Geneva, Switzerland. 2006. 9. The United States Pharmacopoeia. 30th Revision. Rockville, MD: US
Pharmacopoeia Convention Inc.; 2007.