Veterinary Medicine: Research and Reports 2017:8 87–96
Veterinary Medicine: Research and Reports
Dovepress
submit your manuscript | www.dovepress.com 87
O R I G I N A L R E S E A R C H
open access to scientific and medical research
Open Access Full Text Article
The effect of recumbency position on the
ultrasound measurement of the canine adrenal
gland in non-adrenal gland illness
Anne Marie Rose1
Thurid Johnstone1,2
Sue Finch3
Cathy Beck1
1U-Vet Animal Hospital Werribee, The University of Melbourne, 2TRACTS Translational Research and Clinical Trial Study Group, The University of Melbourne, 3Statistical Consulting Centre, School of Mathematics and Statistics, The University of Melbourne, Melbourne, VIC, Australia
Abstract: Abdominal ultrasound is frequently used to assess the canine adrenal gland (AG)
and subjective and objective features of normal AGs have been described. The effect of the dogs’ recumbency position on the accuracy of AG measurement acquisition is not known. This prospective study, performed in dogs with non-adrenal illness, compared ultrasonographic AG measurements made in dogs placed in dorsal recumbency with those made in left or right lateral recumbency. AG length, height and width measurements made in the longitudinal image plane, and height and width measurements from the transverse image plane were assessed. The level and limits of agreement between the dorsal and lateral recumbency for each of the measurements were determined using the Bland–Altman analysis. The measurement with the best agreement between the dorsal and lateral recumbency was the caudal pole thickness (CPT) from the lon-gitudinal image plane. Agreement between lateral and dorsal recumbency was poorer for the measurements derived from the transverse image plane and poorest for measurements of AG length in the longitudinal plane. This study demonstrates that there is some difference in the measurements acquired in dorsal compared with lateral recumbency; however, the difference is small for the CPT from the longitudinal plane. This finding suggests that the CPT from the longitudinal image plane is the most reliable measurement in terms of agreement between dorsal and lateral recumbency in dogs with non-AG illness.
Keywords: adrenal glands, ultrasonography, normal, dog, recumbency
Introduction
Adrenal gland (AG) ultrasound is part of the assessment of dogs with potential hyperadrenocorticism (HAC), and is interpreted with history, clinical signs, physical examination, routine laboratory tests and endocrine screening tests. Once a diagnosis of HAC is established then AG ultrasound and endocrine differentiating tests assist in the differentiation between pituitary-dependent hyperadrenocorticism (PDH) and an adrenal tumor.1 Specifically in PDH, AG ultrasound determines if the AGs are normal size or if bilateral symmetrical hyperplasia exists.1,2
The ultrasound appearance of the normal canine AG was first described in 19903 with subsequent definitions of objective measurements.4–9 These objective measure-ments may be a value derived from normal dogs7–9 or a cut-off separating normal dogs from dogs with PDH.10–12 The effects of sex and age on AG size are variable4,6,7,9,10 whereas the influence of body weight leads to the current recommendation to assess AG size in relation to the dog’s weight.8,9
AG sonography is observer-dependent and acquiring measurements is challenging.2,6 The AG measurement with the least intra- and inter-observer variability is the height Correspondence: Anne Marie Rose
School of Veterinary Science, The University of Queensland, Building 8156, Gatton, QLD 4343, Australia
Tel +61 07 5460 1788 Fax +61 07 5460 1780 Email a.rose@uq.edu.au
Journal name: Veterinary Medicine: Research and Reports Article Designation: ORIGINAL RESEARCH
Year: 2017 Volume: 8
Running head verso: Rose et al
Running head recto: Effect of recumbency on ultrasound measurement of normal canine adrenal glands DOI: http://dx.doi.org/10.2147/VMRR.S148725
Veterinary Medicine: Research and Reports downloaded from https://www.dovepress.com/ by 118.70.13.36 on 27-Aug-2020
For personal use only.
This article was published in the following Dove Press journal: Veterinary Medicine: Research and Reports
8 November 2017
Dovepress Rose et al
of the caudal pole in the longitudinal image plane, acquired from dorsal recumbency.5 Furthermore, there are no intra-observer differences in the height of the caudal pole acquired from a sagittal image plane in lateral recumbency.8 The mea-surement with the greatest variability is the AG length from dorsal recumbency.5,13 Inter-observer variability is smaller if operators have >10 years of experience compared with 1–2 years,6,8 although whether this effect is clinically significant was questioned.8 In addition to observer-related variability of measurements, comparing results between studies is dif-ficult as the nomenclature used to define the direction of AG measurement in longitudinal or transverse image planes is not yet standardized.8
Ultrasound examination of AGs may be performed with the dog in dorsal, right lateral or left lateral recumbency. Any given abdominal ultrasound examination may be performed entirely in 1 recumbency or in a combination of recumben-cies depending on the sonographer’s preference, experience and the dog’s compliance. The currently accepted values for normal AG measurements, based on the thickness of the caudal pole measured from a longitudinal image plane, were determined from dogs in either dorsal, lateral or lateral oblique recumbency.9 Thus, to date, it is unknown whether ultrasonographic measurements of the AG depend on recumbency, as the measurements have not been compared between dorsal and lateral recumbency within the same dog. The objective of this study was to determine whether the dogs’ recumbency had any effect on ultrasound-derived AG measurements.
Materials and methods
Patient selection
This was a prospective study, approved by The University of Melbourne Animal Ethics Committee (Number 1413259.2). Client-owned dogs presenting to the authors’ institution for clinical evaluation and routine abdominal ultrasound between October 2014 and September 2016 were eligible for inclusion. The University of Melbourne U-Vet Animal Hospital provides best practice of veterinary care that requires informed client consent. History, physical examination find-ings and clinicopathological data at the time of the abdominal ultrasound were examined and only dogs with no evidence of AG disease were included in the study. Dogs with suspected or confirmed AG disease, or dogs that received medication that may influence AG size (corticosteroids [including topical and ocular formulations], mitotane [Apex Laboratories, Som-ersby, NSW, Australia], trilostane [Dermcare, Springwood, QLD, Australia], fludrocortisone [Aspen Pharma, St Lenards, NSW, Australia], desoxycortisone pivalate [Novartis, North
Ryde, NSW, Australia]) were excluded. The following data were collected from each dog: age, sex, breed, weight, body condition score, reason for abdominal ultrasound, recent medications and diagnosis. The data of all dogs were reviewed a minimum of 2 months after collection to ensure additional clinical and clinicopathological information did not alter the dogs’ eligibility. Data from any follow-up ultrasound examinations were not included.
Data collection
Measurements were acquired during routine abdominal ultra-sound examination. Patients were fasted, sedated and manually restrained as per protocol at the authors’ institution. The mea-surements were collected by 1 operator (AMR), an experienced sonographer,6 who was aware of the reason for the abdominal ultrasound at the time of data collection. The ultrasound exami-nations were performed on 1 of the following machines: Siemens Acuson X300 (Siemens Medical systems, Malvern, PA, USA), MyLab Twice (Esoate S.p.A, Genova, Liguria, Italy), Philips CX50 (Philips Ultrasound, Bothwell, WA, USA) and Philips Epiq 5 (Philips Ultrasound) predominantly using the manufac-turers 8-5 MHz curvilinear transducer, and occasionally a 13-5 MHz or 12-5 MHz linear transducer depending on the size of the dog. Each ultrasound machine had axial and lateral resolution calibrations assessed for measurement accuracy using a phantom (Multipurpose Phantom 539; ATS Laboratories Inc, Bridgeport, CT, USA). The fur of all dogs was clipped6 and acoustic coupling gel was applied. Previously published anatomical landmarks were used to localize the AGs.14
AG measurements
The left and right AG of each dog were examined in dorsal and right or left lateral recumbency, with measurements acquired from the longitudinal and transverse image planes. Specifically, the left AG was examined in dorsal and right lateral recumbency and the right AG examined in dorsal and left lateral recumbency. The following terminology was defined to maintain consistency when describing the AG measurements. The caudal pole thickness (CPT) is the short axis measurement acquired from a longitudinal image plane and is the AG height in dorsal recumbency and the AG width in lateral recumbency. The short axis measurements, width and height, were acquired from the transverse image plane of the caudal pole. The width is the maximum measurement in mediolateral direction and the height is the maximum measurement in a dorsoventral direction. The length is the maximum measurement from the longitudinal image plane in a craniocaudal direction. Therefore, in dorsal recumbency, the length and the CPT were acquired from the longitudinal
Veterinary Medicine: Research and Reports downloaded from https://www.dovepress.com/ by 118.70.13.36 on 27-Aug-2020
Dovepress Effect of recumbency on ultrasound measurement of normal canine adrenal glands
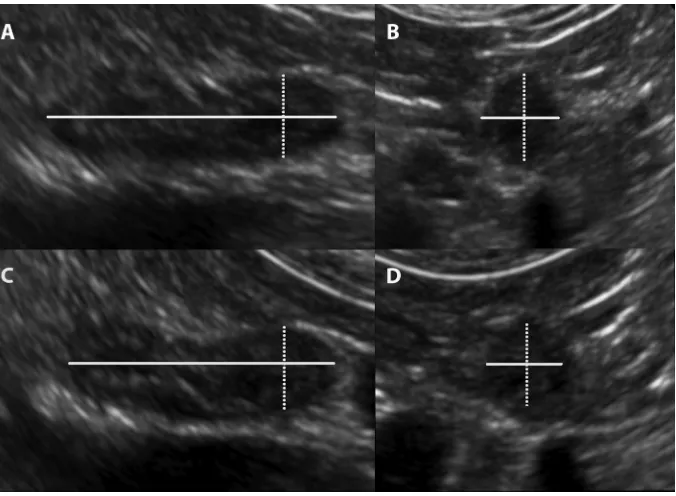
image plane (Figure 1A). The transducer was then rotated 90 degrees on the caudal pole from the longitudinal image plane to the transverse image plane and the height and width of the caudal pole measurements were acquired (Figure 1B). In lateral recumbency the length and the CPT were acquired from the longitudinal image plane (Figure 1C). The trans-ducer was then rotated to the transverse image plane and the caudal pole height and width were acquired (Figure 1D). The image of the AG was frozen and the measurements made with the electronic calipers directly on the image, and stored in the picture archiving and communications system (Synapse Fuji Medical Systems Inc, Stamford, CT, USA) and data transferred later. Table 1 lists the measurement, image plane of the AG and the direction of each measurement relative to the patient’s recumbency at the time of acquisition. The series of measurements was the same for the left and right AG.
Statistical analysis
The power calculations were based on the principle of proving bioequivalence meaning that the measurements are the same. Thus, paired equivalence trail sampling size calculations, with the mean and SDs of the measurements of the left AG CPT and accepting a limit of error of 0.65 mm were per-formed. The power calculations indicated with 80% certainty with a significance of p<0.05 that the measurement between
the AG in dorsal or right lateral recumbency are equivalent determined a sample size of 86. As the measurements were acquired from the same individual then an additional 10% is required therefore the sample size is 95 dogs.
The statistical analyses were performed using a statisti-cal software program (Minitab 17, State College, PA, USA). The level of agreement between measurements in dorsal and lateral recumbency was determined using the Bland and Alt-man method15 and CIs calculated for the mean difference, upper and lower limits of agreement.
Results
Patient data
A total of 100 dogs met the selection criteria, representing 37 breeds and 15 different crossbreeds. Breeds which were rep-resented by greater than one dog included Labrador retrievers (n=10), golden retrievers (n=7), Cavalier King Charles spaniel and German shepherd dogs (n=4), Chihuahua, Jack Russell terrier and Staffordshire bull terrier (n=3) and beagle, boxer, Cairn terrier, cocker spaniel, German shorthaired pointer, stan-dard poodle (n=2). The crossbreeds which were represented by greater than one dog included Maltese terrier crossbreed and Shih Tzu crossbreed (n=3), and two for each of the following crossbreeds Jack Russell terrier, kelpie, Labrador retriever and spoodle. There were 45 neutered females (45%), 4 entire Figure 1 Ultrasound images demonstrating the image plane and location of adrenal gland measurements.
Notes: (A) Dorsal recumbency longitudinal image plane: ultrasound image demonstrating the locations of the length (solid line) and CPT or height (dotted line) measurements. (B) Dorsal recumbency transverse image plane of the caudal pole: ultrasound image demonstrating the locations of the height (dotted line) and width (solid line) measurements. (C) Lateral recumbency longitudinal image plane: ultrasound image demonstrating the location of the length (solid line) and the CPT or width (dotted line) measurements. (D) Lateral recumbency transverse image plane of the caudal pole: ultrasound image demonstrating the location of the width (dotted line) and height (solid line) measurements.
Abbreviation: CPT, caudal pole thickness.
Veterinary Medicine: Research and Reports downloaded from https://www.dovepress.com/ by 118.70.13.36 on 27-Aug-2020
Dovepress Rose et al
females (4%), 43 neutered males (43%), 8 entire males (8%). The median age was 7 years (range 3 months–16 years) and the median weight 17.95 kg (range 2.1–47.9 kg). The median body condition score was 6 (range 1–8) based on 98 dogs in which body condition score was recorded.
CPT measurement
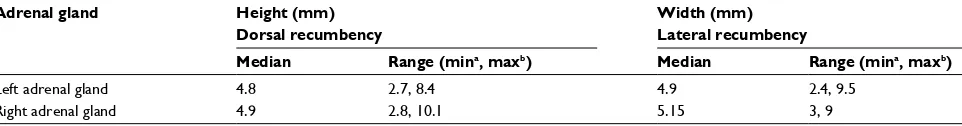
The CPT is the short axis measurement acquired from a lon-gitudinal image plane and compares the AG height in dorsal recumbency with the AG width in lateral recumbency. Table 2 shows the median and range of the CPT measurements for the left and right AGs. The median CPT are within reference values.9 The Bland–Altman plots for the left and right AGs are in Figure 2. The Bland–Altman analysis for the left AG shows that the width measurement in right lateral recum-bency is, on average, 0.10 mm greater than the height in the dorsal recumbency. Similarly, the Bland–Altman analysis for the right AG shows that the width measurement in left lateral recumbency is, on average, 0.16 mm greater than the height in the dorsal recumbency. Thus, the mean difference is toward the respective lateral recumbency for both AGs. The absolute values of the upper and lower limits of agreement range between 1.48 and 1.95 mm for both AGs.
Short axis measurements of the caudal
pole from the transverse image plane
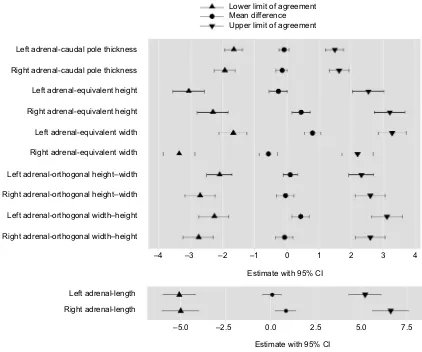
There are 4 combinations of caudal pole short axis measure-ments that have the dorsal recumbency compared with the lateral recumbency for each AG: equivalent height, equivalentwidth, orthogonal height–width and orthogonal width–height (Table 1). The equivalent height measurement compares the change in recumbency; the direction of measurement is unchanged. Similarly, the equivalent width measure-ment compares the change in recumbency: the direction of measurement is unchanged. The orthogonal measurements compare both the change in recumbency and the direction of measurement. The orthogonal height–width compares the height in dorsal recumbency against the width in lateral recumbency. The orthogonal width–height compares the width in dorsal recumbency against the height in lateral recumbency. Figure 3 lists the mean difference, lower and upper limits of agreement with 95% CIs for each of these caudal pole short axis measurements. The Bland-Altman plots for the short axis equivalent measurements (Figure S1) and short axis orthogonal measurements (Figure S2) are provided in the Supplementary materials.
Comparison of the CPT measurements
with the short axis measurements of the
caudal pole from the transverse image
plane
Figure 3 allows comparison of the mean difference, lower and upper limits of agreement with 95% CIs for the CPT and the caudal pole short axis measurements. The measurement with the lowest limit of agreement is the CPT acquired from the longitudinal axis whereas all the caudal pole short axis mea-surements derived from the transverse image plane have higher limits of agreement (Figure 3). Estimates of the mean difference
Table 1 Image plane and direction of adrenal gland measurement relative to the dogs recumbency position for the adrenal gland measurements
Measurement Image plane Dorsal recumbency Lateral recumbencya
Caudal pole thickness Longitudinal Height Width
Equivalent height measurementb Transverse Height Height
Equivalent width measurementb Transverse Width Width
Orthogonal height–width measurementc Transverse Height Width
Orthogonal width–height measurementc Transverse Width Height
Length Longitudinal Length Length
Notes:aRight lateral recumbency for the left adrenal gland and left lateral recumbency for the right adrenal gland. bEquivalent measurement is defined as no change in the
direction of the measurement with change in patient recumbency. cOrthogonal measurement is defined as a change in the direction of the measurement with change in
patient recumbency.
Table 2 Median and range of the caudal pole thickness from the longitudinal image plane
Adrenal gland Height (mm)
Dorsal recumbency
Width (mm) Lateral recumbency
Median Range (mina, maxb) Median Range (mina, maxb)
Left adrenal gland 4.8 2.7, 8.4 4.9 2.4, 9.5
Right adrenal gland 4.9 2.8, 10.1 5.15 3, 9
Note:aMinimum. bMaximum.
Veterinary Medicine: Research and Reports downloaded from https://www.dovepress.com/ by 118.70.13.36 on 27-Aug-2020
Dovepress Effect of recumbency on ultrasound measurement of normal canine adrenal glands
and the limits of agreement for the CPT are all within 2 mm (Figure 3). The CIs for the estimates for the CPT are relatively narrow; this indicates that the precision of the CPT estimates is relatively good. In fact, for the CPT, the bounds of the CIs for the limits of agreement are within 2 mm, except for the lower bound of right AG dorsal recumbency height compared with left lateral recumbency width, which is −2.3 mm.
Length of the AG
AG length can only be acquired from the longitudinal image plane and therefore the only variant is the comparison between dorsal and lateral recumbency (Table 1). The results of the Bland–Altman analysis comparing the dorsal against the lateral recumbency, including the mean difference and lower and upper limits of agreement with 95% CIs are shown Figure 2 Graphical display of the Bland–Altman analysis of the caudal pole thickness measurement acquired from the longitudinal image plane of the left and right adrenal gland.
Notes: The mean difference or the bias is the central solid black line. The 95% upper and lower limits of agreement are represented by the dotted black lines.
Abbreviations: ULA, upper limit of agreement; LLA, lower limit of agreement.
2 –5.0 –2.5
Dorsal-right lateral (mm)
0.0 2.5 5.0
–5.0 –2.5
Dorsal-left lateral (mm)
0.0 2.5 5.0
3 4
Mean (mm) of dorsal and right lateral
Mean (mm) of dorsal and left lateral Left adrenal gland
Right adrenal gland
5 6 7 8 9
2 3 4 5 6 7 8 9
ULA = 1.62
Mean = –0.16
LLA = –1.95 ULA = 1.48
LLA = –1.68 Mean = –0.10
Veterinary Medicine: Research and Reports downloaded from https://www.dovepress.com/ by 118.70.13.36 on 27-Aug-2020
Dovepress Rose et al
in Figure 3. The Bland–Altman plots for the length of the AG (Table S3) are provided in the Supplementary materials.
Discussion
The purpose of the study was to assess whether recum-bency position influences measurement of AGs in dogs. The expectation was that recumbency would not influence measurements. The results show that there is some difference between the measurements in dorsal and lateral recumbency. The measurement with the least variation is the CPT acquired from the longitudinal image plane.
The results support the current descriptions of ultrasound measurements based on CPT from the longitudinal image plane.7,8,11 The recent reference values of the upper limits of normal AG measurements in dogs with non-AG illness were derived from dogs in dorsal, lateral and lateral oblique recum-bency.9 The current study confirms that these previously established reference values remain valid, even though the recumbency positions from which they were derived varied
between dogs. However, taking the CI bounds of the limits of agreement into consideration, the CPT may have up to 1.96 and 2.27 mm difference between recumbencies for the left and right AG, respectively. While the median result for the CPT (Table 2) was within the reference values,9 the range of measurements in this study did identify outliers, which need to be considered along with other clinical findings and endocrine testing, as a few dogs with non-adrenal illness have measurements suggestive of HAC if assessed in 1 recum-bency. If the suspicion of HAC remains high in these cases, it may be of value to confirm the CPT measurement in both recumbencies. This is particularly important as endocrine testing is associated with a higher risk of false positive test results if the dog suffers from non-adrenal illness.1
The Bland–Altman analysis only determines the levels of agreement between the 2 recumbencies, it does not state that the given limits are acceptable for a clinical situation. There is some evidence to suggest that the findings of the current study for the CPT may be clinically acceptable, Figure 3 Adrenal gland measurements.
Note: Collation of the Bland–Altman analyses comparing the dorsal recumbency against the relevant lateral recumbency demonstrating the mean differences, upper and lower limits of agreement (all in mm) with 95% CIs.
Right adrenal-orthogonal width–height
Left adrenal-length Right adrenal-length
–4 –3 –2 –1 0 1 2 3 4
–5.0 –2.5 0.0 2.5 5.0 7.5
Estimate with 95% CI Estimate with 95% CI Left adrenal-orthogonal width–height
Left adrenal-orthogonal height–width Left adrenal-equivalent width Left adrenal-equivalent height
Right adrenal-equivalent height Right adrenal-caudal pole thickness Left adrenal-caudal pole thickness
Lower limit of agreement Mean difference Upper limit of agreement
Right adrenal-equivalent width
Right adrenal-orthogonal height–width
Veterinary Medicine: Research and Reports downloaded from https://www.dovepress.com/ by 118.70.13.36 on 27-Aug-2020
Dovepress Effect of recumbency on ultrasound measurement of normal canine adrenal glands
as a mean difference of 0.4–0.7 mm between observers measuring the caudal pole height from the sagittal image plane in lateral recumbency was considered to be clinically insignificant.8 In the current study the mean difference between dorsal and lateral recumbency for the CPT was less than these dimensions at 0.1 and 0.16 mm for the left and right AG, respectively.
The Bland–Altman analysis also determines the mean difference between the 2 recumbencies. If the mean differ-ence between the dorsal and lateral recumbency is zero then the average measurement is the same irrespective of the patient’s recumbency. However, each of the measurements in the study had some variation in the mean differences. The average CPT measurement was slightly greater in the lateral than in the dorsal recumbency and this effect was slightly greater for the right AG. The challenge for acquiring the longitudinal image plane is to include the entire length of the AG in the image5 that, in turn, may influence the consistency of CPT measurement, taken perpendicular to the length. The greater mean difference for the right AG is consistent with the difficulty in assessing the right AG compared with the left, due to the location and shape.4,7 The mean differences in the longitudinal plane were, however, estimated to be small. There was variation in the mean difference for each of the transverse plane measurements, which was inconsistently toward either the dorsal or lateral recumbency. Transverse image plane measurements are susceptible to overestimation due to the effect of obliquity when rotating the transducer from longitudinal to the transverse image plane.5 There was also variation in the mean difference for the AG length, which was marginally greater on lateral recumbency, with greater variation for the right AG. The length of the AG is known to have the greatest variability5 and this study shows that the variability also occurs with changing patient recumbency.
There are challenges associated with acquiring repeat-able and valid ultrasound-derived AG measurements. The study design negated inter-observer variability by having 1 observer collect all the data. In addition, intra-observer variability was reduced as the observer is defined as being experienced with 15 years of experience prior to the begin-ning data collection, which reduces intra-observer variabil-ity.14 The results of the study identified the CPT as having the least variation between recumbencies. This is the same direction of measurement identified in separate studies5,8 as having the least intra-observer variability when measuring the AG in normal dogs. The relatively narrow CIs for the CPT measurements determined in this study also validate the measurements.
There are study limitations. The clinical setting provided dogs with non-AG illness and thus the operator was not blinded to the reason for the ultrasound examination. While this study was not performed in a controlled environment with normal dogs, the setting was realistic and replicates the range of patients encountered in routine clinical practice. The study may not represent the range of dog breeds or account for confounding factors such as breed, age, sex or weight. However, the Bland–Altman analysis compared pairs of mea-surements from the same individual, thus each dog acted as its own control. There are 2 dog breeds, the Yorkshire terrier and Labrador retriever that have breed-specific measurements determined for the CPT in dorsal recumbency.7 The current study did include Labrador retrievers, which has a larger AG measurement compared with the accepted value;9 however, this effect is negated as each dog is its own control in the Bland–Altman analysis. There were 4 ultrasound machines used during the data collection, which may have resulted in variability of the measurements acquired; however, the Bland–Altman analysis compared pairs of measurements taken from the same dog using the same ultrasound machine. Future work would include determining the levels of agree-ment between dorsal and lateral recumbency of the CPT on the longitudinal image plane in dogs with PDH.
Conclusion
This study is the first to assess a range of AG measure-ments within the same dog comparing dorsal and lateral recumbency. Of all measurements examined, CPT in the lon-gitudinal image plane varied least, suggesting that this mea-surement should always be included when reference values of AG measurements are determined. Also, when using CPT, there is a greater degree of flexibility with regard to patient positioning, without foregoing accuracy of measurements. Results of this study support the applicability of the currently recommended values for the size of AGs in dogs with non-AG illness,9 whether these values were derived with patients in either dorsal, lateral or lateral oblique recumbencies.
Acknowledgments
The authors would like to thank Julie Egan for writing and editorial assistance. This work received financial support from The University of Melbourne Veterinary Hospital Resi-dent Research Grant Program. Anne Marie Rose’s current address is School of Veterinary Science, The University of Queensland, Gatton, QLD, Australia.
Disclosure
The authors report no conflicts of interest in this work.
Veterinary Medicine: Research and Reports downloaded from https://www.dovepress.com/ by 118.70.13.36 on 27-Aug-2020
Dovepress Rose et al
References
1. Behrend EN, Kooistra HS, Nelson R, Reusch CE, Scott-Moncrieff JC. Diagnosis of spontaneous canine hyperadrenocorticism: 2012 ACVIM consensus statement (small animal). J Vet Intern Med. 2013;27(6): 1292–1304.
2. Pey P, Saunders J. New concepts in imaging the canine adrenal glands.
EAVDI Yearbook 2013 Rev Vet Diagnostic Imaging. 2013:59–93. 3. Voorhout G. X-ray-computed tomography, nephrotomography, and
ultrasonography of the adrenal glands of healthy dogs. Am J Vet Res.
1990;51(4):625–631.
4. Douglass JP, Berry CR, James S. Ultrasonographic adrenal gland measurements in dogs without evidence of adrenal disease. Vet Radiol Ultrasound. 1997;38(2):124–130.
5. Barberet V, Pey P, Duchateau L, Combes A, Daminet S, Saunders JH. Intra- and interobserver variability of ultrasonographic measure-ments of the adrenal glands in healthy beagles. Vet Radiol Ultrasound.
2010;51(6):656–660.
6. Mogicato G, Layssol-Lamour C, Conchou F, et al. Ultrasonographic evaluation of the adrenal glands in healthy dogs: repeatability, reproduc-ibility, observer-dependent variability, and the effect of bodyweight, age and sex. Vet Rec. 2011;168(5):130.
7. de Chalus T, Combes A, Bedu AS, et al. Ultrasonographic adrenal gland measurements in healthy Yorkshire Terriers and Labrador Retrievers.
Anat Histol Embryol. 2013;42(1):57–64.
8. Soulsby SN, Holland M, Hudson JA, Behrend EN. Ultrasonographic evaluation of adrenal gland size compared to body weight in normal dogs. Vet Radiol Ultrasound. 2015;56(3):317–326.
9. Bento PL, Center SA, Randolph JF, Yeager AE, Bicalho RC. Associa-tions between sex, body weight, age, and ultrasonographically deter-mined adrenal gland thickness in dogs with non-adrenal gland illness.
J Am Vet Med Assoc. 2016;248(6):652–660.
10. Barthez PY, Nyland TG, Feldman EC. Ultrasonographic evaluation of the Adrenal Glands in normal dogs and in dogs with pituitary-dependent hyperadrenocortisolism (PDH). In: Proceedings from 12th Annual ACVIM Forum; 2 June, 1994; San Francisco,CA. Abstract 70. 11. Choi J, Kim H, Yoon J. Ultrasonographic adrenal gland measurements
in clinically normal small breed dogs and comparison with pituitary-dependent hyperadrenocorticism. J Vet Med Sci. 2011;73(8):985–989. 12. Barthez PY, Nyland TG, Feldman EC. Ultrasonographic evaluation of
the adrenal glands in dogs. J Am Vet Med Assoc. 1995;207(9):1180–1183. 13. Grooters AM, Biller DS, Merryman J. Ultrasonographic parameters
of normal canine adrenal glands: comparison to necropsy findings. Vet Radiol Ultrasound. 1995;36(2):126–130.
14. d’Anjou MA, Penninck DG. Adrenal Glands. In: Penninck DG, d’Anjou M-A, editors. Atlas of Small Animal Ultrasonography. 2nd ed. Ames, Iowa, USA: John Wiley and Sons Inc; 2015:7–402.
15. Altman DG, Bland JM. Measurement in Medicine: The Analysis of Method Comparison Studies. Statistician. 1983;32(3):307–317.
Veterinary Medicine: Research and Reports downloaded from https://www.dovepress.com/ by 118.70.13.36 on 27-Aug-2020
Dovepress Effect of recumbency on ultrasound measurement of normal canine adrenal glands
Supplementary materials
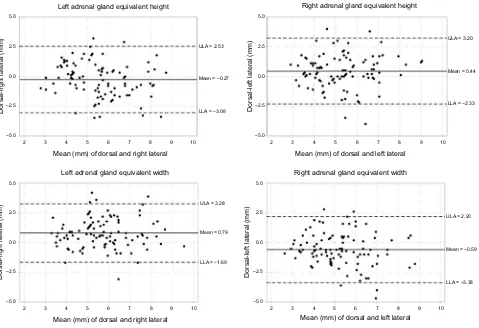
Figure S1 Bland–Altman Plots for short axis measurements of the caudal pole from the transverse image plane: equivalent measurements.
Notes: Graphical display of the Bland–Altman analysis of the short axis equivalent measurements of the caudal pole acquired from the transverse image plane for the left and right adrenal glands. The mean difference or the bias is the central solid black line. The 95% upper and lower limits of agreement are represented by the dotted black lines.
Abbreviations: ULA, upper limit of agreement; LLA, lower limit of agreement. –5.0
2 3 4 5
Mean (mm) of dorsal and right lateral
Left adrenal gland equivalent height Right adrenal gland equivalent height
Dorsal-right lateral (mm) Dorsal-left lateral (mm)
Left adrenal gland equivalent width
6 7 8 9 10
2 3 4 5
Mean (mm) of dorsal and right lateral
6 7 8 9 10 2 3 4 5
Mean (mm) of dorsal and left lateral
6 7 8 9 10
2 3 4 5
Mean (mm) of dorsal and left lateral
Right adrenal gland equivalent width
6 7 8 9 10
–2.5 0.0 2.5 5.0
–5.0 Dorsal-right lateral (mm) –2.5 0.0 2.5 5.0
–5.0 Dorsal-left lateral (mm) –2.5 0.0 2.5 5.0 –5.0 –2.5 0.0 2.5 ULA = 2.53
Mean = –0.27
LLA = –3.08
ULA = 3.28
Mean = 0.79
LLA = –1.69
ULA = 2.20
Mean = –0.59
LLA = –3.38 ULA = 3.20
Mean = 0.44
LLA = –2.33 5.0
Veterinary Medicine: Research and Reports downloaded from https://www.dovepress.com/ by 118.70.13.36 on 27-Aug-2020
Dovepress
Veterinary Medicine: Research and Reports
Publish your work in this journal
Submit your manuscript here: http://www.dovepress.com/veterinary-medicine-research-and-reports-journal
Veterinary Medicine: Research and Reports is an international, peer-reviewed, open access journal publishing original research, case reports, editorials, reviews and commentaries on all areas of veterinary medicine. The manuscript management system is com-pletely online and includes a very quick and fair peer-review system.
Visit http://www.dovepress.com/testimonials.php to read real quotes from published authors.
Dovepress
Rose et alFigure S2 Bland–Altman Plots for short axis measurements of the caudal pole from the transverse image plane: orthogonal measurements.
Notes: Graphical display of the Bland–Altman analysis of the short axis orthogonal measurements of the caudal pole acquired from the transverse image plane for the left and right adrenal glands. The mean difference or the bias is the central solid black line. The 95% upper and lower limits of agreement are represented by the dotted black lines.
Abbreviations: ULA, upper limit of agreement; LLA, lower limit of agreement. –5.0
Dorsal-right lateral (mm)–2.5 0.0 2.5 5.0
–5.0 Dorsal-left lateral (mm) –2.5 0.0 2.5 5.0
2 3 4 5
Mean (mm) of dorsal and right lateral
Left adrenal gland orthogonal width–height
6 7 8 9 10 2 3 4 5
Mean (mm) of dorsal and left lateral
Right adrenal gland orthogonal width–height
6 7 8 9 10
Left adrenal gland orthogonal height–width Right adrenal gland orthogonal height–width
ULA = 2.32
Mean = 0.10
LLA = –2.12
ULA = 3.12
Mean = 0.42
LLA = –2.28
ULA = 2.60
Mean = –0.09
LLA = –2.77 ULA = 2.60
Mean = –0.06
LLA = –2.72
–5.0 Dorsal-right lateral (mm)–2.5 0.0 2.5 5.0
–5.0 Dorsal-left lateral–2.5 0.0 2.5 5.0
2 3 4 5
Mean (mm) of dorsal and right lateral
6 7 8 9 10 2 3 4 5
Mean (mm) of dorsal and left lateral6 7 8 9 10
Figure S3 Bland–Altman Plot for the length of the adrenal gland.
Notes: Graphical display of the Bland–Altman analysis of the length of the adrenal gland, acquired from the longitudinal image plane of the left and right adrenal gland. The mean difference or the bias is the central solid black line. The 95% upper and lower limits of agreement are represented by the dotted black lines.
Abbreviations: ULA, upper limit of agreement; LLA, lower limit of agreement.
–10
10 15 20 25 30 35 40
–5 0 5 10
–10 –5 0 5 10
Mean (mm) of dorsal and right lateral
Left adrenal gland Right adrenal gland
Dorsal-right lateral (mm) Dorsal-left lateral (mm)
10 15 20 25 30 35 40
Mean (mm) of dorsal and left lateral
ULA = 5.17
Mean = 0.05
LLA = –5.08
ULA = 6.59
Mean = 0.80
LLA = –5.00
Veterinary Medicine: Research and Reports downloaded from https://www.dovepress.com/ by 118.70.13.36 on 27-Aug-2020