Licensed under Creative Common Page 1
http://ijecm.co.uk/
ISSN 2348 0386
IMPACT OF COMPETITIVE STRATEGIES AND SUPPLY
CHAIN STRATEGIES ON THE FIRM PERFORMANCE
UNDER ENVIRONMENTAL UNCERTAINTIES
BORSA ISTANBUL CASE IN THE MANUFACTURING SECTOR
Cengiz DURAN
Dumlupınar University, Faculty of Economics and Administrative Sciences Department of Business Administration, Turkey
cduran35@gmail.com
Yavuz AKÇİ
Dumlupınar University, Faculty of Economics and Administrative Sciences Department of Business Administration, Turkey
yavuzakci@gmail.com
Abstract
This paper attempts to determine the impact of the supply chain strategies and the competitive
strategies on the firm performance and if this changes according to the conditions of
uncertainty. The scale that was developed to collect data from the manufacturing companies
listed in Borsa Istanbul in Turkey was utilized. After the pilot test, questionnaires were applied to
174 companies listed in Borsa Istanbul via e-mail and telephone, whereas 90 companies
responded. Factor analysis and reliability analyses were used for data analysis and the
problematic questions were excluded from the scale. The accuracy of the model was tested by
the structural equation model in AMOS 20.0 software that was developed for the analysis of the
main hypothesis. It was found that the competitive strategies influenced the supply chain
strategies positively and significantly; cost leadership strategy and lean supply chain strategy
had a significant impact on the firm performance under the conditions of high uncertainty;
whereas, differentiation strategy and agile supply chain strategy had a significant impact on the
firm performance under the low uncertainty. In conclusion, the companies are supposed to use
environmental uncertainty as a determinant of the perceptions in setting their strategies.
Licensed under Creative Common Page 2
INTRODUCTION
Today (in 2000s), changing customer expectations and increased knowledge level; customer-oriented approach of the companies (Kotler, 2000); changing customer expectations from the products (Ross, 2000); development of new management models (Chandra and Kumar, 2000: 6); advances in information and communication technologies (Gunesekaran and Ngai, 2004: 272; Kouvelis and Su, 2007: 5); changing structures and functions of companies due to globalization (Thoumrungroje, 2004: 4; Cook, 2011: 1-2); tendency of local companies towards standardization (Levitt, 1983: 93); global production, increased stocks and resource utilization (Rushton et al., 2010: 23) and thus more competitive positions of companies (Bovet and Sheffi, 1998: 17) have led them to use new management philosophies. Furthermore, those companies that are not well prepared for global competition are stumped (Spulber, 2007: 2). As main goals of companies are to adapt to the changing and developing environmental conditions and to be competitive, a lot of management and production philosophies have been developed. One of these philosophies is supply chain management (Shavazi et al. 2009: 93).
Comprised of a set of activities starting from the supply of raw materials, production, assembly, storage, order management and distribution to the delivery of products to the customer as well as the information systems that are required to follow-up these activities (Lummus and Vokurka, 1999: 11), supply chain was defined as the management of the process spanning from “the supplier‟s supplier to the customer‟s customer” (SCM council) and also the flow of funds and information (Metz, 1998). Tan et al. (1998) proposed one of the broadest definitions by also adding other aspects such as competitiveness and technology.
Seven important activities are recommended for a successful supply chain management: Integrated behavior, mutually sharing information, mutually sharing channel risks and rewards, cooperation, the same goal and the same focus of serving customer services, integration of processes and partners to build & maintain long-term relationships (Mentzer, 2001). The supply chain studies focused on strategic management, relationships-stakeholders, logistics, best practices, Marketing and organizational behaviors (Croom, Romano, and Giannakis, 2000).
Supply chain management was used to define storage and transportation by 1960s (Bowersox, 1969: 72), total cost management by 1980s, integrated logistic management by 1990s, supply chain management by 2000s and e-supply chain management practices after 2000s (Ross, 2011).
Supply Chain Strategies
Licensed under Creative Common Page 3 in total when Reverse Supply Chain (RSC), Green Supply Chain (GSC) and Global Supply Chain (GSC) are also classified in addition to the abovementioned groups although they are not used as a strategy alone. Only two of these classifications that are Lean supply chain and Agile supply chain can be considered as supply chain strategies. The others can be regarded as policies that can be used in addition to these two strategies rather than a supply chain strategy alone.
Ross claimed that the strategies of supply chain management were based on three different approaches. The first approach is cost leadership. This approach covers principles and rules to increase the productivity of the chain and profitability by reducing the wastes in the chain. This is also known as lean supply chain strategy. The second approach is the operational performance. This approach is centered around the agility of the supply chain executive function against the variability of demands as much as possible. This method is also known as supply elasticity, adaptive supply chain management, delivery elasticity, demand-oriented supply network management or agile supply chain management. The last approach is the customer-centered approach. This approach aims to improve the supply chain capacity and resources on a continuous basis and increase the total value provided to the customers. This method is also known as close/relational supply chain management (Ross, 2008:112).
Lean production techniques also underlie the lean supply chain (Hanna and Newman, 2007: 632). Carrol claimed that lean production was based on the production techniques introduced by Henry Ford in 1913 (2002:6; 2008:11). Lean supply chain is broader than just-in-time production (JIT) or than what is already performed (Mentzer et al., 2006: 10). As lean supply is a suitable method for lean production and aims at eliminating manufacturing wastes, it is becoming more and more popular (Kimball, 2005: 1).
Licensed under Creative Common Page 4 On the other hand, Christopher (2000) described agile supply chain as a network of virtuality, market sensitivity, process integration and communication.
As supply performance directly influences both financial and operational process of businesses, selection of the suppliers of specific products and services is critical (Chen and Paulraj, 2004: 139, Kim, 2006: 59). Firm performance can be measured as financial and operational performance (Prahinski and Benton, 2004: 42-43). On the other hand, supplier performance can be measured by some variables such as Price, Quality, Delivery, Customer Satisfaction, Elasticity, After-Sales Services, Product Range, Product Support, Product Quality, Customer Service Efficiency, Pricing, Delivery Performance, Technical Competence, Service and Innovation (Wagner and Krause, 2007: 3162; Smith, 2008: 56; Güneri and Kuzu, 2009: 776-777; Jain et al, 2009: 3022; Akman and Alkan: 2006: 26). Harmony of the attitudes and perceptions between companies and suppliers also affect the supplier performance (Thakkar, Kanda and Deshmukh, 2008: 94). The most common selection and performance variables are Cost, Quality, Delivery, Time/speed, Elasticity and Delivery reliability.
Competitive Strategies
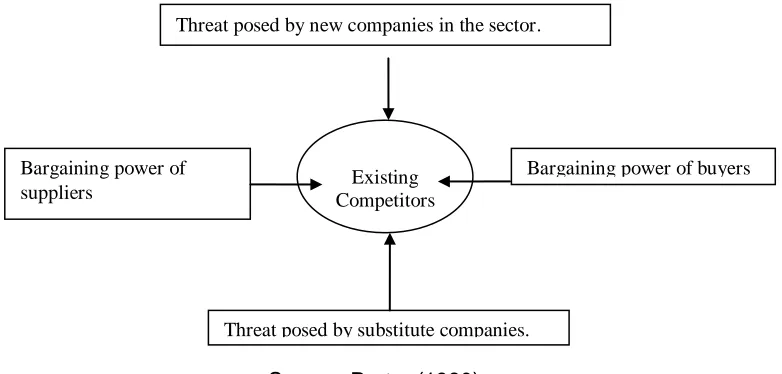
Competition between companies has increased due to the increased supply as a response to the increased demand all around the world and also because the increase in supply is greater than the increase in demand in certain sectors. Competition conditions have put a pressure on the companies as global companies are also involved in the competition. Competition can be defined as the efforts of multiple participants in similar positions to gain a scarce material or a desired position at the same time in a relatively fair environment by complying with the competition rules (Türkkan, 2001: 69). On the other hand, it can also be defined as “a struggle to survive” (Thatte, 2007: 42). Presence of associations, coalitions and agreements between the companies in a sector decreases competition further. However, competition will exist naturally and maybe increase further in the absence of abovementioned structures. There are certain pressure factors that force the companies. The model developed by Porter include five different factors of pressure (Porter, 2000: 5), which are presented as fallows figure 1.
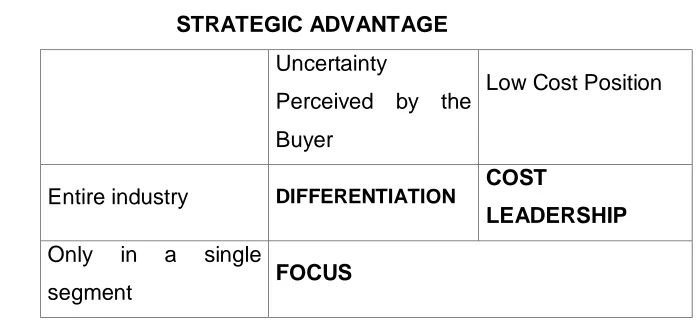
Licensed under Creative Common Page 5 The second overall strategy aims at making a unique difference in the product and service offered in the industry that can be perceived by all companies. Differentiation approach has many different forms. Worldwide companies can become superior to the average competitors by differentiating technology, innovation and distribution (Singer et al., 2007: 29). Differentiation may make it difficult for the companies to reach a high market share. Therefore, the high market share objective can be compromised in the application of this strategy (Porter, 1980: 37-38). Hooley et al. identified five strategies including product differentiation, price differentiation, distribution differentiation, promotion differentiation and brand differentiation (Hooley et al., 2008: 308). Panayides claimed that small companies could be more successful in implementing the differentiation strategy compared to the large companies (Porter, 2000 p.5.)
Figure 1: Five Factors Influencing Competition in a Sector (Power-Pressure Factors)
Source: Porter (1980)
The last strategy proposed by Porter is the focus strategy. This strategy aims at providing the products and services to a small segment of a market rather than the entire market. To this end, companies try to create a competitive advantage by implementing the cost leadership or differentiation strategy in a certain group of buyers, a product line segment or a certain geographical market. Cost leadership and differentiation strategies focus on the entire industry, while the focus strategy structures all activities and policies for a single target and efforts are put to achieve that target. Focus strategy can enable companies to generate revenue above the average (Porter, 1980: 38 and Singer et al., 2007: 29).
Existing Competitors
Threat posed by new companies in the sector.
Bargaining power of buyers Bargaining power of
suppliers
Licensed under Creative Common Page 6 Figure 2: Competitive strategies Matrix
S
TR
A
TE
G
IC
O
B
J
E
C
TIV
E
STRATEGIC ADVANTAGE
Uncertainty
Perceived by the Buyer
Low Cost Position
Entire industry DIFFERENTIATION COST
LEADERSHIP
Only in a single
segment FOCUS
Adapted from Porter, 1980: 39 and Singer et al, 2007: 29
Uncertainty
Uncertainty is an important phenomena in some fields such as organizational theory, marketing and strategic management. An overwhelming majority of the researchers studying organizations acknowledge the importance of uncertainty (Vechiato, 2012: 436; Lin, 2006: 439; Lee et al., 2009: 192; Chen and Paulraj, 2004: 122; Kocabaşoğlu et al., 2007: 1143; Pagel and Krause, 1999: 308; Habib et al., 2011: 256, Yoe, 2012: Hill, 2008, Rodrigues et al, 2008: Griffiths and Wall, 2008).
Although uncertainty and risk are usually considered to be similar, these concepts are different (Rodrigues et al., 2008: 390). Uncertainty refers to the fact that there might be many consequences of a certain choice and the likelihood of these consequences to occur is not known (Gamero et al, 2011: 428, Ariöz, 2012: 5). However, risk is the probability that an event will occur and the impact of that event. Risk can be predicted based on past experiences, whereas it is difficult to estimate uncertainties (Jones, 2004: 46). Risk has two forms as the combination of overall hazard and security (Darbra et al., 2008: 378). Risk is usually a concept used to describe negative conditions. Measures can be taken against risks. Negative impacts of a risk can be minimized by issuing an insurance or implementing risk management techniques.
Licensed under Creative Common Page 7 Uncertainty may not always lead to negative consequences but also may enable positive results. There is a surprise in an uncertainty. In other words, it contains an unexpected, unpredicted or unanticipated aspect. For example, excessive decrease in the demand for a product of a company is negative, while an increase in the demand is positive. Both cases are uncertain, there isn‟t any clue to anticipate such uncertainty; therefore, companies may be unprepared. This highlights the importance of uncertainty (Reuben and Driebe, 2005: 7; Garratt, 2007: 12).
The social complexities and changes that are growing in the modern world also cause the uncertainty to grow and become steady. As the world is getting complicated, the roles and personalities of people in societies are also diversified and getting complicated. Although human beings survived with simple and uncomplicated personalities and roles such as hunting and gathering in 99% of human history, there are a lot of roles and personalities in today‟s societies. This increased especially the social complexity and thus uncertainty. Combined with complexity, risk and uncertainty become harder. For example, the complexity caused by the earthquake and tsunami that occurred in 2011 in Japan, which is one of the most ambitious countries in the world in coping with earthquakes, challenged the risk and uncertainty estimation and uncertainty analysis (Yoe, 2012: 30).
Organizations have to adapt to their external environments to survive as a requirement of the open system. A wrong decision that a company may take concerning the external environment may cost a lot. One of the most important factors that affect the decisions is the degree of uncertainty. The change ratio in the customers, government, employee unions and competitors that are outside the organization can be defined as environmental uncertainty (Habib et al., 2011: 258). If the degree of uncertainty; the pressure between the competitors decreases, variable customer demands decrease and radical technological changes occur less. On the other hand, if the degree of uncertainty is high; variable customer demands, radical technological changes, heavy competition conditions will occur, which will lead to low stability. As these changes cannot be predicted beforehand, they create a pressure on the organizations (Lin, 2005: 439).
Licensed under Creative Common Page 8 between the operational elasticity and environmental uncertainty in the study they conducted on the manufacturing companies in the Northern America.
Uncertainty (Chen and Paulraj, 2004; Li and Lin, 2006; and Wong et al., 2011; Davis 1993, Fynes et al., 2004; Qi et al., 2011) was classified under three categories: Demand uncertainty, supply uncertainty and technological uncertainty.
Demand uncertainty refers to the changes in the preferences and number of customers that determine the products, plans and strategies of businesses under changing environmental conditions. Contrary to today‟s traditional sales and marketing methods, customer demands and preferences are changing very rapidly. This leads to uncertainty and instability concerning the quantity, location and time of customer demands (Li and Lin, 2006: 1645). Demand uncertainty is related to the change ratio in the product market and the change ratio of the buyers. High market uncertainty may lead to frequently changing customer orders and changing production plans, sales plans and etc. If the change is so frequent, it may push companies to cooperate and integrate with their suppliers (Lee et al., 2009: 192).
Supply uncertainty is defined as the condition in which the product of a supplier and its delivery cannot be estimated. It covers the uncertainty regarding the quality of the product supplied, delivery reliability, delivery time and cost. The company may delay and even stop its production process if the supplier delivers an inappropriate material or if the delay in the delivery of the material is beyond what is anticipated (Li and Lin, 2006: 1645). It is not possible to have an affective mechanism to manage the supplier relationships under the uncertain market conditions. In other words, increasing the relative attraction of supplier alliances under uncertain conditions can reduce complexities. The positive relation between uncertainty and supplier cooperation was also supported by empiric studies (Lee et al., 2009: 191). Although there is a positive relation between the quality of the buyer-supplier relations and the firm performance when the environmental uncertainty is low, there does not exist such a positive relation under high environmental uncertainties (Srinivasan et al, 2011: 267).
Licensed under Creative Common Page 9 competition. As the products in the market are replaced very rapidly, it is very hard to be accurate in estimating the expectations (Lee et al., 2009: 191).
Griffiths and Wall described two possibilities to avoid uncertainty. They defined poor uncertainty conditions as positive conditions for change and new opportunities. However, they defined strong uncertainty conditions as conditions in which a continuous and routine structure should be preferred (Griffiths and Wall, 2005: 568). Coping with uncertainty is the essence of the organizational process. The arena where the open system organizations generate their resources also sets the firm perspectives and leads to uncertainty. Organizations try to cope with the uncertainties in certain activities such as information processing and organizational learning. At least conditions that will not create any problems for the organizational design and the ways to cope with the uncertainty should be identified (Anderson and Tushman, 2001: 682).
Financial performance
Financial performance is a measure of how well profit-making organizations achieves the financial targets to ensure profit maximization by using financial ratios. Financial performance can be measured both systematically and by using existing concrete data; therefore, it requires lower cost and less time. To the contrary, measurement of non-financial performance requires higher cost and more time. There are many published papers about the organizational performance measurement systems including the performance measurement and use in addition to the financial and non-financial measurements (Coşkun and Bayyurt, 2008: 80).
Ratio analysis, analysis of comparative statements, trend analysis, vertical percentages
analysis, flow of funds statement are the most preferred methods to measure the financial performance. Ratio analysis is the most common one. Liquidity ratios, leverage ratios, activity ratios and profitability ratios are calculated in ratio analysis. There are various methods to measure the success of companies. Traditional performance measurement methods are the most common methods that have been increasingly used in the last 2 to 3 decades. Return on Assets-ROA, Return on Equity-ROE, Earnings per share-EPS and Earnings before interest, tax, amortization and depreciation-EBITDA are the most widely used traditional financial performance measurement methods (Gökbulut, 2009: 54).
LITERATURE REVIEW
Licensed under Creative Common Page 10 create customer value for competitive advantage and obtain a position such as cost leadership or differentiation by increasing market share or profitability (Thatte, 2007: 42).
Lean SCM and Agile SCM that are two different supply chain management strategies have different advantages and disadvantages in terms of competitiveness or competitive strategy to be implemented. Agile supply chain strategy focuses on responsiveness. Therefore, it aims to respond to the changing demands of customers rapidly. It is difficult for companies that will implement the cost leadership strategy to have high level of responsiveness. The companies that will use the lean supply chain strategy will have difficulties in becoming highly adaptive through differentiation strategy because they use lean production techniques, aim at reducing wastes and stocks and performing long-term productions.
Companies have to identify and preserve their competitive positions as much as they try to set competitive strategies. They have to match their resources and capabilities with the customer demands for a competitive position. The competitive strategy should be set and maintained in a way that a company can use its resources and capabilities better than its competitors. To initiate the design of a supply chain, competitive strategy should be determined first (Prasad et al., 2012: 189).
Qi et al. found in a study they performed in 2011 that cost leadership strategy and lean supply chain strategy had a positive impact on the firm performance when the environmental uncertainty was low; whereas, differentiation strategy and agile supply chain strategy had a greater impact on the firm performance when the environmental uncertainty was high (Qi et al., 2011: 381).
It was found that average companies using at least one of the competitive strategies got a positive impact on the financial performance compared to the other companies and also profitability and market share increased when cost superiority or a good level of differentiation was achieved (Yaşar, 2010: 311).
Many researchers in the field of operations-transactions management (Williams et al., 1995; Ward and Duray, 2000) carried out studies on the production strategies. Some of these studies tried to determine the relation between the competitive strategies and production strategies with diligence. These studies concluded that the use of production strategies and competitive strategies jointly in harmony enabled companies to achieve a better performance. Companies started to create other chains that will help them achieve competition and production strategies and objectives once the supply chain was introduced.
Licensed under Creative Common Page 11 relation between the production strategies, competitive strategies and firm performance. Meanwhile, it was found that both cost leadership and differentiation strategies had a positive impact on the market share increase, which is one measures of the company performance, while cost leadership strategy had a greater positive impact (Gyampah and Acquaah, 2008: 585-586). Likewise, Ward and Duray found a high positive relation between the differentiation strategy and quality, which is a production strategy, and firm performance. Ward and Duray (2000) tried to test the relation between the environmental dynamism, competitive strategies and firm performance in their conceptual modeling study regarding the production strategies. They found a positive and significant impact on environmental dynamism and differentiation strategy, while they didn‟t find any significant impact on the cost leadership strategy (Ward and Duray, 2000: 131).
In another study of Ward et al. (1995), the relation between the environmental concern, competition priorities and firm performance was tested. The data analysis showed striking differences between the competitive strategies in the cases of high and low company performance. It was observed that both differentiation and cost reduction strategies were used to respond to the increased competition in case of low performance. On the other hand, it was found that only differentiation by improving the delivery performance could respond to the environmental stimulants in case of high performance. Therefore, it was also found that the stimulant danger in the form of „stuck in the middle‟ defined by Porter (1980) was faced in case of low performance (Ward at all, 1995: 21-22).
Halawi, McCarthy and Aronson (2006) found in their study a significant relation between the information technologies and competitive strategies (Halawi, McCarthy and Aronson, 2006: 384).
Cortes et al. (2012) who studied the characteristics of organizational structure relating to the hybrid competitive strategy compared the competitive strategies in cases of high differentiation and low cost. They concluded that high degree of formalization associated with cost leadership strategy; whereas, low degree of formalization was not associated with the differentiation strategy. The findings of the comparison showed that the hybrid competitive strategy influenced the firm performance positively (Cortes et al., 2012: 993).
Licensed under Creative Common Page 12 Dadzie et al. (2012) claimed in their study analyzing the relation between Ghana‟s organizational culture, competitive strategy and firm performance demonstrated that the organizational culture had a direct and indirect impact on the firm performance. Furthermore, they also claimed that the hierarchy culture and competitive strategy influenced the firm performance. Chan (2005) stated that there is significant relation between the competitive strategy and the production and logistics system performance.
Balmeceda (2008) analyzed the relation between the environmental uncertainty, payment, performance and asymmetric information in his study and claimed that the environmental uncertainty influenced the wage or performance increase or sensitivity. He concluded that the wages were increased to improve the performance as the environmental uncertainty increases, while the performance sensitivity decreased.
There should be a strong relationship and communication with the members of the supply chain to respond to the supply chain uncertainty. Fang and Whinston (2011:189) claimed that option contract might be an effective method to increase especially the supplier profitability and supply chain efficiency in case of a supply chain uncertainty. Paulraj and Chen (2007: 35) explored the impact of the Strategic Supply Management practices as a response to the Demand uncertainty, Supply uncertainty and technological uncertainty in their study and measured how certain variables such as strategic purchasing, long-term relationships, communication between firms, cross organizational teams and supplier integration influenced uncertainty. In conclusion, they concluded that there was a significant relation between these variables and strategic supply chain and thus uncertainty. Kinra and Kotzab (2008: 289) found in their study that environmental uncertainty, competitive and organizational strategies are associated with the firm performance.
Licensed under Creative Common Page 13 When the national and foreign studies on the environmental uncertainty and firm performance are reviewed, it is understood that majority of the authors acknowledges the importance of uncertainty (Vechiato, 2012: 436; Lin, 2006: 439; Lee et al., 2009: 192; Chen and Paulraj, 2004: 122; Kocabaşoğlu et al., 2007: 1143; Pagel and Krause, 1999: 308; Habib et al., 2011: 256, Yoe, 2012: Hill, 2008, Rodrigues et al., 2008: Griffiths and Wall, 2008). Moreover, some of the authors claim that there is a relation between the change under the uncertainty conditions and firm performance (Paulraj and Chen, 2007; Haleblian and Finkelstein, 1993; Badri et al., 2000, Qi et al., 2012; Claycomb et al., 2002). Many authors attempted to find the moderating effect of the environmental uncertainty on the relation between various variables (such as competitive structure, firm structure, management structure, being an old vs. new company, production strategies, supply chain strategies) that they thought influenced the firm performance instead of testing the direct impact of the environmental uncertainty on the firm performance. Some of these studies are summarized as follows:
Study of Badri et al. (2000) on the business strategies, environmental uncertainty and performance: Analysis of the data relating to the manufacturing companies in the United Arab Emirates showed that the successful companies were the ones that used environmental variables as an effective control tool and that had high performance.
Hosseini and Sheikhi (2012) tested the relation between the competitive capability and firm performance under the perceived environmental uncertainty and found a significant association between the competitive capability and customer satisfaction, financial performance and market performance. Furthermore, they concluded that the perceived environmental uncertainty had a moderating impact on the competitive capability and firm performance. It was concluded that cost leadership capability influenced the customer satisfaction, while the differentiation capability influenced the financial performance better under different uncertainty conditions. Moreover, they also concluded that differentiation had a greater impact on the market performance.
Licensed under Creative Common Page 14 their competitive advantage through cost control and more innovation. It was stated that the firms in both countries had competitive uncertainty and especially the ones in Turkey needed strategic analysis and planning more due to their global competitors. It was also found that the technology uncertainty and market uncertainty were low in both countries.
Daft et al (1987) conducted a study on 50 manufacturing companies in Texas, USA and concluded that the degree of uncertainty in the fields of consumption, economy and competition was higher than the one in the technological, regulatory and socio-cultural fields. Furthermore, the firm managers stated that they used the personal information sources more when the uncertainty was high in their industries. It was concluded that high-performing companies They concluded that the presidents of high performing firms carried out more comprehensive surveillance regarding the strategic uncertainty compared to the presidents of low performing firms.
Sung et al (2010) conducted a study to identify the relation between the time-oriented strategies and performance of design companies in Taiwan under environmental uncertainty and claimed that the companies designing new products aimed at gaining a competitive advantage, although there would be unknown variables regarding the environment no matter which business or company strategy is used. The analysis of the research data revealed that uncertainty influenced the business performance criteria such as adaptation and innovation directly. Moreover, it was concluded that the time-oriented strategy was associated with the environmental uncertainty and this influenced the business performance positively.
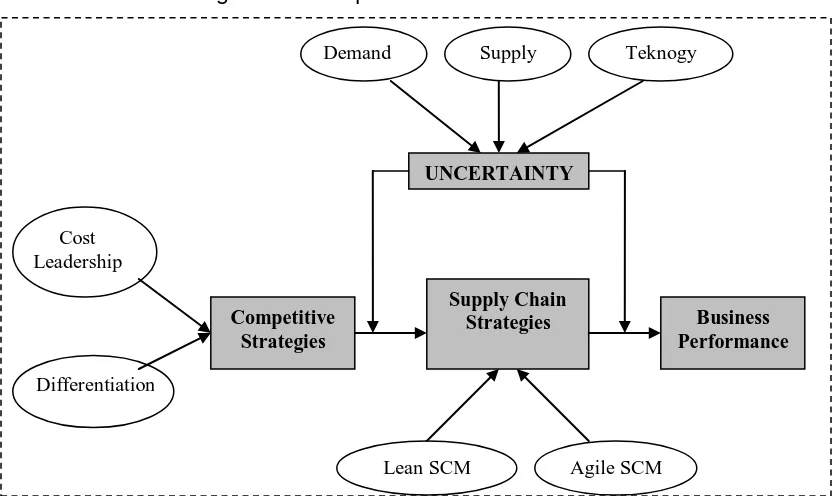
Figure 3: Conceptual Model of Research
UNCERTAINTY
Competitive Strategies
Supply Chain
Strategies Business
Performance
Demand Supply Teknogy
Cost Leadership
Differentiation
Licensed under Creative Common Page 15
RESEARCH METHODOLOGY Design & Data Collection
The research data was collected through a survey from the manufacturing companies listed in İstanbul Stock Exchange (Borsa İstanbul). These firms were preferred because they were the largest and most institutionalized firms in Turkey. Appointments were taken from 174 firms first by e-mails and then by telephone to apply the questionnaires. 90 firms accepted to respond to the questionnaire. Survey of a large majority (more than 90%), production, marketing, accounting and purchasing directors or deputy directors have been answered.
Three methods are used to check if the data set is suitable for the factor analysis; which are correlation matrix, Barlett test and Kaiser-Mayer-Olkin (KMO) test. In the interpretation of the KMO value; if the value is greater than 0,50, it means that the data set is suitable for the factor analysis (Kalaycı, 2005: 321-322).
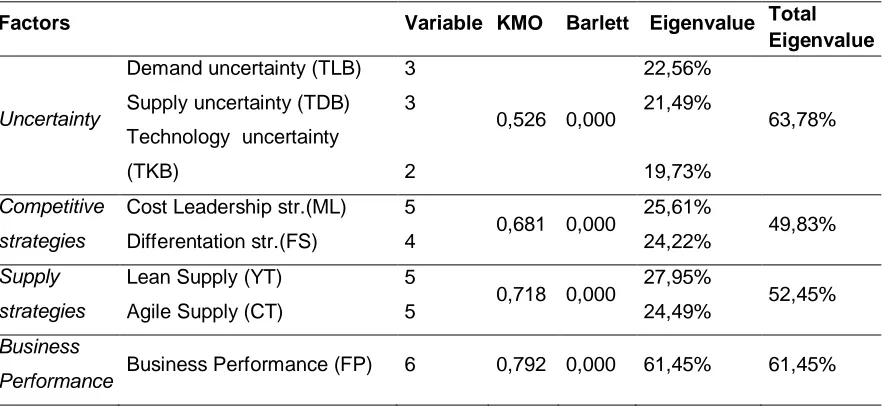
Table 1: Suitability of the Data Set for Factor Analysis and Eigenvalues
Factors Variable KMO Barlett Eigenvalue Total
Eigenvalue
Uncertainty
Demand uncertainty (TLB) 3
0,526 0,000
22,56%
63,78%
Supply uncertainty (TDB) 3 21,49%
Technology uncertainty
(TKB) 2 19,73%
Competitive strategies
Cost Leadership str.(ML) 5
0,681 0,000 25,61% 49,83%
Differentation str.(FS) 4 24,22%
Supply strategies
Lean Supply (YT) 5
0,718 0,000 27,95% 52,45%
Agile Supply (CT) 5 24,49%
Business
Performance Business Performance (FP) 6 0,792 0,000 61,45% 61,45%
It was agreed that the data set was suitable for the factor analysis because the table showed that the KMO values of the variables relating to the factors were greater than 0,50 and Barlett values were equal to 0,000.
Licensed under Creative Common Page 16 the uncertainty related to the sampling could be tolerated. The confidence level of this study was found to be 95% (Baş, 2006: 47). Harman‟s single factor test was performed to understand if there was any common method variance. The single factor test performed yielded one factor with an eigenvalue greater than 1. The variance value of this factor was 0,189. This ratio shows if there is any variance issue (Podsakoff and diğerleri 2003; Chang et al. 2010; Malhotra et al. 2006). Therefore, it can be said that there isn‟t any common method variance bias in the data.
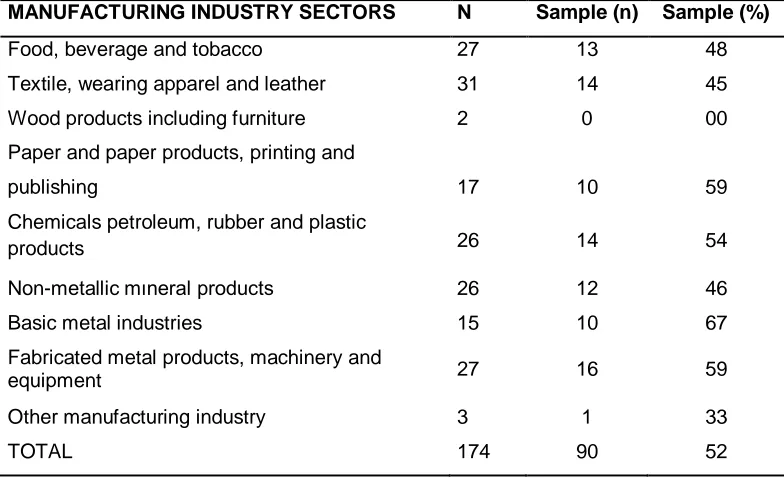
Table 2: Population, Sample and Sample Percentage of Firms
in the Manufacturing Industry Listed in BIST from which the data was collected
MANUFACTURING INDUSTRY SECTORS N Sample (n) Sample (%)
Food, beverage and tobacco 27 13 48
Textile, wearing apparel and leather 31 14 45
Wood products including furniture 2 0 00
Paper and paper products, printing and
publishing 17 10 59
Chemicals petroleum, rubber and plastic
products 26 14 54
Non-metallic mıneral products 26 12 46
Basic metal industries 15 10 67
Fabricated metal products, machinery and
equipment 27 16 59
Other manufacturing industry 3 1 33
TOTAL 174 90 52
Source: Compiled from BIST, firm information of the year 2012.
Measures
Licensed under Creative Common Page 17
Psychometric Properties
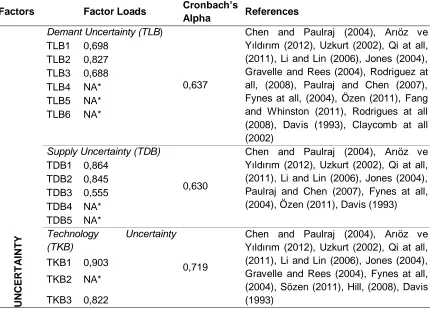
Table 3 shows the Cronbach‟s Alpha values of each factor in the scale. The acceptable limit of reliability coefficient in studies is ,70. However, the acceptable limit is ,60 in exploratory studies (Hair et al., 1998; Hair et al., 2010). The lower limit in this study was agreed to be ,60 As we thought that such an empirical study in which different variables are used has not been carried out in Turkey previously, we are of the opinion that the reliability ratios of the scale are acceptable. After the reliability analysis, the quantitative verification of the factor structure in the questionnaire should be performed (Baş, 2006: 193). Factor analysis is a common statistical method used to identify small number of significant and independent factors that can be used to represent relationships among sets of interrelated variables. Contrary to the regression analysis, factor analysis attempts to identify general variables that are called factors by combining highly correlated and dependent sets of variables (Kalaycı, 2005: 321).
Variables with a factor loading lower than 0.4 were excluded from the analysis. The symbol * was used in Table 3 to indicate the variables that were excluded. For example; the variables TLB4, TLB5 and TLB6 in the demand uncertainty table were excluded from the analysis due to their low factor loadings.
Table 3: Factor loadings, reliability values and references of the dependent variables.
Factors Factor Loads Cronbach’s
Alpha References
U N C ER T A IN T Y
Demant Uncertainty (TLB)
0,637
Chen and Paulraj (2004), Arıöz ve Yıldırım (2012), Uzkurt (2002), Qi at all, (2011), Li and Lin (2006), Jones (2004), Gravelle and Rees (2004), Rodriguez at all, (2008), Paulraj and Chen (2007), Fynes at all, (2004), Özen (2011), Fang and Whinston (2011), Rodrigues at all (2008), Davis (1993), Claycomb at all (2002)
TLB1 0,698 TLB2 0,827 TLB3 0,688 TLB4 NA* TLB5 NA* TLB6 NA*
Supply Uncertainty (TDB)
0,630
Chen and Paulraj (2004), Arıöz ve Yıldırım (2012), Uzkurt (2002), Qi at all, (2011), Li and Lin (2006), Jones (2004), Paulraj and Chen (2007), Fynes at all, (2004), Özen (2011), Davis (1993) TDB1 0,864
TDB2 0,845 TDB3 0,555 TDB4 NA* TDB5 NA*
Technology Uncertainty (TKB)
0,719
Chen and Paulraj (2004), Arıöz ve Yıldırım (2012), Uzkurt (2002), Qi at all, (2011), Li and Lin (2006), Jones (2004), Gravelle and Rees (2004), Fynes at all, (2004), Sözen (2011), Hill, (2008), Davis (1993)
TKB1 0,903 TKB2 NA*
Licensed under Creative Common Page 18 C O MPE T İT İV E ST R A T E G IES
Cost Leadership Str. (ML)
0,675
Porter (1980), Porter (2000), Thatte (2007), Warren (2002), Hooley at all (2008), Eren (2002), Hill and Jones (2009), Cheng (2005), Qi at all (2011), Leitner and Güldenberg (2010); Gyampah and Acquaah, (2008), Ward and Duray,(2000)
ML1 0,568
ML2 0,654
ML3 0,625
ML4 NA*
ML5 0,661
ML6 NA*
ML7 689
Differantation Str. (FS)
0,688
Porter (1980), Porter (2000), Thatte (2007), Warren (2002), Hooley at all (2008), Eren (2002), Hill and Jones (2009), Cheng (2005), Qi at all (2011), Leitner and Güldenberg (2010); Gyampah and Acquaah,( 2008), Ward and Duray, (2000)
FS1 0,574
FS2 0,699
FS3 0,772
FS4 0,691
FS5 NA*
Su p p ly C h aı n S tr ate g ıe s
Lean Supply (YT)
0,806
Wang at all. (2004), Ross (2008), Mentzer at all (2006), Ross (2011), Chopra and Meindl (2007), Başkol (2011), Harrison at all (1999), Christopher and Towill (2000), Power (2005), Naylor at all (1999), Christopher at all (2004), Xu (2006), Qi at all (2011), Sarkis (1999), Srivastava (2007)
YT1 0,714 YT2 0,825 YT3 0,775 YT4 0,603 YT5 NA* YT6 0,615
YT7 NA* Agile Supply (CT)
0,710
Wang at all. (2004), Ross (2008), Mentzer at all (2006), Ross (2011), Chopra and Meindl (2007), Başkol (2011), Harrison at all (1999), Christopher and Towill (2000), Power (2005), Naylor at all (1999), Christopher at all (2004), Xu (2006), Qi at all (2011), Sarkis (1999), Srivastava (2007)
CT1 NA* CT2 NA* CT3 0,527 CT4 0,568 CT5 0,583 CT6 0,807
CT7 0,776
B u s in e s s Pe rfo rm a n c e
Firma Performansı (FP)
0,873
Kaplan and Norton (1996), Kinra and Kotzab (2008), Kwak and Gavirneni (2011), Qi at all (2011), Mabberley (1997), Knight and Bertoneche, (2001), Brealey and Myers, (2003b), Hirschey at all.(2009), Higgins, (2000), Atrill, (2009), McLaney (2009),
FP1 0,840 FP2 0,816 FP3 0,748 FP4 0,844 FP5 0,821 FP6 0,607
* Items were deleted due to the low factor loadings or deleted in the validation process.
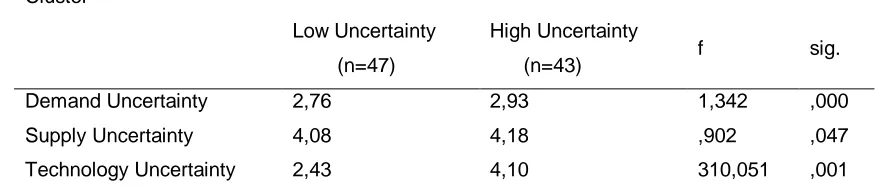
Licensed under Creative Common Page 19 The perception scores of companies about the demand uncertainty, supply uncertainty and technology uncertainty were averaged in the cluster analysis and those below the average formed the first cluster- group and those above the average formed the second cluster- group. The first group represented high uncertainty- unstable environment, while the second one represented low uncertainty-stable environment. 43 firms were categorized under high uncertainty group, whereas the low uncertainty cluster had 47 firms.
Table 4: Results of Cluster Analysis regarding the Uncertainty Level Cluster
Low Uncertainty (n=47)
High Uncertainty
(n=43) f sig.
Demand Uncertainty 2,76 2,93 1,342 ,000
Supply Uncertainty 4,08 4,18 ,902 ,047
Technology Uncertainty 2,43 4,10 310,051 ,001
The structural model can be established and tested after the cluster analysis. At that stage, the structural model was applied separately to 47 firms in the low-uncertainty environment cluster and 43 firms in the high uncertainty environment cluster.
ANALYSIS AND RESULTS
The fit indices found for the confirmatory factor analysis were acceptable. Furthermore, chi square test results, high t- values and reliability coefficients greater than ,60 show than there is no concern about the reliability and validity of the data (Shook et al., 2004:401; Byrne, 1998:111). The number of observation in the sample of this study was 90. Considering the SEM studies in the literature, it can be stated that the sample size of this study assessed according to the number of variables is adequate (Narasimhan and Jayaram, 1998:588).
Licensed under Creative Common Page 20 Figure 4: Parameters of the Structural Model under High Environmental Uncertainty
χ²: 17,663, df: 9, X2/df=1,963, GFI: .966, RMR: .300, AGFI: .863, NFI: .891, CFI: .998, RMSEA: .041. *p<.05 ** p>.05
Figure 5: Parameters of the Structural Model under Low Environmental Uncertainty
χ²: 28,966, df: 12, X2/df=2,413, GFI: .951, RMR: .443, AGFI: .806, NFI: .844,CFI: .989, RMSEA: .047. *p<.05 ** p>.05
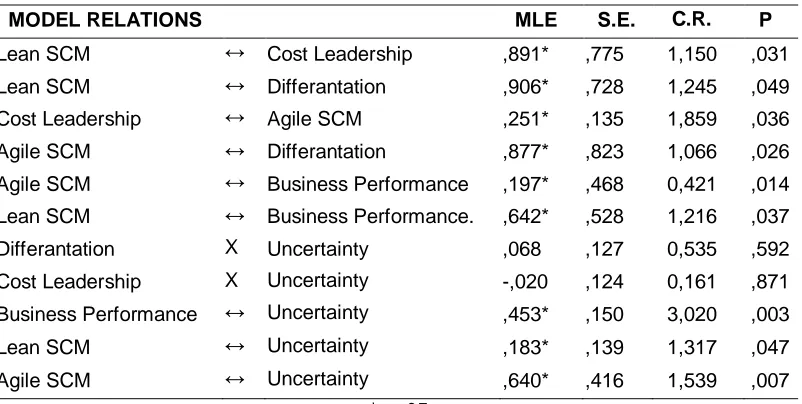
Table 5: Maximum Likelihood Values and Significance (p) Levels of the Structural Model
MODEL RELATIONS MLE S.E. C.R. P
Lean SCM ↔ Cost Leadership ,891* ,775 1,150 ,031 Lean SCM ↔ Differantation ,906* ,728 1,245 ,049 Cost Leadership ↔ Agile SCM ,251* ,135 1,859 ,036 Agile SCM ↔ Differantation ,877* ,823 1,066 ,026 Agile SCM ↔ Business Performance ,197* ,468 0,421 ,014 Lean SCM ↔ Business Performance. ,642* ,528 1,216 ,037 Differantation X Uncertainty ,068 ,127 0,535 ,592 Cost Leadership X Uncertainty -,020 ,124 0,161 ,871 Business Performance ↔ Uncertainty ,453* ,150 3,020 ,003 Lean SCM ↔ Uncertainty ,183* ,139 1,317 ,047 Agile SCM ↔ Uncertainty ,640* ,416 1,539 ,007
*p<,05
Cost
Leadership
Differentiation
Lean SCM
Agile SCM
Business
Performance
.8.89*
.52*
.64* .26*
* * * *
Cost
Leadership
Differentation
Lean SCM
Agile SCM
Business
Performance
e
.91*
.88*
.20* .18*
Licensed under Creative Common Page 21 No significant relation was found between the differentiation strategy and overall leadership strategy, which are the competitive strategies, and uncertainty according to the results of the structural model. Significant relations were found between the other variables in the model. According to the results of the structural model, the relational parameters, acceptance or rejection of the predetermined three hypotheses are as follows.
Hypothesis 1: Competitive strategies influence the supply chain strategies significantly. Hypothesis Relation MLE Significant
H1a ML ↔ YT (.89)* p .031 H1b ML ↔ CT (.26)* p .036 H1c FS ↔ YT (.91)* p .049 H1d FS ↔ CT (.88)* p .026 *p<0,05
According to these findings, it can be stated that the competitive strategies have a significant impact on the supply chain strategies. While the overall cost leadership strategy has a minor impact on the agile supply chain strategy, it has a great influence on the lean supply chain strategy. It was found that differentiation strategy influenced both lean and agile supply chain strategies significantly.
Hypothesis 2: Environmental uncertainty has a moderating effect on the competitive strategies and supply chain strategies.
Hypothesis Relation MLE Significant
H2a Low uncertainty: ML↔CT (.18)* p .047 High Uncertainty: ML↔CT (.26)* p .036
H2b Low uncertainty: ML↔YT (**) p .592 High Uncertainty: ML↔YT (.89)* p .031
H2c Low uncertainty: FS↔CT (.88)* p .026 High Uncertainty: FS↔CT (.52)* p .048
H2d Low uncertainty: FS↔YT (.91)* p .049 High Uncertainty: FS↔YT (**) p .871
*p<0,05 ** No significant relations.
Licensed under Creative Common Page 22 On the other hand, it was found that high environmental uncertainty (volatile uncertainty) had a high and significant impact on the overall cost leadership strategy and lean supply chain strategy. Furthermore, it was also found that if influenced the differentiation strategy and agile supply chain strategy significantly.
Hypothesis 3: Environmental uncertainty has a moderating effect on the supply chain strategies and firm performance.
Hypothesis Relation MLE Significant
H3a Low uncertainty: YT↔FP (**) p .671 High Uncertainty: YT↔FP (.64)* p .037
H3b Low uncertainty: CT↔FP (.20*) p .014 High Uncertainty: CT↔FP (**) p .458 *p<0,05 ** no significant relations.
Based on the findings of this study, it can be stated that the environmental uncertainty has a moderating effect on the supply chain and firm performance. It appears that low environmental uncertainty and agile supply chain strategy influence the financial performance. Likewise, it seems that lean supply chain strategy influences firm performance under high environmental uncertainty.
DISCUSSION, MANAGERIAL IMPLICATIONS AND CONCLUSIONS
Today‟s firms seek for innovation and perform various practices in order to be more competitive profitable and productive. They try to set a competitive strategy or a position to survive and compete with the other firms. The competitive strategies include cost leadership, differentiation and focus strategies. These strategies have both pros and cons. Firms set appropriate competitive strategies in line with their structures and conditions to carry out their activities. Likewise, they may also perform supply chain management practices in order to maximize profits, increase productivity and establish long-term relationships. Lean and Agile supply chain strategies have both pros and cons. Besides, conditions of environmental uncertainty also influence the activities, processes, decisions and thus strategies of the firms. Therefore, changes considered as uncertainty are thought to influence the processes of the firms.
Licensed under Creative Common Page 23 chain strategies influenced the firm performance differently. To this end, hypotheses were tested by analyzing the data collected from the manufacturing companies listed I BIST with respect to their perceptions.
According to the analysis results, three hypotheses were accepted. To test the H1 hypothesis claiming that “Competitive strategies influence the supply chain strategies significantly”, structural equation model was used and overall cost leadership strategy was found to have a higher impact on the lean supply chain strategy. On the other hand, the differentiation strategy was found to influence both lean and agile supply chain strategies positively. According to this finding, the manufacturing companies listed in BIST choose the lean supply chain strategy when they applied the overall cost leadership as a competitive strategy. Likewise, those companies that choose the differentiation strategy as a competitive strategy use both the lean and agile supply chain strategies. As the cost leadership strategy aims to reduce the overall costs, while the lean supply chain strategy aims at reducing the wastes, redundant work, transactions and stocks; high mutual relationship was an expected result. The companies choosing the differentiation strategy attempt to create a competitive advantage against their competitors by differentiation a work, transaction or process. Although a high relation was expected between the differentiation and agile supply chain strategies in this study, the fact that the differentiation strategy associated with both the agile and lean supply chain strategies could be explained by different perspectives of the firms.
The second hypothesis of the study that was “Environmental uncertainty has a moderating effect on the competitive strategies and supply chain strategies” was accepted as a result of the structural model analysis. It was found that the competitive and supply chain strategies varied depending on the low and high environmental uncertainty conditions. Differentiation strategy as a competitive strategy was found to have a greater impact on the lean
and agile supply chain strategy under low environmental uncertainty (stable environment) conditions compared to the cost leadership strategy. Cost leadership strategy did not have any significant impact on the lean supply chain strategy, where it influenced the agile supply chain strategy significantly. Accordingly, Companies that perceived low environmental uncertainty preferred differentiation as a competitive strategy and agile supply chain as the supply strategy because it could be said that they attempted to create a competitive advantage by differentiating from the competitors considering that they would focus on low cost. Therefore, they might choose agile supply strategy for the purpose of differentiation.
Licensed under Creative Common Page 24 while it influenced the agile supply significantly. On the other hand, cost leadership was found to influence lean and agile supply chain strategies positively, while it had a greater impact on the lean supply chain strategy. According to this finding, firms prefer the cost leadership as a competitive strategy and lean strategy as a supply strategy under the high uncertainty conditions they perceive. The reason for this may be because they try to create a competitive advantage by reducing the total costs instead of taking risk by differentiation strategy under high uncertainty conditions.
The third hypothesis of the study that was “Environmental uncertainty has a moderating effect on the supply chain strategies and firm performance” was tested by structural equation model and then accepted. The lean and agile supply chain strategies were found to influence the firm performance that was measured based on perceptions. While the agile supply chain influenced the firm performance positively under low environmental conditions, lean supply chain didn‟t have any significant impact on the firm performance. However, lean supply chain influenced the firm performance positively under high uncertainty; whereas agile supply chain didn‟t have any significant impact on the firm performance. According to this finding, the competitive and supply strategies preferred by the manufacturing companies listed in BIST vary when the environmental uncertainty they perceive changes. This may be because the adaptation to the external environment was important for the firms.
As a general conclusion of this study, it may be stated that companies choose differentiation strategy as a competitive strategy and agile supply chain as a supply chain
strategy when the environmental uncertainty is low, which influences the perceived performance
of the companies significantly. However, cost leadership strategy and lean supply chain strategy
influence the firm performance significantly and positively under high uncertainty conditions.
Licensed under Creative Common Page 25 Comparing the findings of this study with those of the previous studies, it is understood that they are consistent because the other studies (Narasimhan and Kim, 2002; Li et al., 2006; Demirdöğen and Küçük, 2007; Ganeshan et al., 2002; Gunasekaran, Patel and McGaughey, 2004; Wisner, 2003; Oi et al., 2010; Shanchez and Perez, 2005; Harrison and New, 2002; Randall and Ulrich, 2001; Kim, 2006; Srinavasan et al., 2011; Merschmann and Thonemann, 2011) i.e. the supply chain management influenced the firm performance positively.
It is also understood that the findings of this study are consistent with the other studies relating to the moderating impact of the environmental uncertainty on supply chain and supply chain performance (Wong et al., 2011; Fynes et al, 2004). However, they are not totally consistent with the study of Qi et al. (2011). Qi, Zhao and Sheu (2011) concluded in their study performed in China that firm performance was influenced positively and significantly by cost leadership and lean supply chain strategy under low uncertainty conditions and by differentiation strategy and agile supply chain strategy under high uncertainty conditions. This difference can be explained by many reasons, which may include different business cultures in the countries where the firms are established and different working cultures. Another reason may be because the firms from which data was collected in this study were mainly family-owner businesses, the firms were not institutionalized enough to perceive the uncertainty properly and thus make strategic choice and decision, experienced and old members of the family set or tried to set the strategies and they didn‟t use expert support adequately. Furthermore, the difference between the results of this study and those of other studies may be arising due to the different working cultures and strategy cultures among different countries. This might cause the average companies in different countries to take different decisions or act differently in similar situations. For this reason, it might be helpful for the companies in Turkey to work on their strategies more effectively. They might benefit from the expert support with respect to management and strategic analysis. The companies are expected to choose the competitive and supply chain strategies that will contribute positively to their financial performance depending on their uncertainty perceptions for the future (low vs. high) thanks to this study. Furthermore, the IT companies that develop computer software for supply chain applications are expected to design the software based on the findings of this study.
FURTHER STUDIES
Licensed under Creative Common Page 26 performance, this may provide a different perspective. Given that there are also other variables which are excluded from the scale and which might influence the results of the study, standardization of the research population, for example studying companies in a single sector or with certain size may provide different perspectives. In future studies, world can be taken as the population and certain number of countries and firms in different continents can be sampled for the findings of this study to be significant and to identify the differences between countries. In this way, the most general conclusions can be derived.
Note: This study was derived from a doctorate thesis accepted in December 2012 by Dumlupınar University, Social Sciences Institute, Department of Business Administration.
REFERENCES
Akman, Gülşen and Atakan Alkan, (2006), “Tedarik Zinciri Yönetiminde Bulanık AHP Yöntemi Kullanılarak Tedarikçilerin Performansının Ölçülmesi: Otomotiv Yan Sanayinde Bir Uygulama”, İstanbul Ticaret Üniversitesi, Fen Bilimleri Dergisi Yıl: 5, Sayı: 9, 1, ss.23-46.
Amir, Faiza, (2011), “Significance of Lean, Agile and Leagile Decoupling Point in Supply Chain Management”, Journal of Economics and Behavioral Studies, Vol. 3, No. 5, pp. 287-295, (ISSN: 2220-6140).
Amoako-Gyampah, Kwasi and Moses Acquaah, (2008), “Manufacturing Strategy, Competitive Strategy and Firm Performance: An Emprical Study in a Developing Economy Environment”, International Journal of Economics, 111, pp.575-592.
Anderson, Philip and Michael L. Tushman, (2001), “Organizational Environments and Industry Exit: The Effects of Uncertainty, Manifence and Complexity”, Industrial and Corporate Change, Vol.10, No.3, pp.675-711.
Arıöz, Ömer ve Kemal, Yıldırım, (2012), “Türkiye‟de Çimento Sektöründeki Belirsizlikler ve Türk Çimento Sektörünün SWOT Analizi”, Dumlupınar Üniversitesi Sosyal Bilimler Dergisi, DPUJSS Number 32, Vol. II, April, pp. 173-190.
Atrill, Peter, (2009), Financial Management For Decision Makers, Fifth Edition, FT Prentice Hall, Financial Times, England.
Badri, Masood A., Donald Davis and Donna Davis, (2000), “Operations Strategy, Environmental Uncertainty and Performance: A Path Analytic Model of Industries in Developing Countries”, The International Journal of Management Science, Omega, vol.28, pp.155-173.
Baker, Peter, (2008), “The Design And Operation Of Distribution Centres Within Agile Supply Chains”, International Journal of Production Economics, Vol 111(1), pp27-41.
Balmaceda, Felipe, (2008), “Uncertainty, Pay for Performance, and Asymmetric Information”, The Journal of Law, Economics, & Organization, vol.25, no.2, pp.400-441.
Licensed under Creative Common Page 27 Bowersox, D.J. (1969), Readings in Physical Distribution Management: The Logistics of Marketing, (Eds.) Bowersox, D.J., La Londe, B.J., and Smykay, E.W., MacMillan, New York.
Brealey, Richard A. and Stewart, C. Myers, (2003b), Principle of Corporate Finance, The McGraw-Hill Companies, Sixth edition.
Byrne, Barbara M. (1998), “Structural Equation Modelling with LISREL, PRELIS and SIMPLIS: Basic Concepts, Applications and Programming”, Lawrence Erlbaum Associates, Mahwah, New Jersey.
Byrne, Barbara M., (2010), “Structural Equation Modeling With AMOS, Basic Concepts, Applications and Programming, Second Edition”, Routledge Taylor & Franis Group New York, London.
Carrol, Brian J., (2002), Lean Performance ERP Project Management: Implementing The Virtual Supply Chain, ST. Lucie Press, A CRC Company.
Carrol, Brian J., (2008), Lean Performance ERP Project Management: Implementing The Virtual Supply Chain , Second Edition, Auerbach Publications, Taylor & Francis Group, Series on Resource Management, New York, London.
Chan, Joseph W. K. (2005), “Competitive Strategies and Manufacturing Logistics: An Emprical Study of Hong Kong Manufacturers”, International Journal of Phsical Distrubution & Logistcis Management, Vol.35, No.1, pp.20-43.
Chandra, Charu, and Sameer, Kumar, (2000), “Supply Chain Management in Theory and Practice: A Passing Fad or Fundamental Change?”, Industrial Management & Data Systems, Vol: 100/3, pp.100-113. Chang, S.-J., Witteloostuijin, A.V. and Eden, L. (2010), “From The Editors: Common Method Variance in International Business Research” Journal of International Business Studies, 41:178-184.
Chen, Injazz. J. and Antony, PAULRAJ, (2004), Understanding Supply Chain Management: Critical Research And A Theoretical Framework, Int. J. Prod. Res., Vol. 42, No. 1, pp.131–163.
Cheng, T.C.Edvin, Kee-Hung, Lai,. and Andy C.L., Yeung, (2005), Special Issue on Quality In Supply Chain Management And Logistics, International Journal of Production Economics.
Chopra, Sunil and Peter, Meindl, (2007), Supply chain management: Strategy, Planning and Operation, Upper saddle River, New Jessey: Pearson.
Christopher, Martin, (2000), “The Agile Supply Chain: Competing in Volatile Markets”, Industrial Marketing Management, 29(1), pp.37-44.
Christopher, Martin, Robert, LOWSON and Helen PECK, (2004), “Creatıng Agıle Supply Chaıns In The Fashıon Industry” International Journal of Retail and Distribution Management, Vol. 32, 2004, Issue 8, pp. 367-376.
Claycomb, Cindy, Droge, CORNELIA and Germain, RICHARD, (2002), “Applied Product Quality Knowledge and Performance: Moderating Effects of Uncertainty”, International Journal of Quality & Reliability Management, vol.19, no.6, pp.649-671.
Cook, Thomas A., (2011), Compliance in Toda‟s Global Supply Chain, CRC Press, Taylor & Francis Group, London, New York.
Coşkun, Ali ve Nizamettin, Bayyurt, (2008), “Measurement Frekans of Performance Indicators and Satistifaction on Corporate Performance: A Survey on Manufacturing Companies”, European Journal of Economics, Finance and Administrative Sciences, Issue.13, pp.79-87.
Croom, Simon., Pietro, Romano, and Mihalis, Giannakis, (2000), “Supply Chain Management: An Analytical Framework For Critical Literature Review”, European Journal of Purchasing & Supply Management 6, pp.67-83.
Dadzie, Charlene A., Evelyn, M. Wınston and Kofi, Q. Dadzie, (2012), “Organizationl Culture, Competitive Strategy, and Performance in Ghana”, Journal of African Business, 13(3), pp.172-182.
Licensed under Creative Common Page 28 Darbra, R.M., E. Eljarrat and D. Barcelo, (2008), “How to Measure Uncertainties in Environmental Risk Assessment”, Trends in Analytical Chemistry, Vol: 27, pp.377-385.
Davis, Tom, (1993), Effective Supply Chain, Sloan Management Review/Summer, pp.35-46.
Demirdöğen, O. ve O., Küçük, (2007), “Malzeme Akışının Verimliliğinde Tedarik Zinciri Yönetiminin Önemi”, 8. Türkiye Ekonometri ve İstatistik Kongresi, 24-25 Mayıs, İnönü Üniversitesi, Malatya.
Enrique Claver-Cortés, Eva M. Pertusa-Ortega; José F. Molina-Azorín, (2012), “Characteristics of Organizational Structure Relating to Hybrid Competitive Strategy : Implications For Performance”, Journal of business research, Vol. 65.2012, 7, p. 993-1002.
Eren, Erol, (2002), Stratejik Yönetim ve İşletme Politikası, Beta Yay. 6. Baskı, İstanbul.
Fang, Fang and Andrew, WHINSTON, (2011), “Capacity Management and Price Discrimination Under Demant Uncertainty Using Option Contracts”, International Handbooks on Information Systems, editor: Peter BERNUS, Jacek BLAZEWİCZ, Günter J. SCHMİDT, Michael J. SHAW, Springer-Verlag Berlin Heidelberg, pp.189-217.
Fynes, Brian, Sean de Burca and Dona, Marshall, (2004), “Environmental Uncertainty, Supply Chain Reltionship Quality and Performance”, Journam of Purchasing & Supply Management, vol. 10, pp.179-190.
Gamero, Maria D.Lopez, Jose F. Molina-Azorin and Enrique Claver-Cortes, (2011), “Environmental Uncertainty and Environmental Management Perception: A Multiple Case Study”, Journal of Business Research, Vol: 64, pp.427-435.
Ganeshan, R., JACK, E., Magazıne, M.J., and at All (1999), Taxonomic Review of Supply Chain Management Research, In: Tayur, S., Ganeshan, R, and Magazine, M., (Eds) Quantitative Models For Supply Chain Management, Kluwer Academic Publisher, Dodrecht, The Netherlands.
Garrat, Bob, (2007), “Dilemmas, Uncertainty, Risks, and Board Performance”, BT Technology Journal, Vol.25, No.1, January, pp.11-18.
Gökbulut, Rasim İlker, (2009), “Hissedar Değeri İle Finansal Performans Ölçütleri Arasındaki İlişki ve İMKB Üzerine Bir Araştırma”, Yayımlanmamış Doktora Tezi, İstanbul Üniversitesi, Sosyal Bilimler Enstitüsü, Finans ABD, İstanbul.
Gravelle, Hugh and Ray, Rees, (2004), Macroekonomics, 3rd. Edition, Prentice Hall, UK.
Griffiths Alan and Stuart Wall, (2005), “Economics for Business and Management”, Prenitice Hall, Financial Times, An imprint of Pearson Education, England.
Gunasekaran, A. and Ngai, E.W.T. (2004), “Information Systems In Supply Chain Integration And Management”, European Journal of Operational Research, vol. 159, s.269-295.
Gunasekaran, Patel, McGaughey, (2004), “A Framework for Supply Chain Performance Measurement”, International Journal of Production Economics 87 (2004) 333–347
Güneri, A. F. and A. Kuzu, (2009), “Supplier Selection By Using a Fuzzy Approach in Just-in-Time: A Case Study”, International Journal of Computer Integrated Manufacturing, Vol:22, No:8, August, pp.774-783.
Habib, Ahsan, Mahumd Hossain and Haiyan Jiang, (2011), “Environmental Uncertainty and The Market pricing of Earnings Smoothness”, Advances in Accounting Incorporating Advances in International Accounting, vol.27, pp.256-265.
Hair, J.F. Anderson, R.E. Tahtam, R.L. ve Black, W.C., (1998). Multivariate Data Analysis. 5th Ed., NJ: Prentice-Hall International, Englewood Cliffs.
Hair, Joseph F., W.C. Black, B.J. Babin ve R.E. Anderson (2010), Multivariate Data Analysis, A Global Perspective, 7.Basım, Pearson Education Inc.
Licensed under Creative Common Page 29 Haleblian, Jerayr and Sydney Finkelstein, (1993), “Top Management Team Size, CEO Dominance, and Firm Performance: The Moderating Roles of Envioronmental Turbulance and Discretion”, Academy of Management Journal, vol.36, No.4, pp.844-863.
Hanna, M. and Newman, W. R., (2007), Integrated Operations Management: A Supply Chain Perspective, 2nd ed., Thomson & South-Western, Australia.
Harrison, A. and C. New, (2002), “The Role of Coherent Supply Chain Strategy and Performance Management in Achieving Competitive Advantage: An International Survey”, Journal of Operational Research Society, vol.53, pp.263-271.
Harrison, A., Christopher, M. and Van Hoek, R. (1999), Creating the agile supply chain, School of Management Working Paper, Cranfield University, Cranfield.
Higgins, Robert C., (2000), Analysis for Financial Management, McGraw-Hill Education, UK. Hill, Alan R., (2008), Strategic Financial Management, Author Finance & Ventus Publishing ApS.
Hıll, Charles W.L. and Gareth R. Jones, (2009), Essential of Strategic Management, second edition, South-Western Cengage Learning, USA.
Hirschey Mark, Kose JOHN and Anil K. makhija, (2009), Corporate Governance and Firm Performance, JAI pres in an Imprint of Emerald Group Publishing Limited, UK.
Hooley, J. Graham, Nigel F. Pıercy and Brigitte Nıcoulaud, (2008), Marketing Strategy and Competitive Positioning, Fourth Edition, Prentice Hall, England.
Hosseini, Seyed Mahmood and Narges Sheikhi, (2012), “An Emprical Examination of Competitive Capability‟s Contribution Toward Firm Performance: Modereting Role of Perceived Environmental Uncertainty”, International Business Research, vol.5, No.5. May, pp.116-131.
Jaın, Vipul, S. Wadhwa and S. G. Deshmukh, (2009), “Select Supplier-Related Issues in Modeling a Dynamic Supply Chain: Potential, Challenges and Dircetion For Future Research”, International Journal of Production Research, Vol:47, No:11, June, pp.3013-3039.
Jones, Terfor, (2004), Business Economics and Managerial Decision Making, John Wiley & Sons Ltd, The Atrium, Southern Gate, Chichester, West Sussex PO19 8SQ, England.
Kalaycı, Şeref, vd, (2005), SPSS Uygulamalı Çok Değişkenli İstatistik Teknikleri, Asil Yayın Dağıtım, Ankara.
Kaplan, Robert S. and David P. Norton, (1996), Translating Strategy Into Action The Balanced Scorecard, Harward Business School Press, Boston, Massachusetts.
Kimball E. Bullington, (2005), Lean Supply Strategies: Applying 5S Tools to Supply Chain Management, 90th Annual International Supply Management Conference, May, http://www.ism.ws/files/pubs/ proceedings/ hcbullington. pdf (06.06.2012).
Kim, Byeong Yong, (2006), “The Impact of Supplier Development on Financial performance in the Restaurant Industry”, International Journal of Hospitality & Tourism Administration, vol.7, No.4, pp.81-103.
Kinra, Aseem and Herbert, Kotzab, (2008), “A Macro Institutional Perspective on Supply Chain Environmental Complexity”, International Journal of Economics, vol.115, pp.283-295.
Knıght, Rory and Marc, Bertoneche, (2001), Financial Performance, Butterworth Heinemann, Red Educational and Professional Publishing Ldt.
Kocabasoglu, C., Carol Prahinski & Robert D. Klassen, (2007), “Linking Forward and Reverse Supply Chain Investments: The Role of Business Uncertainty”, Journal of Operation Management, 25, 1141-1160.
Kotler, Philip, (2000), Kotler ve Pazarlama: Pazar Yaratmak, Pazar Kazanmak ve Pazara Egemen Olmak”, Çev. Ayşe Özyağcılar, Sistem Yayıncılık, Birinci Basım, İstanbul.
![catena Poly[[copper(I) μ 2,6 bis[4 (pyridin 2 yl)thiazol 2 yl]pyridine] hexafluoridophosphate acetonitrile monosolvate] from single crystal synchrotron data](data:image/gif;base64,R0lGODlhAQABAIAAAP///wAAACH5BAEAAAAALAAAAAABAAEAAAICRAEAOw==)