4835
Formation Of The Two-Dimensional Distribution
Law Of Random Variables Dependent
Export-Import Flows Of Ukrainian-Indian Foreign Trade
Tetiana Bludova, Nataliya Boretskaya, Svіtlana Prochorchuk, Olena Lepyokhina, Galyna Kuznyetsova
Abstract: The study of Ukrainian-Indian trade relations, as well as the application of new techniques to the analysis and forecasting of export-import flows between countries, is an urgent problem. It is shown that the main task of the main state strategy is to simultaneously apply the import substitution policy and its complementarity with the export promotion policy. The article assumes that government policies on import substitution and export promotion are random variables compatible and dependent. In this context, export-import Ukrainian-Indian flows, which are a reflection of the policies discussed above, are considered as compatible and dependent random variables. The dynamics of export of goods to India from Ukraine (import of goods from India to Ukraine) and the calculated data of indicators of export and import dependence, theoretical frequencies, accumulated frequencies, observable criterion for Ukrainian-Indian foreign trade flows for the period 1996-2017 are presented. A two-dimensional normal law of distribution of Ukrainian-Indian foreign trade flows was constructed and a 0.95 equation of the principal scattering ellipse of the two-dimensional normal law of distribution of Ukrainian-Indian foreign trade flows for the period 1996-2017 was found with confidence.
Index Terms: Import substitution, export promotion, export dependency ratio, import dependency ratio, correlation coefficient, normal distribution law, scattering ellipse.
—————————— ——————————
1 INTRODUCTION
EACH state has its own national state systems for regulating foreign economic activity. On the one hand, they support the development of exports, especially in the context of new markets, and on the other hand, they regulate imports, which protects consumers and producers. Such national important tasks need to be refined, so the methods of solving them, as well as the creation of new economic and mathematical models for their description, analysis and forecasting, are a pressing problem. Import regulation (restriction) occurs through customs tariffs and non-tariff restrictions. The instruments of import regulation are border taxes and duties, anti-dumping measures. However, states apply not only the traditional ones - the embargo on the import of goods or the quantitative restriction of imports (quotas, licensing); and new administrative tools, such as voluntary self-restraint on exports. Note that government regulation of exports is not as important as imports. At the same time, there are measures to limit exports. Basically, states are interested in increasing exports (state export incentive systems), which leads to higher profits and higher employment. Among the various forms of modern export incentives are the exemption of exporters from certain taxes.Export promotion is a set of instruments and measures of a predominantly state nature, which internally encouragethe sale of domestic goods and services in foreign markets in order to improve the living standards of the population within the country. The export promotion policy includes any measures aimed at ensuring the sustainable development and realization of the country's export potential through:
1. Financial support, including the provision of financial services (loans, guarantees, as well as direct financing). 2. Informational support, consultations, trainings, search for
partners, establishing contacts with new exporters, entering new markets.
Other measures facilitating export development include the reduction of trade barriers and trade facilitation. There are many indirect factors contributing to export growth, such as macroeconomic and political stability, a favorable investment climate, and a well-developed infrastructure.
According to the Export Strategy of Ukraine, Strategic Trade Development Roadmap 2017 - 2021 INDIA - 10th economy in the world ranked 3rd in absolute growth rate, 7th place among Ukraine's largest historical partners during 2011-2015, 5th place in Ukraine's average growth rate exports of goods during 2014-16, 2nd place by food consumption potential. According to the World Bank's Doing Business 2019 rating, among the 190 countries in the world, India is ranked 77th in terms of:
- level of protection of minority investors - 7th place; - level of access of business circles to credit resources - 22
place;
- transparency of the procedure for connecting objects to the national network;
- power supply - 24th place.
According to the State Statistics Service, in January 2018, Ukraine exported $ 187.9 million worth of products to India and imported $ 39.7 million. India is the world's second-largest steelmaker after China. An increase in its exports will inevitably push the market and compete with Ukrainian manufacturers in the Asian and European markets, GMK Center analysts predict. According to the Joint Plant Committee of India, the most exported products from the country are hot-rolled coils. Recall that in 2018, Ukraine shipped 437 thousand tons of ————————————————
Tetiana Bludova, Doctor of Economics, Professor, Advanced Mathematics Department, Kyiv National Economic University named after Vadym Hetman, Kyiv, Ukraine. Email: [email protected]
Nataliya Boretskaya, Doctor of Economics, Professor, Department of Business Economics and Tourism, Kyiv National University of Technology and Design, Kiev, Ukraine. Email: [email protected]
Svіtlana Prochorchuk, Candidate of Economics, Associate Professor, Professor, Department of Finance, Accounting and Taxation, Vice-Rector for Educational and Methodological Work, International University of Business and Law, Kherson, Ukraine. Email: [email protected] Olena Lepyokhina, Doctor of Economics, Associate Professor, Professor,
Department of Finance, Accounting and Taxation, International University of Business and Law, Kherson, Ukraine E-mail: [email protected]
HRC to Asia, of which 152.5 thousand tons - to India, and to Europe over 1.7 million tons of hot-rolled coils.Therefore, the study of Ukrainian-Indian trade relations, as well as the application of new techniques to the analysis and forecasting of export-import flows between countries, is an urgent problem. Thus, the main task of the main strategy of the state is the simultaneous implementation of the import substitution policy and its complementarity with the export promotion policy.In our opinion, we can assume that government policies on import substitution and export promotion are random variables compatible and dependent. In this context, the idea emerged of considering export-import interstate flows, which are a reflection of the policies discussed above by the state, as compatible and dependent random variables.
2
LITERATURE
REVIEW
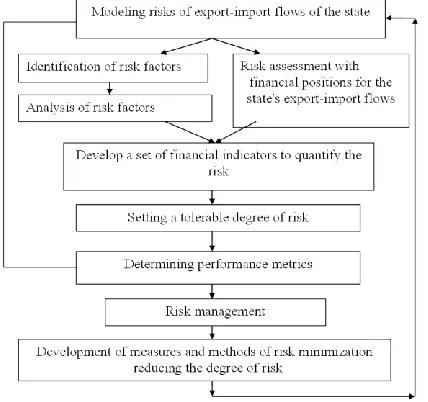
It should be noted that the foreign economic policy is first and foremost the political registration of international economic relations of the country, which are carried out between the economic entities of the country and their foreign partners [1]. The risks associated with choosing a country to conduct foreign trade operations are divided into political (loss or loss of profits as a result of public policy) and macroeconomic (economic development) [1].There are a number of risks in foreign economic activity: country risk; monetary; transport; bank; prepayment risk; risk of non-payment; risk of contract failure; sovereign risk; transfer risk; the risk of increased regulation by the government; marketing risk; risk of insufficient knowledge of legislation, customs and traditions [2]. There are transport risks; business risks; risks associated with customs regulation; marketing risks [3]. Figure 1 presents the scheme of research on the risk of export-import flows of the state.To minimize these risks, it is necessary to: study the political situation in the partner and transit countries; use of letters of credit and guarantees of banks; application of forfeiting and factoring agreements; realization of insurance; opening a branch in partner countries [4].In scientific work [5], currency risk, which is one of the most important factors in international trade, is defined as the risk of losses resulting from changes in exchange rates during the performance of a contract.
Fig. 1. Logical and structural scheme of research of risk of export-import flows of the state
Considering the considerable distance between the exporter and importer, the delivery of goods takes longer than in domestic trade. Thus there is a high probability of occurrence of transport risk [6]. Transport risk can be avoided by signing the relevant insurance agreements. In this case, the most important type of transport insurance is marine [7].
The absolute indicators that characterize the volume of external trade can be attributed [8]:
volume of export of goods - the volume of exported goods, works, services, results of intellectual activity, including exclusive rights to them, from the customs territory of the country abroad without the obligation of their return import. volume of import of goods - the volume of imported goods,
works, services, results of intellectual activity, including exclusive rights to them, to the customs territory of the country from abroad without the obligation of return export.
Country Export (Import) Index is the share of exports (imports) in the country's gross domestic product and characterizes the country's level of dependence on exports (imports) of goods and services [9]. It should be noted that export is the easiest way to enter the foreign market. The intensity and volume distinguish between irregular and regular exports. There are two types of exports: indirect and direct [9]. In [10], a number of trend models of dynamics of Ukraine's external debt, import, export, and net exports are considered and their forecasts are given. The models of distributed lag dependence of gross external debt on imports with a delay of two years, exports with a delay of one year and net exports with a delay of five years. Constructed and substantiated models with instrumental variables that are used for forecasting.In econometric models, the author [11] considers import and export functions as production functions. Usually, the import function depends on the variables that reflect: the level of economic activity, the import and domestic prices of the product group under consideration, and other factors. The export function depends on the variables: export prices, weighted average index of importers' domestic prices; weighted average level of economic activity in importing countries.
Export and import functions are used for
1. their relationship with macroeconomic indicators [12]; 2. to forecast the value of the trade balance [13];
3. to calculate the elasticity of export and import demand at prices [14].
4837 Bernoulli, N. Bernoulli, D. Bernoulli, P. Laplace, K. Gauss, S.
Poisson, and P.L. Chebyshova, A.M. Lyapunov, A.A. Markova, MV Ostrogradsky, due to which, on the one hand, a high degree of development of the theory, and on the other - was opened and implemented various possibilities of its application. Today, it is of interest to apply a two-dimensional normal probability distribution to applied economic problems, in particular to find the threshold range of indicators. The economic literature considers thresholds in the form of intervals for each individual indicator. In [19, 20, 21], for the first time, the relationship between two indicators of export and import flows of a leading region is presented, with a method for finding the threshold values of these indicators. As a result, comparisons of indicators of other regions are presented, provided that their values fall within the specified area.
3 RESULTS
Table I presents the dynamics of exports of goods to India from Ukraine (imports of goods from India to Ukraine) for the period 1996-2017.For a more complete assessment of the level of foreign trade cooperation, it is advisable to supplement the methodology with such indicators that will allow to evaluate not only quantitative characteristics of foreign economic activity, but also qualitative ones, which is possible precisely on the basis of the analysis of scientific and technological component. In particular, an important indicator is the share of high-tech products in exports. In our case, consider the indicators of foreign trade flows in the form of: Export / GDP - coefficient of export dependence (threshold value> 0.5); Import / GDP – coefficient of import dependence (threshold value> 0,5).
TABLE1
DYNAMICS OF UKRAINIAN-INDIAN EXPORT-IMPORT FLOWS FOR THE PERIOD 1996-2017(TH USD)
№ Year GDP th. USD
Exports to India th. USD
Imports from India th. USD 1 199
6
44560000 82227,25 90750,79 2 199
7
50150000 211783,5 82154,73 3 199
8
41880000 136214,8 79169,34 4 199
9
31580000 150488,3 65916,54 5 200
0
31260000 150407,8 75959,49 6 200
1
38010000 129896,3 95199,04 7 200
2
42390000 157857,1 110317 8 200
3
50130000 202789,4 153974,7 9 200
4
64880000 423657 232565,6 10 200
5
86140000 736868,8 321343,5 11 200
6
1,08E+08 850105,5 367918,4 12 200
7
1,43E+08 744103,9 464874 13 200
8
1,8E+08 1005562 649839,6 14 200
9
1,17E+08 1152457 476788,6 15 201
0
1,36E+08 1426038 680748,6
16 2011 1,63E+08 2265303 812348,2 17 201
2
1,76E+08 2290932 1020714 18 201
3
1,83E+08 1974622 838568,3 19 201
4
1,34E+08 1817438 656375,7 20 201
5
91031000 1444087 443659,6 21 201
6
93270000 1903067 486132 22 201
7
1,12E+08 2206232 561086,5
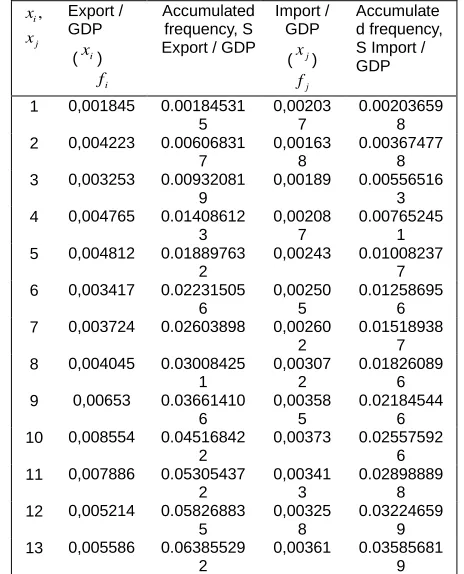
When determining the threshold values of these indicators, there is a complexity of their calculation for the region and the absence of indicators that take into account the scientific and technological component of international cooperation. For example, the indicator of the share of exported innovative products in the total volume of innovative products sold (threshold value> 0.3); indicator of technological dependence on external revenues of scientific and technological developments and high-tech products (threshold value <0.2); coefficient of technological dependence as a ratio of imports of high-tech goods to exports of high-tech goods in the region (threshold value <1). Such estimates should take into account the region's dependence on technology imports. In our study, we restrict ourselves to the analysis of two indicators of foreign trade flows: export and import dependence. Table 2 calculates, based on the data in Table 2, indicators of export and importrelative to GDP and dependence of Ukrainian-Indian foreign trade flows for the period 1996-2017.
TABLE2
ESTIMATED DATA OF EXPORT AND IMPORT RELATIVE TO GDP AND DEPENDENCE OF UKRAINIAN-INDIAN FOREIGN TRADE FLOWS AND
ACCUMULATED FREQUENCIES FOR THE PERIOD 1996-2017
, i j x x Export / GDP (xi) i
f
Accumulated frequency, S Export / GDP
Import / GDP
(xj) j
f
Accumulate d frequency, S Import / GDP 1 0,001845 0.00184531
5
0,00203 7
0.00203659 8 2 0,004223 0.00606831
7
0,00163 8
0.00367477 8 3 0,003253 0.00932081
9
0,00189 0.00556516 3 4 0,004765 0.01408612
3
0,00208 7
0.00765245 1 5 0,004812 0.01889763
2
0,00243 0.01008237 7 6 0,003417 0.02231505
6
0,00250 5
0.01258695 6 7 0,003724 0.02603898 0,00260
2
0.01518938 7 8 0,004045 0.03008425
1
0,00307 2
0.01826089 6 9 0,00653 0.03661410
6
0,00358 5
0.02184544 6 10 0,008554 0.04516842
2
0,00373 0.02557592 6 11 0,007886 0.05305437
2
0,00341 3
0.02898889 8 12 0,005214 0.05826883
5
0,00325 8
0.03224659 9 13 0,005586 0.06385529
2
14 0,009833 0.07368854 3 0,00406 8 0.03992498 1 15 0,010485 0.08417311
5
0,00500 5
0.04493000 7 16 0,013884 0.09805705
2
0,00497 9
0.04990885 1 17 0,013033 0.111089928 0,00580
7
0.05571558 7 18 0,010772 0.12186196
3
0,00457 5
0.06029017 8 19 0,013613 0.13547542
3
0,00491 7
0.06520673 9 20 0,015864 0.15133910
4
0,00487 4
0.07008045 9 21 0,020404 0.17174294
9
0,00521 2
0.07529255 3 22 0,019671 0.19141440
1
0,00500 3
0.08029537 5
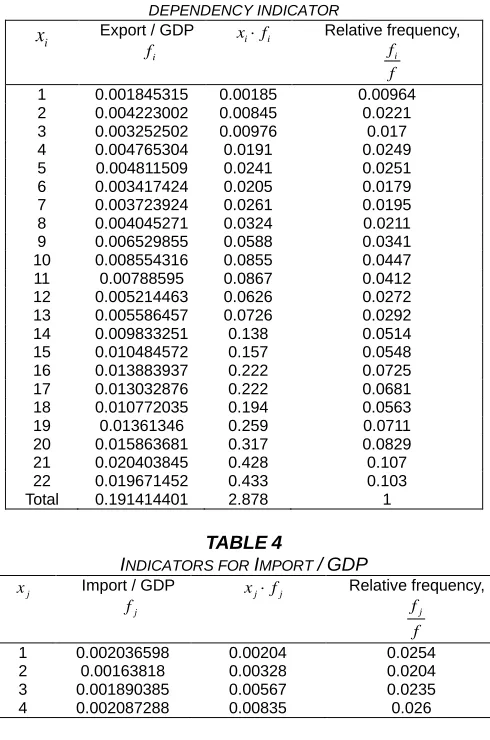
Table 3 presents the calculations for the export dependence of relative frequencies. Table 4 presents the relative frequency calculations for the import dependency indicator. On the basis of the tables 3.4, we calculate the basic numerical characteristics of the indicators of export and import dependence of Ukrainian-Indian foreign trade flows for the period 1996-2017. The characteristics of the situation include: average sample, fashion, median. In addition to the positional characteristics, numerical characteristics are used to judge the scattering of a random variable. These include, in particular, variance and root mean square deviation.
TABLE3
CALCULATION OF RELATIVE FREQUENCIES FOR THE EXPORT DEPENDENCY INDICATOR
i
x Export / GDP
i
f i i
xf Relative frequency,
i
f f 1 0.001845315 0.00185 0.00964 2 0.004223002 0.00845 0.0221 3 0.003252502 0.00976 0.017 4 0.004765304 0.0191 0.0249 5 0.004811509 0.0241 0.0251 6 0.003417424 0.0205 0.0179 7 0.003723924 0.0261 0.0195 8 0.004045271 0.0324 0.0211 9 0.006529855 0.0588 0.0341 10 0.008554316 0.0855 0.0447 11 0.00788595 0.0867 0.0412 12 0.005214463 0.0626 0.0272 13 0.005586457 0.0726 0.0292 14 0.009833251 0.138 0.0514 15 0.010484572 0.157 0.0548 16 0.013883937 0.222 0.0725 17 0.013032876 0.222 0.0681 18 0.010772035 0.194 0.0563 19 0.01361346 0.259 0.0711 20 0.015863681 0.317 0.0829 21 0.020403845 0.428 0.107 22 0.019671452 0.433 0.103
Total 0.191414401 2.878 1
TABLE4
INDICATORS FOR IMPORT /GDP
j
x Import / GDP
j
f j j
x f Relative frequency,
j
f f
1 0.002036598 0.00204 0.0254
2 0.00163818 0.00328 0.0204
3 0.001890385 0.00567 0.0235
4 0.002087288 0.00835 0.026
5 0.002429926 0.0121 0.0303
6 0.002504579 0.015 0.0312
7 0.002602431 0.0182 0.0324
8 0.003071509 0.0246 0.0383
9 0.00358455 0.0323 0.0446
10 0.00373048 0.0373 0.0465
11 0.003412972 0.0375 0.0425
12 0.003257701 0.0391 0.0406
13 0.00361022 0.0469 0.045
14 0.004068162 0.057 0.0507
15 0.005005026 0.0751 0.0623
16 0.004978844 0.0797 0.062
17 0.005806736 0.0987 0.0723
18 0.004574591 0.0823 0.057
19 0.004916561 0.0934 0.0612
20 0.00487372 0.0975 0.0607
21 0.005212094 0.109 0.0649
22 0.005002822 0.11 0.0623
Total 0.080295375 1.085586601 1
Table 5 presents the numerical characteristics of the statistical series of export and import dependence, including the correlation coefficient.
TABLE 5
NUMERICAL CHARACTERISTICS OF FOREIGN TRADE FLOWS
Indicator Export / GDP Import / GDP Weighted
average (sample
average) 2.87871225
0.191414401 15,04
i i i x f x f
1.085586601 0.08029537 13 5 ,52x
Mean linear deviation
0,925
0.191414401 4,83
i i
i
x x f
d f
0, 405 0.080295375 5,04d
Dispersion
26, 445
0,191414401 33,668
i i
i
x x f D f
0,080295375 2,815 35,061D
Mean square
deviation 33,668 5,802
D 35,061 5,921 The coef-ficient of variation 0,3859 V x
V 0, 438
Linear coefficient of variation 0,3212 d Kd x
Kd0,3728
Oscillation
coefficient Kr r 1,3967 x
Kr1,5533
Asymmetry As 0,705 As 0, 405
Excess Ех0, 75 Ех 0,89
Correlation
coefficient xy 0,876
x y
xy x y r
4839 calculated values for the observable criterion for the export
flow are also presented in Table 6.
Find the boundary of the right-hand side critical region Kkr = (0.05; 19) = 30.14353. The observable value of the criterion K = 0.0833 <30.14353.
TABLE6
CALCULATION OF THEORETICAL FREQUENCIES AND CALCULATED
VALUES OF THE OBSERVABLE CRITERION VALUE FOR DIMENSIONLESS EXPORT FLOWS EXPORT /GDP
i
x ui i *
i
f *2
*
i i
i
f f
f
1 -2.4189 0,0213 0.000703 0.00186 2 -2.2466 0,0317 0.00105 0.00965 3 -2.0743 0,0459 0.00151 0.002 4 -1.9019 0,0644 0.00212 0.00328 5 -1.7296 0,0893 0.00295 0.00118 6 -1.5572 0,1182 0.0039 6.0E-5 7 -1.3849 0,1518 0.00501 0.000329 8 -1.2126 0,1895 0.00625 0.000779 9 -1.0402 0,2299 0.00758 0.000147 10 -0.8679 0,2732 0.00901 2.3E-5 11 -0.6955 0,3123 0.0103 0.000567 12 -0.5232 0,3467 0.0114 0.00339 13 -0.3509 0,3739 0.0123 0.00369 14 -0.1785 0,3925 0.0129 0.000749 15 -0.00617 0,3989 0.0132 0.000544
16 0.1662 0,3932 0.013 6.4E-5
17 0.3385 0,3765 0.0124 3.0E-5 18 0.5109 0,3485 0.0115 4.6E-5 19 0.6832 0,3144 0.0104 0.00101 20 0.8555 0,2756 0.00909 0.00504 21 1.0279 0,2347 0.00774 0.0207 22 1.2002 0,1919 0.00633 0.0281
∑ 0.0833
We have that the export dependency sample data have a normal distribution law (Fig. 2).
Fig. 2. Normal law of distribution of the index of export dependence of Ukrainian-Indian foreign trade flows for the
period 1996-2017
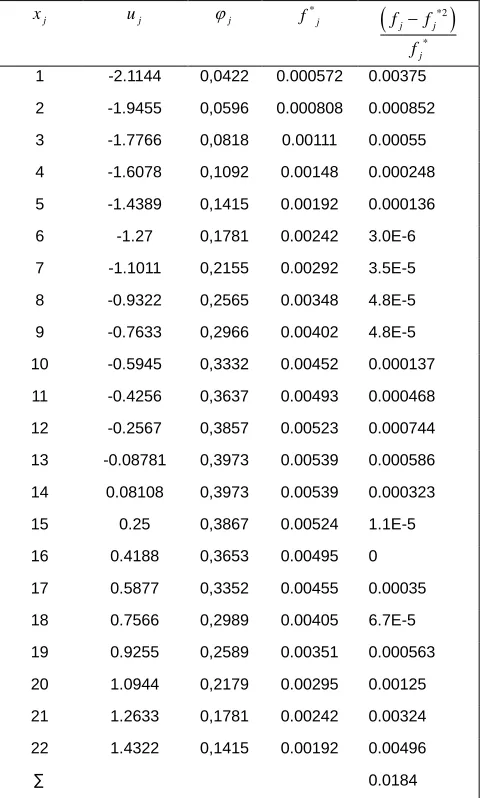
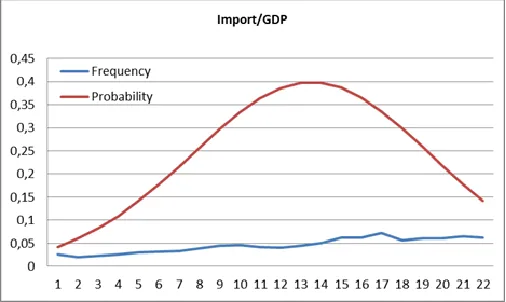
Similarly, let us test the hypothesis of a normal law of distribution of the statistical series of the index of import dependence of Ukrainian-Indian foreign trade flows for the period 1996-2017 Import / GDP using the Pearson criterion (Table 7). We calculate the theoretical frequencies taking into account: σ = 5.921, xср = 13.52 (Table 4) The calculated values for the observable criterion for the import stream are also presented in Table 7.
TABLE6
CALCULATION OF THEORETICAL FREQUENCIES AND CALCULATED
VALUES OF THE OBSERVATION VALUE OF THE CRITERION FOR DIMENSIONLESS IMPORT FLOWS IMPORT /GDP
j
x uj j
*
j
f
*2
*
j j
j
f f
f
1 -2.1144 0,0422 0.000572 0.00375 2 -1.9455 0,0596 0.000808 0.000852 3 -1.7766 0,0818 0.00111 0.00055 4 -1.6078 0,1092 0.00148 0.000248 5 -1.4389 0,1415 0.00192 0.000136 6 -1.27 0,1781 0.00242 3.0E-6 7 -1.1011 0,2155 0.00292 3.5E-5 8 -0.9322 0,2565 0.00348 4.8E-5 9 -0.7633 0,2966 0.00402 4.8E-5 10 -0.5945 0,3332 0.00452 0.000137 11 -0.4256 0,3637 0.00493 0.000468 12 -0.2567 0,3857 0.00523 0.000744 13 -0.08781 0,3973 0.00539 0.000586 14 0.08108 0,3973 0.00539 0.000323 15 0.25 0,3867 0.00524 1.1E-5 16 0.4188 0,3653 0.00495 0 17 0.5877 0,3352 0.00455 0.00035 18 0.7566 0,2989 0.00405 6.7E-5 19 0.9255 0,2589 0.00351 0.000563 20 1.0944 0,2179 0.00295 0.00125 21 1.2633 0,1781 0.00242 0.00324 22 1.4322 0,1415 0.00192 0.00496
∑ 0.0184
Find the boundary of the right-hand side critical region Kkr = (0.05; 19) = 30.14353. The observation value of the criterion K = 0,0184 < 30,14353.
Fig. 3. Normal law of distribution of dimensionless import flow
The differential function (probability density) f (x, y) of a normally distributed two-dimensional random variable (X, Y), (X, Y-compatible and dependent) has the following form [19, 20, 21]:
2 2 2 2 2 ( )1 ( )
2 2 1 2 1 ( , ) 2 1 xy
x x y y
xy
x a x a y b y b r
r
x y xy
f x y e
r
(1)The cross sections of the surface of normal distribution by the planes x = x0 = =const or y = y0 = const are normal curves, and the cross section by planesz2 con st is the equation of the principal scattering ellipse
2 2 22 2xy 2
x x y y
x a x a x b y b
r
(2) the principal axes of which are parallel to the coordinate axes. We find the probability of a normally distributed random variable (X, Y) falling into the range of tolerable risk of export-import flows. Substituting (2) into (1), we define an area D in which compatible dependent random variables have an optimal probability. Specify a confidence probability of 0.95 point (X, Y) in the area D:
2 2 2 2 1 2 1 2 1 2 1 2
0.95 (( , ) ) ( , )
1 2 1 1 . 2 1 xy xy D r
D x y xy
r D
x y xy
P X Y D f x y dxdy
e dxdy r e dxdy r
(3)The double integral of formula (3) is the area of the ellipse,
with half axles
3
x, 3
y. Calculate the area of the ellipse by the formula:
3
x3
y9
x yD
dxdy
(4)
Therefore, given (4), we rewrite (3) as:
2 2 2 2 1 2 1 2 2 1 2 (( , ) ) 1 9 2 1 9 1 0, 95. 2 1 xy xy r x yx y xy
r
xy
P X Y D
e r e r
(5) From equation (5) we find the values
2:
2 2 2
2
r
xy1 ln 0, 211
1
r
xy
(6)
Then with a confidence probability of 0.95 the equation of the scattering ellipse (2) will be:
2
2
2 2
2 2
( ) ( )
2xy 2 xy 1 ln 0, 211 1 xy .
x x y y
x a x a y b y b
r r r
(7)
Thus, we have a two-dimensional probability distribution law for Ukrainian-Indian foreign trade export-import flows in the form of:
2 2 2 2 2 2 1 ,2 5,802 5,921 1 0,876
15,04 15,04 13,52 13,52 1
2 0,597 ,
5,802 5,802 5,921 5,921 2 1 0,876
f x y
x x x y
Ехр
(8)
Or
2 2
1 ,
67,814
15, 04 15, 04 13,52 13,52 1
1, 752 ,
1,949 33, 663 34,354 35, 058
f x y
x x y y
Exp
(9)
Figure 4 shows the surface of export-import Ukrainian-Indian foreign trade flows for the period 1996-2017, given by formula (9).
4841 We find the equation of the main scattering ellipse of the
two-dimensional normal law of distribution of Ukrainian-Indian foreign trade flows for the period 1996-2017 in the form
2 2
15,04 13,52
0,035 15,04 13,52 2, 286
33,663 35,058
x y
x y
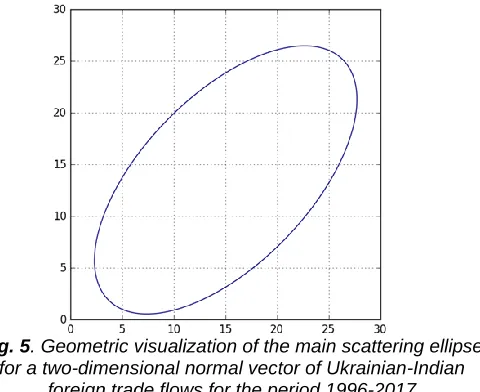
(10) Figure 5 presents the geometric visualization of the main scattering ellipse for the two-dimensional normal law of distribution of Ukrainian-Indian foreign trade flows for the period 1996-2017.
Fig. 5. Geometric visualization of the main scattering ellipse for a two-dimensional normal vector of Ukrainian-Indian
foreign trade flows for the period 1996-2017
The area of the ellipse shown in Figure 5 can be interpreted as the threshold value of Ukrainian-Indian export-import flows for the period 1996-2017 or the region of safe level of operation of Ukrainian-Indian export-import flows.
4 DISCUSSION
In the context of globalization, the need to improve and develop theoretical and methodological approaches and mathematical tools for comparative assessment of the stability of economic development of countries and management of their foreign trade flows, is of scientific interest. The problem of managing the socio-economic development of the state, which includes the formation of concepts of planning and forecasting, as well as mathematical modeling of socio-economic regional systems is urgent. Given that the state socio-economic systems belong to the class of complex dynamic systems, the development of a predictive scenario for the development of such systems is subject to systematic analysis and involves the use of a whole set of models, among which you can distinguish macrostructural models, nonlinear econometric models, as well as complex models of development describing the functioning of different sub-structures of the socio-economic system of the state. Therefore, the subsystem of indicators of foreign economic development (indicators of regional export-import operations and their thresholds) is considered as a component of the level of economic security of the state. The interrelation between foreign trade indicators and the country's economy as a whole necessitates an effective state policy aimed at optimizing all processes and eliminating disparities between levels of socio-economic development of countries.
4
CONCLUSION
The article proposes a method for determining the threshold value of indicators of foreign economic - the area of acceptable risk of economic security indicators of Ukrainian-Indian foreign trade relations as the main scattering ellipse. It is necessary for the analysis and diagnostics of the foreign trade security of the state, which allows purposefully perform the necessary monitoring, systematically analyze the dynamically changing economic situation, and make scientifically sound management decisions.
5
REFERENCES
[1] M. Sehrawat, A.K. GiriFinancial development and economic growth: Empirical evidence from India. Studies in Economics and Finance, 32 (3) (2015), pp. 340-356, 10.1111/j.1467-9361.2008.00427.
[2] Antràs, P. (2016). Global Production. Firms, Contracts, and Trade Structure. Princeton University Press. [3] Krugman P. International economics: Theory and Policy
[Text] / P. Krugman, M. Obstfield, M. 9. Anderson W. All connectedo nove. Vite in Globale Civilizzazione [Text] / W. Anderson. — Westview Press-Roma, 2001. — 310 p.
[4] Scholte J. A. Globalization. A critical introduction [Text] / J. A. Scholte. — London : Palgrave, 2000. — 361 p. [5] Melitz. — [Boston, USA] : Addison-Wesley, 2012. —
685 p.
[6] Yohannes Yebabe Tesfay, Per Bjarte Solibakke. Econometric Modelling of the Variations of Norway’s Export Trade across Continents and over Time: The Two-Stage Non-Full Rank Hierarchical Linear Econometric Model Approach. Economics Research International, Volume 2015, Article ID 791805, http://dx.doi.org/10.1155/2015/791805
[7] R. Smeets, H. Creusen, A. Lejour, and H. Kox, Export Margins and Export Barriers: Uncovering Market Entry Costs of Exporters in the Netherlands, CPB Document No. 208, CPB, The Hague, The Netherlands, 2010, http://works.bepress.com/henk_kox/23/.
[8] H. K Nath, Country Risk Analysis: A Survey, Summer graduate research workshop, 2004. Kassimatis, K. 2002. Financial liberalization and stock market volatility in selected developing countries. Applied Financial Economics 12 (6): 389–94.
[9] Feenstra, R. C. and A. M. Taylor (2012). International Economics. Second edition. Worth.
[10] Karmelyuk, G. Modeling the Impact of Import, Export and Pure Export on Ukraine's External Debt [Text] / Anna Karmelyuk, Svetlana Plaskon, Hristina Karmelyuk // Bulletin of the Ternopil National Economic University. - 2014. - Volume 3. p. 58-76.
[11] Sagathevan Sooriyan. An Econometric Modeling for India’s Imports and exports during 1971-2013. Inter national Journal of Pure and Applied Mathematics. Volume 113 No. 6 2017, 242 – 250
[12] Diebold, F. X. (1998) 'The past, present, and future of macroeconomic forecasting', Journal of Economic Perspectives 12, 2: 175-192.
Kluwer, Boston.
[15] Kimura, F., and H.-H. Lee. 2006. “The Gravity Equation in International Trade in Services.” Review of World Economics, 142(1): 92-121.
[16] Head, K., and T. Mayer. 2014. “Gravity Equations: Workhorse, Toolkit, and Cookbook” in G. Gopinath,E. Helpman, and K. Rogoff (eds.) Handbook of International Economics Vol. IV, Amsterdam: Elsevier. [17] C. R. Rao and S. K. Mitra, Generalized Inverse of
Matrices and Its Applications, John Wiley & Sons, New York, NY, USA, 1971.
[18] Ioana-Veronica ALEXA & Simona-Valeria TOMA, 2012. "The Correlation between Game Theory and International Trade," Economics and Applied Informatics, "Dunarea de Jos" University of Galati, Faculty of Economics and Business Administration, issue 2, pages 67-74.
[19] Bludova Tatiana, Savchuk Natalia. Modeling the economic security of regional external trade flows (IndexCopernicus, Directory of Open Access Journals, ESCI by Web of Science).Baltic Journal of Economic Studies. Vol. 3, No. 5. - December(2017). http://www.baltijapublishing.lv/index.php/issue/article/vie w/262/pdf
[20] Bludova Tatiana, Oksana Fedorova, Tatyana Khudyakova. Regional Trade Flows and the Leading Position of Regions in the Context of Economic Security. (Web of Science) Leadership for the Future Sustainable Development of Business and Education 2017 Prague Institute for Qualification Enhancement (PRIZK) and International Research Centre (IRC) “Scientific Cooperation” International Conference. Editors: Strielkowski, Wadim, Chigisheva, Oksana (Eds.) Springer Proceedings in Business and Economics.
https://link.springer.com/chapter/10.1007%2F978-3-319-74216-8_30