Committee
Abstract
The annual survey ofThe Japanese Society for Dialysis TherapyRenal Data Registry (JRDR) was conducted for 4396
dialysis facilities at the end of 2016, among which 4336 facilities (98.6%) responded. The response rate of the 2016 survey was comparable with the past, even though it was the second year after the new anonymization method. The number of chronic dialysis patients in Japan continues to increase every year; it has reached 329,609 at the end of 2016. The mean age was 68.15 years. The prevalence rate was 2597 patients per million population. Diabetic nephropathy was the most common primary disease among the prevalent dialysis patients (38.8%), followed by chronic glomerulonephritis (28.8%) and nephrosclerosis (9.9%). The rate of diabetic nephropathy and nephrosclerosis has been increasing year by year, whereas that of chronic glomerulonephritis was declining. The number of incident dialysis patients during 2016 was 39,344; it has remained stable since 2008. The average age was 69.40 years, and diabetic nephropathy (43.2%) was the most common cause in the incident dialysis patients. These patients caused by diabetes did not change in number for recent several years. Thirty-one thousand six hundred eight patients died in 2016; the crude mortality rate was 9.7%. The patients treated by hemodiafiltration (HDF) have been increasing rapidly from the revision of medical reimbursement for HDF therapy in 2012. It has attained 76,836 patients at the end of 2016, which were 21,503 greater than that in 2015. The number of peritoneal dialysis (PD) patients was 9021 in 2016, which had been slightly decreasing since 2014; 20.3% of PD patients treated in the combination of hemodialysis (HD) or HDF therapy. Six hundred thirty-five patients were treated by home HD therapy at the end of 2016; it increased by 63 from 2015.
Trial registration:JRDR was approved by the ethical committee of JSDT and has been registered in“University
hospital Medical Information Network (UMIN) Clinical Trials Registry”as an approved number ofUMIN000018641
on August 8, 2015.
Part I. JRDR 2016 annual data report: general remarks
Introduction
The Japanese Society for Dialysis Therapy (JSDT) has been conducting a survey on the status of chronic dialy-sis therapy in Japan at the end of every year since 1968; this survey, known as the JSDT Renal Data Registry (JRDR), covers almost all dialysis facilities throughout
the country [1, 2]. Although participating facilities are not compensated, the nearly 100% response rate means that the JSDR is largely complete and literally unbiased representation of the status of chronic dialysis in Japan, making it rather rare in the world.
Until the 2013 JRDR results were reported, there were two types of JRDR reports: prompt (unfixed) data of col-lected results reported at the annual meeting of the JSDT held every June and defined (fixed) data subjected to subsequent data cleaning. The prompt (unfixed) data were used to prepare “An Overview of Regular Dialysis Treatment in Japan, the Illustrated Report,” which was distributed at the annual meeting. The defined (fixed) * Correspondence:imasakan.aipod@seieig.or.jp
1Japanese Society for Dialysis Therapy Renal Data Registry Committee,
Japanese Society for Dialysis Therapy, Tokyo, Japan
2Department Nephrology, Honcho Yabuki Clinic, 1-6-17 Honcho, Yamagata,
Yamagata 990-0043, Japan
data were used to produce “An Overview of Regular Dialysis Treatment in Japan, the CD-ROM Report,” which was distributed at the end of the year to all member facilities of the JSDT or other facilities that participated in the JRDR. In addition, a status report for the second preceding year was prepared from the defined (fixed) data and published every January in Journal of the Japanese Society for Dialysis Therapy. The results in this report served as the society’s offi-cial numbers, although the numbers in the Illustrated Report were cited far more often in various settings. In addition, in the 2010s, the increase in the number of dialysis patients has slowed; in fact, the number is predicted to begin decreasing within a few years [3]. This meant that the defined (fixed) data would some-times indicate that the numbers of dialysis patients were still increasing even if they had decreased in the prompt (unfixed) data, which could easily cause major confusion. Thus, starting with the 2014 JRDR results, the production of the Illustrated Report from the
prompt (unfixed) data was discontinued, and both the Illustrated Report and CD-ROM are now prepared from the defined (fixed) data instead [4]. The Illus-trated Report is now distributed at the end of the year to each dialysis facility, with the CD-ROM in-cluded in its back cover. (For reasons relating to ad-ministrative procedures, “An Overview of Regular Dialysis Treatment in Japan, the CD-ROM Report” for 2016 was sent separately.)
In December 2014, the Ethical Guidelines for Medical and Health Research Involving Human Subjects, which was issued by the Ministry of Health, Labour and Wel-fare and the Ministry of Education, Culture, Sports, Sci-ence, and Technology, demanded that all academic societies strictly follow ethical considerations and pro-tect personal information in epidemiological research [5]. The JSDT has also changed its survey methods based on these guidelines; starting with the 2015 JRDR, anonymity has been enhanced to ensure the protection of personal information. Furthermore, the JRDR was
Table 1Summary of chronic dialysis therapy in Japan, 2016
Number of surveyed facilities 4396 facilities (Increase of 16 facilities, 0.4% increase)
Number of responded facilities 4336 facilities (Increase of 15 facilities, 0.3% increase)
Capacity Number of bedside consoles 135,211 units (Increase of 1673 units, 1.3% increase)
Capacity for simultaneous HD treatments 133,500 treatments (Increase of 1986 patients, 1.5% increase)
Maximum capacity 444,192 patients (Increase of 5801 patients, 1.3% increase)
Prevalent dialysis patients 329,609 patients (Increase of 4623 patients, 1.4% increase)
Outpatients Inpatients Total
Hemodialysis Hemodialysis (HD) 215,858 (72.1) 25,827 (85.3) 241,685 (73.3)
Hemodiafiltration (HDF) 72,959 (24.4) 3877 (12.8) 76,836 (23.3)
Hemofiltration (HF) 19 (0.0) 7 (0.0) 26 (0.0)
Blood adsorption dialysis 1360 (0.5) 46 (0.2) 1406 (0.4)
Home hemodialysis 633 (0.2) 2 (0.0) 635 (0.2)
Peritoneal dialysis (PD) PD only 6722 (2.2) 468 (1.5) 7190 (2.2)
PD + HD 1/week 1521 (0.5) 39 (0.1) 1560 (0.5)
PD + HD 2/week 165 (0.1) 4 (0.0) 169 (0.1)
PD + HD 3/week 33 (0.0) 5 (0.0) 38 (0.0)
PD + HD other frequencies 61 (0.0) 3 (0.0) 64 (0.0)
Subtotal 8502 (2.8) 519 (1.7) 9021 (2.7)
Total 299,331 (100.0) 30,278 (100.0) 329,609 (100.0)
Per million of general population 2596.7 patients (Increase of 39.7 patients)
Patients count in the night shift 32,431 patients
Incident dialysis patients 39,344 patients (Decrease of 118 patients, 0.3% decrease)
Incident hemodialysis patients (including HDF) 37,398 patients
Incident peritoneal dialysis patients 1946 patients
Deceased patients 31,790 patients (Increase of 722 patients, 2.3% increase)
The above data were obtained from the facility survey
PD + HD patientspatients treated by the combination of PD and HD, HDF, hemoadsorption, or hemofiltration (excluding those who underwent only
peritoneal lavage)
reviewed in March 2015 by an ethics committee (JSDT Ethics Committee approval no. 1) to ensure ethical val-idity, fairness, and transparency of the survey. Following the conclusion of the abovementioned ethics review, the revised survey methods were then published in the UMIN (University hospital Medical Information Net-work) Clinical Trials Registry (UMIN000018641), and the review results were posted on the JSDT website [6]. Enhanced anonymization consisted of a system wherein patient information was converted to a random string of alphanumeric characters using a special algorithm, and the correspondence tables for retrieving the real names
of patients were held by dialysis facilities; hence, even the JSDT main office could not retrieve patient informa-tion. The 2016 JRDR, which represented the second year of complete anonymization, involved two major issues: whether the facilities would be able to properly retrieve the anonymously distributed data and whether the secre-tariat would be able to properly compare the anon-ymized 2015 and 2016 data. Fortunately, the response rate was nearly identical to that in previous years, and we were able to publish the Illustrated Report and this An-nual Report just as in previous years. We were reminded of the sincere attitude toward dialysis treatment exhibited Fig. 1Changes in the number of prevalent dialysis patients, 1968–2016. *The low response rate in 1989 caused a dip in patient numbers
Table 3Adjusted prevalent dialysis patient counts (pmp), 1983–2016
1983 1984 1985 1986 1987 1988 1989 1990 1991 1992 1993 1994 1995 1996 1997 1998 1999
Adjusted prevalent dialysis patients (pmp)
443.7 497.5 547.8 604.4 658.8 721.1 790.0 835.7 937.6 995.8 1076.4 1149.4 1229.7 1328.4 1394.9 1465.2 1556.7
Year/year – 53.8 50.3 56.6 54.4 62.3 68.9 45.7 101.9 58.2 80.6 73.0 80.3 98.7 66.5 70.3 91.5
2000 2001 2002 2003 2004 2005 2006 2007 2008 2009 2010 2011 2012 2013 2014 2015 2016
Adjusted prevalent dialysis patients (pmp)
1624.1 1721.9 1801.2 1862.7 1943.5 2017.6 2069.9 2154.2 2219.6 2279.5 2329.1 2385.4 2431.1 2470.1 2521.6 2557.0 2596.7
Year/year 67.4 97.8 79.3 61.5 80.8 74.1 52.3 84.3 65.4 59.9 49.6 56.3 45.7 39.0 51.5 35.4 39.7
The low response rate in 1989 caused a dip in facility or dialysis machine numbers. The above data were obtained from the patient survey Abbreviations:pmpper million population,year/yearcompared with the previous year
containing facility surveys and patient surveys (the latter of which contained anonymized patient information) prepared in Excel were mailed to dialysis facilities throughout Japan in December 2016. The patient sur-veys included patient information that had been regis-tered in the previous year and anonymized using the method adopted in the previous year. Each dialysis facil-ity used a USB flash drive containing correspondence ta-bles that had been mailed to them in 2015 in order to retrieve the patients’real names so that data such as the survival, death, or transfer of patients could be updated. Furthermore, new patients were registered, and the USB flash drive with the correspondence table was once again used to anonymize the information once entries for all patients were complete. After the anonymization, patient information in the surveys (name, sex, date of birth, etc.) was converted into random strings of alphanumeric characters of a fixed length. Each dialysis facility returned only the USB flash drive with the survey to the
The items listed below were investigated in the 2016 JRDR. As described above, the 2016 JRDR was the sec-ond survey to incorporate enhanced anonymization. Hence, new topical survey items were not incorporated, and the contents were nearly identical to those of the 2014 and 2015 JRDR. In addition, all survey items used until 2016 are included in the members-only pages of the JSDT website (http://www.jsdt.or.jp/).
Facility survey
1. Overview and scope of facilities
Name and contact numbers (TEL, FAX) of facility, as well as the year and month when the facility started providing dialysis treatment Dialysis capabilities: Capacity for simultaneous
hemodialysis (HD) treatments, maximum capacity for HD treatments, and number of dialysis consoles
Table 4 Prevalent dialysis patient counts, by modality and prefecture, 2016 Pref ecture Nu mber of sur veyed faci lities Nu mber of res ponded faci lities Hem odialysis Pe ritoneal dia lysis Total Pe r mi llion of general po pulation Hem odialysis Hemo diafiltration Hem ofiltration Blood ads orption filtrat ion Home hemodi alysis PD onl y PD + HD 1/week PD + HD 2/week PD + HD 3/week PD + HD othe r frequencies Hokkai do 26 0 25 7 10 ,494 4489 0 77 9 263 91 6 2 1 15,432 28 83.4 Aomor i 40 40 21 70 1317 0 3 2 54 11 1 0 1 3559 27 52.5 Iwate 44 44 27 47 255 0 15 0 86 9000 3112 24 54.3 Miya gi 60 60 43 18 1155 0 24 0 40 8210 5548 23 81.1 Akita 43 43 15 58 510 0 5 2 62 3200 2142 21 20.8 Yamagata 36 36 17 84 753 0 5 13 43 10 6 1 1 2616 23 50.4 Fukushi ma 66 64 37 13 1074 0 12 0 94 34 5 1 0 4933 25 95.0 Ibaraki 87 87 61 87 1580 0 80 11 64 16 0 4 0 7942 27 33.9 Tochig i 78 77 49 85 1011 0 12 2 87 11 0 0 1 6109 31 07.3 Gunma 64 64 44 78 1372 0 2 14 45 15 0 0 0 5926 30 12.7 Saita ma 18 9 18 8 12 ,424 5008 1 59 72 237 72 9 1 0 17,883 24 53.4 Chib a 15 2 14 7 10 ,621 3899 0 33 9 183 64 4 2 2 14,817 23 76.0 Toky o 42 7 42 1 21 ,609 8519 8 156 87 797 249 14 3 12 31,454 23 08.7 Kanagawa 26 0 25 7 15 ,607 4516 0 73 31 557 63 2 1 0 20,850 22 79.9 Niiga ta 55 54 43 98 543 0 23 1 119 18 0 0 1 5103 22 32.3 Toyam a 42 42 20 05 432 0 12 2 85 19 5 0 0 2560 24 12.8 Ishikawa 38 38 22 03 378 0 22 4 68 8000 2683 23 31.0 Fukui 25 24 11 68 491 0 6 3 77 20 7 2 1 1775 22 69.8 Yaman ashi 32 31 14 51 629 0 3 2 42 14 1 0 1 2143 25 81.9 Nagan o 73 72 34 60 1661 2 12 12 91 17 5 0 0 5260 25 19.2 Gifu 71 71 40 95 779 0 32 24 82 9200 5023 24 84.2 Shizuo ka 12 6 12 5 73 47 3306 0 35 16 115 23 3 3 1 10,849 29 41.7 Aichi 19 5 19 5 14 ,501 2935 0 93 48 582 89 3 0 0 18,251 24 31.2 Mie 53 50 36 55 437 0 26 5 57 16 0 0 0 4196 23 20.8 Shiga 40 40 23 56 634 0 15 30 120 27 0 1 0 3183 22 52.7 Kyoto 80 79 48 50 1397 1 53 12 161 65 3 0 2 6544 25 12.1 Osaka 31 7 31 4 17 ,479 5213 0 140 43 472 98 9 2 2 23,458 26 55.7 Hyog o 19 9 19 2 96 79 3643 1 91 68 137 37 13 2 1 13,672 24 76.8 Nara 46 45 23 73 905 1 30 6 115 41 2 1 1 3475 25 62.7 Wakayam a 48 48 25 60 408 0 14 23 38 4001 3048 31 95.0
Number of workers involved in dialysis treatment (e.g., doctors, nurses, clinical engineers, nutritionists, case workers)
Number of medical dialysis specialists qualified by JSDT
2. Patient dynamics
Number of prevalent dialysis patients at end of 2016 (number of patients by treatment modality, inpatient/outpatient)
Number of dialysis patients undergoing nighttime dialysis in 2016
Number of incident dialysis patients in 2016 (number of incident HD(F) and PD patients) Number of deceased patients during 2016 3. Dialysis fluid quality management
Use of endotoxin retentive filter (ETRF) Dialysis fluid sampling status and sampling site
of dialysis fluid during testing
Frequency for measuring endotoxin (ET) concentration in dialysis fluid and ET concentration in dialysis fluid
Frequency for measuring total viable microbial count (TVC) in dialysis fluid, sampling volume for TVC, cultivation medium for TVC, and TVC in dialysis fluid
Patient survey
1. Patient personal information
Sex, date of birth, year and month of start of dialysis, year and month of transfer from another hospital, primary disease, residence (prefecture),
dialysis modality, month of transfer (destination facility code), outcome category, outcome date (transfer, death, dropout, or transplantation) (destination facility code), month of death, cause of death, dates of changes, change codes, status of combined therapies involving PD with HD or HDF, etc., PD experience, and number of kidney transplants
2. HD/HDF therapy conditions
Frequency of dialysis session per week, dialysis time per session, and blood flow rate
HDF: dilution methods, substitution fluid volume per session
Body height, pre- and post-dialysis body weight, pre-dialysis systolic blood pressure, pre-dialysis diastolic blood pressure, and pre-dialysis pulse rate 3. Laboratory findings
Pre- and post-dialysis serum urea nitrogen (UN), pre- and post-dialysis serum creatinine concentration, pre-dialysis serum albumin concentration, pre-dialysis serum C-reactive protein (CRP) concentration, pre-dialysis serum calcium concentration, pre-dialysis serum phosphorus concentration, serum parathyroid hormone (PTH) assay method, PTH level (intact or whole PTH), pre-dialysis hemoglobin concentration, serum total cholesterol concentration (total cholesterol), and serum high-density-lipoprotein-cholesterol concentration (HDL-C)
4. Outcome factors
Table 5Average age of prevalent dialysis patients, 1983–2016
1983 1984 1985 1986 1987 1988 1989 1990 1991 1992 1993 1994 1995 1996 1997 1998 1999
Mean age of the prevalent dialysis patients
48.3 49.2 50.3 51.1 52.1 52.9 53.8 54.5 55.3 56.0 56.6 57.3 58.0 58.6 59.2 59.9 60.6
2000 2001 2002 2003 2004 2005 2006 2007 2008 2009 2010 2011 2012 2013 2014 2015 2016
Mean age of the prevalent dialysis patients
61.2 61.6 62.2 62.8 63.3 63.9 64.4 64.9 65.3 65.8 66.2 66.6 66.9 67.2 67.5 67.9 68.2
The above data were obtained from the patient survey
Fig. 3Prevalent dialysis patient distribution, by age and sex, 2016
Antihypertensive drug use, smoking, history of diabetes, history of myocardial infarction, history of cerebral hemorrhage, history of cerebral infarction, limb amputation, history of proximal femur fracture, history of encapsulating
peritoneal sclerosis (EPS) 5. Peritoneal dialysis (PD) survey
Therapeutic history: Current PD dialysis vintage, number of months in which PD was performed in 2016
Peritoneal function: Implementation of
peritoneal equilibration test (PET), 4-h creatinine concentration dialysate/plasma ratio in PET (PET Cr D/P ratio)
Fig. 4Prevalent dialysis patient distribution, by age, 1982–2016
Dialysis prescription: Type of PD fluid, volume of PD fluid per day, PD treatment time per day, daily urine volume, mean fluid removal volume per day,Kt/Vby residual kidney function (residual kidneyKt/V),Kt/Vby PD (PDKt/V) Dialysis method: Use of automated peritoneal dialysis
(APD) machine, changing maneuver of PD fluid Infectious disease: Numbers of peritonitis during
2016 (peritonitis frequency), numbers of exit-site infections during 2016
Methods for publishing JRDR results and an overview of this report
Until the 2013 edition, the JRDR annual report was pub-lished in Japanese in every January issue of the Journal of the Japanese Society for Dialysis Therapy, and a trans-lated version was published in Therapeutic Apheresis and Dialysis(TAD). In TAD, survey results were mostly reported in tables owing to page limitations, whereas the Illustrated Report, as per its name, provided an explan-ation through figures. PDFs of TAD papers and the Fig. 6Prevalent dialysis patient distribution, by dialysis vintage, 1988–2016
Fig. 7Prevalent dialysis patient distribution, by primary disease and sex, 2016. Abbreviations: PIH pregnancy-induced hypertension, PKD polycystic kidney disease, RPGN rapidly progressive glomerulonephritis
Illustrated Reports, as well as their figures (in the form of PowerPoint files), can be downloaded from the JSDT website. However, the figures in the Illus-trated Reports were used more often. In contrast, countries other than Japan have been requesting that the results of the JRDR be published in a form that people worldwide may easily use. Because of such cir-cumstances, the English-language annual report has been published in Renal Replacement Therapy (RRT) since the report for 2014 [7, 8]. We expect that the PDF of the English-language annual report, an English translation of the figures as a PowerPoint file, and an Excel file of the tables, will be available to the world from the English-language website of the JSDT.
Part II. JRDR 2016 annual data report: results and discussion
Chapter 1: Basic demographics Facility dynamics
The 2016 JRDR annual survey was conducted at 4396 fa-cilities nationwide, and responses were obtained from 4336 facilities. The number of responding facilities de-creased in 2015 (by 9 facilities, or −0.2%) but increased again in 2016 (by 15 facilities, or + 0.3%). Although these are strictly numbers of responses rather than response rates, there was a concern that the enhanced anonymiza-tion and accompanying discontinuaanonymiza-tion of paper-based surveys starting from the 2015 JRDR would result in a de-creased response rate and the consequent underestimation Fig. 8Prevalent dialysis patient distribution, by primary disease, 1983–2016. Abbreviations: PKD polycystic kidney disease, RPGN rapidly progressive glomerulonephritis
of the number of dialysis facilities and patients. However, the response rate for facility surveys was 98.6%, whereas pa-tient surveys were able to be collected from 95.2% of all fa-cilities; thus, the response rates were nearly identical to those from previous years. Therefore, a decrease in the number of facilities responding to the surveys does not ne-cessarily mean a substantial decrease in the actual number of dialysis facilities. However, the increase in the number of dialysis patients has recently slowed, and future trends are therefore being noted (Table 1). The 4336 facilities that responded had 135,211 dialysis consoles (an increase of 1673 from the previous year), a simultaneous dialysis ment capacity of 133,500, and a maximum dialysis treat-ment capacity of 444,192. Compared to the figures at the end of 2015, these figures represented increases of 1.3, 1.5, and 1.3%, respectively (Tables1and2).
Patient dynamics
Based on the facility surveys, a total of 329,608 patients were undergoing chronic dialysis therapy at the end of 2016; this number represents the prevalence of chronic kidney disease patients on dialysis therapy. The number of dialysis patients increased by approximately 10,000 annually through 2005, but this rate of increase has been slowing in recent years. At the end of 2014, the number of dialysis patients had increased by 6010 from the pre-vious year; the number had increased by 4538 at the end of 2015 and by 4623 in 2016 (Fig. 1, Additional file 1: Table S1). In the figure, the decrease in the number of
patients at the end of 1989 is the apparent effect of the unusually low 86% survey response rate that year [2]. In 2012, Nakai et al. [3] predicted that the number of fu-ture dialysis patients would decrease after reaching a peak of approximately 348,000 in 2021. The number of dialysis patients per million of the Japanese population is 2596.7, an increase of 39.7 patients from the previous year; this finding means that there is 1 dialysis patient per 385.1 Japanese citizens (Table 3). The population of Japan has been decreasing since 2011; thus, the percent-age of dialysis patients in the population has increased yearly. According to the United States Renal Data Sys-tem, Taiwan has the highest number of dialysis patients per million population worldwide, followed by Japan [9]. Meanwhile, the count of incident dialysis patients repre-sents the incidence of chronic kidney disease patients on dialysis therapy. Although the count of incident dialysis patients showed an upward trend until 2008, it began to decrease in 2009. Since then, faint fluctuations in the pa-tient count have been observed, although the rate has remained largely constant. However, the count of inci-dent dialysis patients in 2015 increased by 1135 from the previous year to 39,462, exceeding 39,000 patients for the first time, and stood at 39,344 in 2016 (Fig. 2, Additional file2: Table S2). In contrast, the annual count of deceased patients increased every year until 2011 but has since remained mostly constant. In 2015, the deceased patient count was 31,068 and that in 2016 was 31,790 (Fig. 2, Additional file 2: Table S2). In general, Fig. 10Major causes of death, 1983–2016
Table 6Annual crude death rate, 1983–2016
1983 1984 1985 1986 1987 1988 1989 1990 1991 1992 1993 1994 1995 1996 1997 1998 1999
Crude death rate (%) 9.0 8.9 9.1 9.0 8.5 9.2 7.9 9.6 8.9 9.7 9.4 9.5 9.7 9.4 9.4 9.2 9.7
2000 2001 2002 2003 2004 2005 2006 2007 2008 2009 2010 2011 2012 2013 2014 2015 2016
Crude death rate (%) 9.2 9.3 9.2 9.3 9.4 9.5 9.2 9.4 9.8 9.6 9.8 10.2 10.0 9.8 9.7 9.6 9.7
The above data were obtained from the patient survey
the number of patients in a given year should be equal to the number of patients in the previous year plus the incident patient count minus the deceased patient count. However, patients who discontinue dialysis because of a transplant are not counted; in addition, the deceased pa-tient count could be underestimated, whereas the inci-dent patient count could be overestimated. Thus, the numbers do not add up exactly.
Patient count by dialysis modality and prefecture
Starting with the 2015 JRDR, the tabulation method was changed to a method focusing on modalities such as HDF, the use of which has been increasing rapidly. The percentage of each modality was 73.3% for HD, 23.3% for HDF, 0.4% for hemofiltration (HF) and hemoadsorp-tion dialysis, 2.7% for PD, and 0.2% for home hemodialysis (HHD) (Table 1). The total percentage of home dialysis (PD plus HHD) in Japan is 2.9%, which is the lowest in the developed world [9]. The use of HDF, particularly on-line HDF, has dramatically increased since the 2012 revision of the medical reimbursement system; the total number of patients using HDF at the end of 2016 was 76,836, an increase of 21,503 from 2015. The number of PD patients was 9021, which rep-resented a decrease of about 300 from 9322 patients in 2015. About 20.3% PD patients underwent combined therapy with HD, and this percentage has remained largely constant for the past 5 years. The number of HHD patients was 635, which was 63 patients more than that in 2015; although this represents a large rate of
increase, the percentage of HHD among all modalities remains small. The number of nighttime dialysis patients was approximately 41,000–42,000 until the 2014 JRDR, but it decreased to 33,370 in 2015 and to 32,431 in 2016. This decrease may have been due to the addition of“Dialysis during hours recognized by insurance (start-ing after 5:00 pm or end(start-ing after 9:00 pm)”to the defin-ition of nighttime dialysis in the 2015 JRDR. The total count of incident dialysis patients was 39,344; of these patients, 95.1% began HD or similar modalities, whereas 4.9% began PD (a decrease from 5.6% in 2015).
Until 2014, the numbers of chronic dialysis patients by prefecture were categorized by daytime dialysis, night-time dialysis, HHD, and PD. However, since the 2015 JRDR, the numbers of chronic dialysis patients by pre-fecture are now tabulated by detailed modality.
The tabulation of prefectures represents the locations of the facilities rather than those of the patients and thus does not strictly represent patient dynamics by prefec-ture. There are pronounced differences between regions in the number of patients per modality and per million in the population [10]. These regional differences arise from a massive number of factors that are interrelated in a complex manner; therefore, comparisons of prefec-tures require great care (Table4).
Age, sex, and dialysis vintage of prevalent patients at the end of 2016
In the patient survey, the count of prevalent dialysis patients at the end of 2016 (specifically, the number Fig. 11Incident dialysis patient distribution, by age and sex, 2016
Table 7Average age of incident dialysis patients, 1983–2016
1983 1984 1985 1986 1987 1988 1989 1990 1991 1992 1993 1994 1995 1996 1997 1998 1999
Mean age of the incident dialysis patients
51.9 53.2 54.4 55.1 55.9 56.9 57.4 58.1 58.1 59.5 59.8 60.4 61.0 61.5 62.2 62.7 63.4
2000 2001 2002 2003 2004 2005 2006 2007 2008 2009 2010 2011 2012 2013 2014 2015 2016
Mean age of the incident dialysis patients
63.8 64.2 64.7 65.4 65.8 66.2 66.4 66.8 67.2 67.3 67.8 67.8 68.4 68.7 69.0 69.2 69.4
of patients for whom age and sex data were listed) was 319,107; this number is 10,502 patients fewer than, or 96.8% of, the count of 329,609 from the facility sur-veys. The mean age of the prevalent dialysis patients was 68.15 years, which was 0.29 years higher than that in the previous year (Table 5). The mean age of men was 67.34 years, a 0.27-year increase, whereas the mean age of women was 69.61 years, a 0.33-year in-crease (Fig. 3, Additional file 3: Table S3). The most common age range for both men and women was 65– 69 years.
The number of patients younger than 65 years has been decreasing since 2012, reflecting an increase in age among incident patients. In other words, the increase in chronic dialysis patients in Japan is the result of an in-crease in patients aged 65 years and older. The percent-age of old-old patients (75 years and older) also increased; there were 6095 dialysis patients aged 90 years and older (Fig.4, Additional file4: Table S4).
Comparisons of the dialysis vintages of prevalent pa-tients at the end of 2016 by 5-year segments showed that 47.3% of all patients had a dialysis vintage of < 5 years, Fig. 12Incident dialysis patient distribution, by primary disease and sex, 2016. Abbreviations: PIH pregnancy-induced hypertension, PKD polycystic kidney disease, RPGN rapidly progressive glomerulonephritis
Fig. 13Incident dialysis patient distribution, by primary disease, 1983–2016. Abbreviations: PKD polycystic kidney disease, RPGN rapidly progressive glomerulonephritis
whereas 26,313 patients had a dialysis vintage of at least 20 years, representing an increase of 922 patients (8.3% of all patients) over the previous year. There were 793 patients (0.2% of all patients) with a dialysis vintage of 40 years or longer (Fig. 5, Additional file 5: Table S5). The longest dialysis vintage was 48 years and 4 months.
In all dialysis vintage segments, there were more men in terms of absolute numbers; however, the difference became smaller as the dialysis vintage lengthened. Chronic dialysis therapy was first covered by insurance in Japan in 1967; the effects of this coverage and of dif-ferences in natural history are thought to result in fluc-tuations in the male/female ratio. The percentage of patients with vintages < 5 years has gradually decreased
every year, whereas the number of patients with long vintages has been increasing; the percentage of patients with vintages of at least 10 years has reached 27.9%. Pa-tients with vintages of 20 years or longer accounted for < 1% of all patients at the end of 1992, but reached 8.3% at the end of 2016 (Fig.6, Additional file6: Table S6).
Primary diseases in prevalent patients at the end of 2016 The most common primary disease in prevalent dialy-sis patients at the end of 2016 was diabetic nephropa-thy, followed by chronic glomerulonephritis and nephrosclerosis (38.8, 28.8, and 9.9%, respectively). However, 9.8% had an unknown primary disease (Fig.7, Additional file7: Table S7).
Fig. 14Incident dialysis patient distribution, by cause of death and sex, 2016
Diabetic nephropathy, which continued to increase in prevalence, is now the most common primary disease since supplanting chronic glomerulonephritis in the 2011 JRDR. Although the prevalence of diabetic nephropathy has continued to increase since 2011, the pace of this in-crease has slowed somewhat in recent years (Fig. 8, Additional file 8: Table S8). The percentage of chronic glomerulonephritis has been decreasing linearly, whereas the percentages of nephrosclerosis and unknown primary disease have continued to increase. In addition, the per-centages of primary diseases such as polycystic kidney dis-ease, chronic pyelonephritis, lupus nephritis, and rapidly progressive glomerulonephritis have remained at approxi-mately the same levels as in previous years.
Causes of death among deceased patients in 2016
In the 2016 facility survey, 31,790 deaths were reported; among these, the sex of the patients and the cause of death were listed in the patient survey for 30,638 pa-tients (96.4%). Among men, the most common cause of death was heart failure (25.1%), followed by infectious disease (22.5%), malignant tumor (10.6%), and cerebro-vascular disease (6.3%). Among women, the most com-mon cause of death was heart failure (26.9%), followed by infectious disease (20.8%), malignant tumor (7.9%), and cerebrovascular disease (6.8%). For women, the ranking positions of malignant tumor and cerebrovascu-lar disease were switched from those in 2015. Among all deceased patients, the most common cause of death was Fig. 16Facility distribution, by endotoxin measurement frequency, 2016
Fig. 17Facility distribution, by endotoxin concentration, 2016
heart failure (25.7%), followed by infectious disease (21.9%), malignant tumor (9.7%), and cerebrovascular disease (6.5%). The orders of causes of death by sex and for all patients were unchanged from those in 2015. Car-diovascular disease (heart failure, cerebrovascular dis-ease, and myocardial infarction) accounted for 35.6% of deaths among men, 37.1% among women, and 36.2% overall (Fig.9, Additional file9: Table S9).
Concerning changes in the overall causes of death over time, the most common cause of death is heart failure, which has accounted for 26–27% of deaths in the past several years. Death due to infectious disease had been consistently increasing since around 1993 but decreased by 0.2 percentage points from 2015 to 2016. Cerebrovascular disease has been consistently
gradually decreasing since 1994. Recently, myocardial infarction-related deaths have tended to gradually de-crease since peaking at 8.4% in 1997. Deaths due to malignant tumors have gradually increased from a low of 5.8% at the end of 1987 but have remained at 9–10% since reaching that point in 2004. Cardiovas-cular disease (heart failure, cerebrovasCardiovas-cular disease, and myocardial infarction) accounted for 54.8% of deaths in 1988; however, this figure has been decreas-ing at a nearly constant pace, reachdecreas-ing 36.1% in 2016 (Fig. 10, Additional file 10: Table S10). The cause-of-death category codes in the JRDR were substan-tially revised in the 2003 and 2010 surveys. Please refer to the 2010 JRDR report for the details of these revisions [11].
Fig. 18Facility distribution, by endotoxin measurement frequency, 2006–2016
Crude death rate
We calculated the annual crude death rate based on the patient dynamics in the facility survey, as follows:
Crude death rate
¼number of deaths= previous year patient count þsurvey year patient count=2100ð Þ%:
Because incident patients increased in age and in-cluded greater numbers of patients with poor prognosis owing to increases in diabetic nephropathy, nephro-sclerosis, and similar diseases, the crude death rate has tended to worsen every year. The lowest crude death rate was 7.9% in 1989, a year with a low survey response rate. However, the crude death rate has remained at 9.2– 10.2% since 1992, when it reached 9.7% and thus
exceeded 9% for the first time; in 2016, the crude death rate was 9.7% (Table 6).
Chapter 2: 2016 incident dialysis patient dynamics Age, sex, and dialysis vintage of incident patients in 2016 In the 2016 patient survey, the count of incident dia-lysis patients with confirmed age and sex was 37,250, which is 2094 patients fewer than, or 94.7% of, the 39,344 patients noted in the facility survey. There were 25,506 men and 11,744 women; as in the previ-ous year, there were approximately twice as many men as women. The mean age of all incident patients was 69.40 years, a 0.20-year increase from the mean age of 69.20 years at the end of 2015. The mean age of men and women was 68.57 and 71.19 years, re-spectively, which represent increases of 0.20 and Fig. 20Facility distribution, by TVC measurement frequency, 2016. Abbreviation: TVC total viable microbial count
Fig. 21Facility distribution, by TVC, 2016. Abbreviation. TVC total viable microbial count
0.24 years from the previous year, respectively. The most common 5-year age groups among incident pa-tients were 65–69 years for men and 80–84 years for women. Old-old patients (75 years and older) accounted for 47.2% of women and 37.3% of men (Fig. 11, Additional file 11: Table S11).
The mean age of incident dialysis patients has been increasing nearly linearly each year, but the rate of increase has been slowing. The mean age of incident patients in 2016 was 69.4 years, which is 0.2 years higher than that in the previous year (Table 7).
Primary diseases of incident patients in 2016
The most prevalent primary disease among incident dialy-sis patients in 2016 was diabetic nephropathy, (43.2% of patients), followed by chronic glomerulonephritis (16.6%) and nephrosclerosis (14.2%); the primary disease was un-known for 12.8% of patients. The prevalence of diabetic nephropathy differed between men (46.2%) and women (36.7%). No sex-based difference was observed for chronic glomerulonephritis or nephrosclerosis. Although male pa-tients outnumbered female papa-tients overall, there were more female than male patients with lupus nephritis and amyloidosis (Fig.12, Additional file12: Table S12). Fig. 22Facility distribution, by TVC measurement frequency, 2006–2016. Abbreviation: TVC total viable microbial count
In 1998, diabetic nephropathy supplanted chronic glomerulonephritis as the most common primary dis-ease among incident patients; the distribution of dia-betic nephropathy has increased consistently ever since, but it has remained nearly the same in the past few years. Chronic glomerulonephritis has been consistently decreasing, whereas the unknown primary disease has been consistently increasing (Fig.13, Additional file 13: Table S13).
Causes of death among incident patients in 2016
The most common cause of death among the overall in-cident dialysis patients in 2016 was infectious disease (26.4%), followed by heart failure (22.1%) and malignant cancer (12.2%). Among male incident dialysis patients
was infectious disease (27.4%), followed by heart failure (21.4%), malignant tumor (12.7%), and others (10.0%). Among female incident dialysis patients, the most com-mon cause of death was infectious disease (24.4%), followed by heart failure (23.5%), others (12.7%), and malignant tumor (11.1%) (Fig. 14, Additional file 14: Table S14).
In the 1990s, the most common cause of death among incident dialysis patients was heart failure. However, the distribution of infectious disease increased gradually, reaching and surpassing the percentage of heart failure during the year 2000. In 2016, infectious disease remained the most common cause of death among inci-dent dialysis patients (26.4%), followed by heart failure (22.1%). The subsequent order of malignant tumor Fig. 24Facility distribution on TVC measurement, by cultivation medium, 2016. Abbreviations: R2A Reasoner’s no. 2 agar, TGEA tryptone glucose extract agar, TSA trypticase soy agar, TVC total viable microbial count
Fig. 25Facility distribution on TVC measurement, by sampling volume, 2016. Abbreviation: TVC total viable microbial count
(12.2%), cerebrovascular disease (5.9%), and myocardial infarction (2.9%) has remained unchanged. Over the long term, the percentages of deaths due to cerebrovas-cular disease and myocardial infarction have been de-clining, whereas the percentages of deaths due to infectious disease and malignant tumor have been in-creasing (Fig.15, Additional file15: Table S15).
Chapter 3: Dialysis fluid quality management Overview
Since 2006, the JRDR has conducted a survey on micro-biological quality and management of dialysis fluid. Based on the results, the standards for dialysis fluid microbiological quality were revised in 2008 [12], and further standards for biochemical contamination were added in 2016 [13]. In these standards, dialysis fluid microbiological quality is recommended to be assessed both by ET concentration and TVC, which are both evaluated a minimum of once monthly. At least one dia-lysis console is tested each month, and all consoles are
tested a minimum of once annually. The required mini-mum quality for standard dialysis fluid used in dialysis therapy was defined as an ET concentration of < 0.05 EU/mL and a TVC of < 100 cfu/mL. Furthermore, we recommended the use of ultrapure dialysis fluid (UPD) for all dialysis therapy; UPD is defined as having an ET concentration of < 0.001 EU/mL (less than the measure-ment sensitivity) and a TVC of < 0.1 cfu/mL. At the time these standards were adopted, as well as in 2016, they were the strictest quality standards for dialysis fluid worldwide. Furthermore, in the 2010 revision of the medical reimbursement system, dialysis fluid quality was added; as a result, dialysis fluid quality control dramatic-ally improved after the 2010 JRDR [10]. In 2015, dialysis fluid ET concentration and patient prognosis were ana-lyzed using JRDR data; the patient group being treated at facilities with a dialysis fluid ET concentration < 0.001 EU/mL was found to have a higher 1-year survival rate than the patient group undergoing treatment at facilities with a concentration of≥0.100 EU/mL [14].
Fig. 27Facility distribution, by sampling volume for TVC measurement, 2006–2016. Abbreviation: TVC total viable microbial count
Dialysis fluid endotoxin testing
According to the JSDT standard, dialysis fluid endotoxin (ET) concentration is assayed using Limulus tests [12]. In Japan, these ET assay systems are commercially avail-able at a relatively low cost and widely used. However, this situation is rather rare globally.
A total of 4318 facilities had at least one dialysis con-sole; 4254 of these facilities (98.5%) stated their dialysis fluid ET test frequency. Of these 4254 facilities, 3526 facilities (82.9%) met the JSDT standard of testing dialy-sis fluid for ET at least once monthly (Fig. 16, Add-itional file16: Table S16). Responses about dialysis fluid ET concentration were obtained from 4144 facilities (96.0%). A total of 3406 facilities (82.2%) reached a con-centration of < 0.001 EU/mL, which qualifies as UPD, and 4025 facilities (97.1%) reached a concentration of < 0.050 EU/mL, which qualifies as standard dialysis fluid (Fig.17, Additional file16: Table S16).
In 2008, when the JSDT standards for dialysis fluid were enacted, only 33.1% of dialysis fluid ET tests met these standards; however, this percentage im-proved to 70.6% in 2010, when payments for dialysis fluid quality management were added to the medical reimbursement system, and has been gradually in-creasing since (Fig. 18, Additional file 17: Table S17). The levels of dialysis fluid ET concentration qualifying as UPD and as standard dialysis fluid have both in-creased over time (Fig. 19, Additional file 18: Table S18). The absence of values for dialysis fluid ET con-centration in 2008 is due to the switch in the unit of dialysis fluid ET concentration from EU/L to EU/mL based on international rules in the survey that year, resulting in many incorrect entries.
Dialysis fluid total viable microbial count testing
The JSDT standards for dialysis fluid stipulate that dialy-sis fluid total viable microbial count (TVC) is to be assessed as the number of bacterial colonies formed after culturing for 7 days at 17–23 °C on a heterotrophic agar plate medium, as described below [12]. A total of
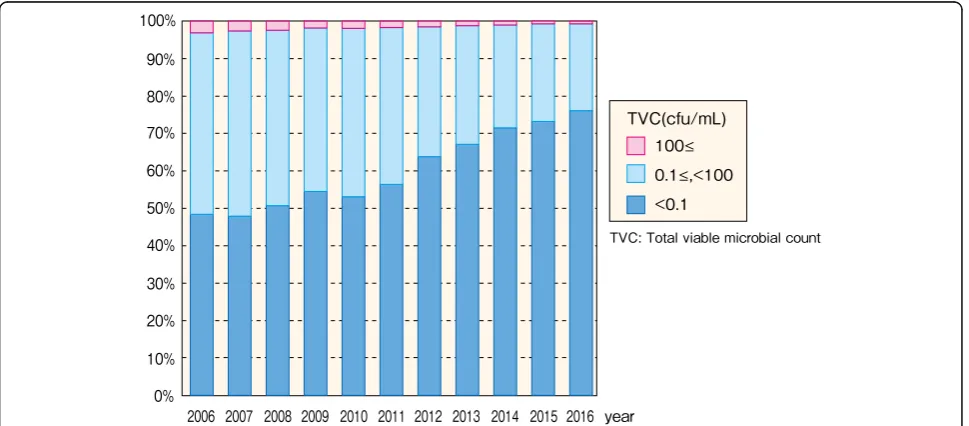
4239 facilities (98.1%) stated how frequently they assay the TVC of dialysis fluid; of these 4239 facilities, 3276 fa-cilities (77.3%) met the JSDT standard of performing as-says at least once per month (Fig.20, Additional file19: Table S19). A total of 4015 facilities (93.0%) stated the TVC of their dialysis fluid; of these 4015 facilities, 3057 facilities (76.1%) reached a TVC of < 0.1 cfu/mL, which qualifies as UPD, and 3987 facilities (99.3%) reached a TVC of < 100 cfu/mL, which qualifies as standard dialy-sis fluid (Fig.21, Additional file19: Table S19).
The frequency of TVC testing has increased over time; although this frequency improved in 2010, as did the fre-quency of ET assays, TVC testing has always been per-formed slightly less frequently than ET assays (Fig. 22, Additional file 20: Table S20). As with dialysis fluid ET concentrations, the levels of TVC qualifying as UPD and as standard dialysis fluid have increased over time (Fig.23, Additional file21: Table S21).
As described above, the JSDT standards for dialysis fluid recommend the use of a certified bacterial culture medium such as Reasoner’s no. 2 agar (R2A), tryptone glucose extract agar (TGEA), or one with a similar sensi-tivity [12]. In general, in methods using an agar plate medium, a 0.5-mL sampling volume is the minimum volume that guarantees a TVC of 100 cfu/mL, which qualifies as standard dialysis fluid. However, the UPD standard is < 0.1 cfu/mL; to meet this standard, a mini-mum of 10 mL dialysis fluid must be sampled and then cultured after being strained through a membrane filter. Therefore, the JRDR examines both the culture medium and the sampling volume.
In the 2015 JRDR, 3926 of 4318 facilities (91.0%) stated the medium they used for TCV testing. Of these facilities, 57.9% used R2A and 30.1% used TGEA; altogether, 88.0% of the facilities met the JSDT standard (Fig.24, Additional file22: Table S22). Of 4303 facilities, 4042 (93.9%) stated the dialysis fluid sampling volume used for TVC testing. In the 2016 survey, 80.9% of facil-ities sampled 10 mL or more dialysis fluid, thereby quali-fying as UPD (Fig.25, Additional file22: Table S22). Table 8Facility counts, by ETRF installation, 2016
With ETRF Without ETRF Subtotal No information available Total
Number of facilities (%) 4204 (97.4) 112 (2.6) 4316 (100.0) 2 4318
Values in parentheses under each figure represent the percentage relative to the subtotal in the row. The above data were obtained from the facility survey Abbreviations:ETRFendotoxin retentive filter
Table 9Dialysis console counts, by ETRF installation, 2016
Facility status of ETRF installation Subtotal No
information available
Total
Dialysis consoles with ETRF Dialysis consoles without ETRF
Numbers of dialysis consoles (%) 124,705 (92.3) 10,423 (7.7) 135,128 (100.0) 83 135,211
Values in parentheses under each figure represent the percentage relative to the subtotal in each row. The above data were obtained from the facility survey Abbreviations:ETRFendotoxin retentive filter
The use of R2A has been decreasing over time, whereas the use of TGEA has been increasing. Thus, the percentage of facilities that meet the JSDT standard has increased overall (Fig.26, Additional file 23: Table S23). The percentage of facilities that use a level of sampling volume that qualifies as UPD has also been increasing over time (Fig.27, Additional file24: Table S24).
Use of endotoxin retentive filters (ETRFs)
The appropriate use of an ETRF is essential for prepar-ing dialysis fluid that remains consistently clean. To that end, the JSDT enacted a standard for ETRF management in 2011 [15].
Of the 4318 facilities with at least one dialysis console, 4316 facilities (99.9%) provided responses about ETRF installation. Among these 4316 facilities, 4204 facilities (97.4%) had installed an ETRF in one or more dialysis consoles. Of the 135,211 dialysis consoles installed at the abovementioned 4316 facilities, 124,705 consoles (92.3%) had an ETRF installed (Tables 8and 9). The percentage of facilities meeting the UPD standard (ET concentration < 0.001 EU/mL and TVC < 0.1 cfu/mL) was higher among facilities that use an ETRF during sampling than those that do not (Fig.28, Additional file 25: Table S25, Fig.29, Additional file26: Table S26). In general, unless
the contamination of dialysis fluid immediately before the ETRF is extremely high, it is theoretically possible to reach the UPD standard for both ET and TVC by pass-ing the dialysis fluid through the ETRF once. However, despite the use of an ETRF, the UPD standards for ET concentration and TVC were not met by 16.9 and 22.7% of the facilities, respectively. These results suggest that although the spread of ETRF use has contributed to the cleanliness of dialysis fluid, there are still issues, such as the handling of ETRFs, that inhibit the achievement of the UPD standard [16].
Overall evaluation of the microbiological quality of dialysis fluid
The JSDT standard stipulates that for the microbio-logical quality of dialysis fluid to qualify as UPD or standard dialysis fluid, the specified levels for both dialy-sis fluid ET concentration and TVC must be met simul-taneously [11,12]. Of 4318 facilities, 4008 (92.8%) stated both their dialysis fluid ET concentration and TVC. These included 2863 facilities (71.4%) that achieved UPD status and 3888 facilities (97.0%) that achieved standard dialysis fluid status (Fig. 30, Additional file27: Table S27). The rates of achievement of the UPD and Fig. 28Facility distribution, by ETRF installation during sampling endotoxin concentration, 2016. Abbreviation: ETRF endotoxin retentive filter
standard dialysis fluid status have been improving over time (Fig.31, Additional file28: Table S28).
Chapter 4: hemodiafiltration (HDF) Hemodiafiltration patient dynamics
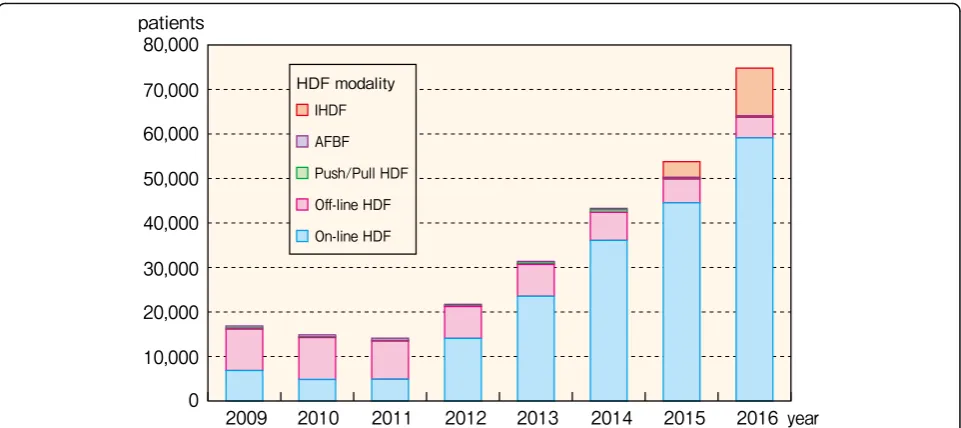
HDF includes on-line HDF, off-line HDF, push/pull HDF, acetate-free biofiltration (AFBF), and intermittent infusion hemodiafiltration (IHDF). The number of HDF patients in Japan has rapidly increased in recent years and had reached 74,799 patients by the end of 2016, ac-counting for 24.2% of all HD/HDF patients (Fig. 32, Additional file29: Table S29). Of these 74,799 HDF pa-tients, 48,291 (64.6%) were men and 26,508 (35.4%) were women (Table 10). The mean age was 65.4 years for men and 67.5 years for women, and the most common age group for both men and women was 65–69 years. These distributions and trends resembled those of HD patients, and it was shown that HDF was being
performed for a wide range of ages. The distribution of dialysis vintages was largely the same as that for HD patients (Table 11). Men tended to be more nu-merous in each age group, although the numbers of male and female patients with dialysis vintages of 25 years or longer were nearly identical. The major primary diseases of HDF patients were diabetic ne-phropathy (35.8%) and chronic glomerulonephritis (32.8%). Thus, as with HD patients, the percentage of diabetic nephropathy was high, whereas the percent-age of chronic glomerulonephritis was low (Table 12).
HDF modalities
The most common HDF modality in 2016 was on-line HDF, which accounted for 59,116 patients (79.0% of all HDF patients) (Fig. 32, Additional file 29: Table S29). Until 2011, the major HDF modality was off-line HDF; however, since 2012, on-line HDF has been the major Fig. 30Facility distribution, by TVC and endotoxin concentration, 2016. Abbreviation: TVC total viable microbial count
Fig. 31Facility distribution, in achievement of UPD and standard dialysis fluid, 2009–2016. Abbreviation: UPD ultrapure dialysis fluid
modality and its use has increased tremendously. In con-trast, the number of off-line HDF patients has been de-creasing yearly. In 2015, IHDF was added to the survey items and has been trending upward, with 10,728 pa-tients at the end of 2016 (14.3% of all HDF papa-tients).
Among all patients and all dialysis modalities (includ-ing detailed HDF modalities), the percentage of HDF tended to increase as the dialysis vintage lengthened (Fig. 33, Additional file30: Table S30). The percentages of both on-line and off-line HDF tended to increase as the dia-lysis vintage lengthened. Among all the groups, IHDF
accounted for about 2–3% of all patients. As the dialysis vin-tage lengthened, the percenvin-tage of PD decreased, whereas the percentage of hemoadsorption dialysis tended to in-crease; hemoadsorption dialysis was performed in 11.5% of all patients with dialysis vintages of at least 40 years.
HDF prescriptions
The HDF prescriptions consisted of the four possible com-binations of on-line/off-line HDF and the dilution method (pre-dilution and post-dilution). The most common com-bination was on-line HDF/pre-dilution (48,457 patients), Fig. 32HDF patient counts, by HDF modality, 2009–2016. Abbreviations: AFBF acetate-free biofiltration, HDF hemodiafiltration, IHDF intermittent infusion hemodiafiltration
Table 10HDF patient distribution, by age & sex, 2016
sex <20 20≤,<25 25≤,<30 30≤,<35 35≤,<40 40≤,<45 45≤,<50 50≤,<55 55≤,<60 60≤,<65
Male 7 31 126 349 766 1,684 2,958 3,719 4,623 6,192
(%) (0.0) (0.1) (0.3) (0.7) (1.6) (3.5) (6.1) (7.7) (9.6) (12.8)
Female 4 22 65 141 308 750 1,203 1,612 2,218 3,213
(%) (0.0) (0.1) (0.2) (0.5) (1.2) (2.8) (4.5) (6.1) (8.4) (12.1)
Total 11 53 191 490 1,074 2,434 4,161 5,331 6,841 9,405
(%) (0.0) (0.1) (0.3) (0.7) (1.4) (3.3) (5.6) (7.1) (9.1) (12.6)
sex 65≤,<70 70≤,<75 75≤,<80 80≤,<85 85≤,<90 90≤,<95 95≤ Total Mean age S.D.
Male 9,153 6,761 5,775 3,937 1,739 434 37 48,291 65.42 12.45
(%) (19.0) (14.0) (12.0) (8.2) (3.6) (0.9) (0.1) 100
Female 5,049 3,866 3,538 2,575 1,458 439 47 26,508 67.49 12.42
(%) (19.0) (14.6) (13.3) (9.7) (5.5) (1.7) (0.2) 100
Total 14,202 10,627 9,313 6,512 3,197 873 84 74,799 66.15 12.48
(%) (19.0) (14.2) (12.5) (8.7) (4.3) (1.2) (0.1) (100.0)
Abbreviations:HDFhemodiafiltration
Values in parentheses under each figure represent the percentage relative to the subtotal in each row *
whereas the least common combination was off-line HDF/ pre-dilution (501 patients). The blood flow rate in on-line HDF tended to be higher than that in off-line HDF; how-ever, there was no difference in blood flow rate between pre-dilution and post-dilution (Fig. 34, Additional file 31: Table S31). The on-line HDF/pre-dilution combination had the highest blood flow rate, with a mean of 229 mL/min; in this combination, > 50% of patients demonstrated a blood flow rate of 220 mL/min or higher, whereas 9.1% of patients demonstrated a blood flow rate of 300 mL/min or higher. On-line HDF was found to involve a longer dialysis time (Fig.35, Additional file32: Table S32).
The highest substitution volume was observed in the on-line HDF/pre-dilution combination (mean, 39.9 L), whereas the on-line HDF/post-dilution combination had a substitution volume of 10.2 L (Fig. 36, Additional file 33: Table S33). In off-line HDF, the substitution volume in pre-dilution and post-dilution was 12.0 and 8.0 L, respect-ively. There were no changes in substitution volume or its distribution over time in on-line HDF/pre-dilution or on-line HDF/post-dilution. In contrast, the substitution vol-ume for the off-line HDF/pre-dilution combination exhibited a slight upward trend yearly. The substitution volume for the off-line HDF/post-dilution has remained at around 8.0 L.
Comparison of HDF patients and in-center HD patients We compared the background factors and treatment indi-ces of HDF patients with those of in-center HD patients by
using on-line versus off-line and by dilution methods (Table13). HDF patients did not demonstrate evident sex differences but were younger and tended to have longer dialysis vintages than in-center HD patients. The preva-lence of diabetic nephropathy as a primary disease among HDF patients was lower than that among in-center HD pa-tients. The dialysis time was around 4 h for in-center HD patients and HDF patients in all HDF modalities. The blood flow rate in HDF patients was relatively high, which may be due to factors such as age differences between the patients. Although small-molecule clearance generally de-creased at high rates of pre-dilution, we found no difference in single-poolKt/Vurea (Kt/Vsp) between HD and HDF or between dilution modalities. This could be due to the slightly higher values for dialysis time and blood flow rate for the on-line HDF/pre-dilution combination, which in-volves a large substitution volume, than for in-center HD.
As for nutritional status indices, there were no evident differences between HDF and HD in serum albumin levels or nPCR. Creatinine levels and %CGR were higher with in on-line HDF/pre-dilution and post-dilution than in HD and roughly equivalent between HD and off-line HDF/pre-dilution and post-dilution. The CRP levels tended to be lower for on-line HDF/pre-dilution and post-dilution than in HD.
As treatment indicators for chronic kidney disease-mineral and bone disorder, the corrected calcium levels and intact PTH levels did not differ between modalities. Phosphorus levels were high with on-line HDF/pre-dilu-tion and post-diluHDF/pre-dilu-tion. As for total cholesterol levels and hemoglobin levels, there were no evident differences be-tween treatment modalities.
The differences in clinical indices between HDF pa-tients and in-center HD papa-tients may be due to selection bias such as patient age.
Chapter 5: peritoneal dialysis (PD) PD patient dynamics
According to the facility survey, there were 9021 PD pa-tients in 2016. The variations of PD therapy were PD only and combination with HD once weekly, twice weekly, thrice weekly, and other combinations; the num-ber of patients in each modality was 7190, 1560, 169, 38, Table 11HDF patient distribution, by sex and dialysis vintage, 2016
Sex (%)
< 5 5≤,< 10 10≤,< 15 15≤,< 20 20≤,< 25 25≤,< 30 30≤,< 35 35≤,< 40 40≤ Subtotal Unspecified Total Mean age SD
Male 19,888 (41.2) 12,785 (26.5) 6845 (14.2) 3805 (7.9) 2284 (4.7) 1301 (2.7) 759 (1.6) 438 (0.9) 159 (0.3)
48,264 (100.0) 27 48,291 8.33 7.97
Female 8816 (33.3) 6404 (24.2) 4102 (15.5) 2773 (10.5) 1872 (7.1) 1248 (4.7) 727 (2.7) 404 (1.5) 154 (0.6)
26,500 (100.0) 8 26,508 10.4 9.15
Total 28,704 (38.4) 19,189 (25.7) 10,947 (14.6) 6578 (8.8) 4156 (5.6) 2549 (3.4) 1486 (2.0) 842 (1.1) 313 (0.4)
74,764 (100.0) 35 74,799 9.07 8.47
Values in parentheses under each figure represent the percentage relative to the subtotal in each row. The above data were obtained from the patient survey Abbreviation:HDFhemodiafiltration
Table 12Prevalent dialysis patient distribution, by HDF/HD and primary disease, 2016
Primary disease HDF (%) HD (%)
Diabetes 26,768 (35.8) 93,965 (40.2)
Chronic glomerulonephritis 24,519 (32.8) 63,328 (27.1)
Nephrosclerosis 6443 (8.6) 24,053 (10.3)
PKD 2807 (3.8) 8319 (3.6)
Chronic pyelonephritis 687 (0.9) 2083 (0.9)
Others 13,575 (18.1) 41,956 (18.0)
Total 74,799 (100.0) 233,704 (100.0)
Values in parentheses under each figure represent the percentage relative to the subtotal in each row. The above data were obtained from the patient survey Abbreviations:HDhemodialysis,HDFhemodiafiltration,PKDpolycystic kidney disease
and 64, respectively (Table 1). Although the total num-ber of PD patients has been gradually decreasing since 2009, it must be noted that because the JRDR survey mainly targets facilities performing HD, PD patients treated at other facilities may not be included (Fig. 37, Additional file 34: Table S34). In 2015, we began to in-vestigate the number of incident PD patients, which de-creased from 2197 in 2015 to 1946 in 2016.
There were 8693 patients undergoing PD (including in combination with HD) in the patient survey; these pa-tients consisted of 5655 (65.1%) men and 3038 (34.9%) women with mean ages of 62.96 and 63.41 years, re-spectively (Table14). The age distribution peaked at 60– 74 years, which was the same trend as with HD patients. Of all patients currently undergoing PD, 44.2% had vin-tages of < 2 years whereas 7.1% had vinvin-tages of 8 years or longer (Table 15). Diabetic nephropathy was the pri-mary disease in 31.9% of PD patients, which was nearly equal to the 31.0% PD patients with chronic glomerulo-nephritis as the primary disease (Table16). The percent-age of diabetic nephropathy in PD patients was lower than that in HD patients.
PD + HD combined therapy
Of the 8693 PD patients for whom responses were pro-vided in the 2016 patient survey, the number of patients undergoing PD alone was 6931 (79.7%), and this number has remained virtually unchanged since 2009 (Fig. 38, Additional file35: Table S35). Only 3.4% of patients with PD vintages < 2 years were undergoing combined therapy with HD(F); however, the percentage of combined therapy increased as the PD vintages lengthened, increasing to 53.1% of patients with PD vintages of at least 8 years (Fig. 39, Additional file 36: Table S36). Most patients undergoing combined therapy did so once a week as 84.9% of all combined therapy patients.
PD prescriptions
PD prescriptions were examined for the 6931 patients undergoing PD alone according to the patient survey. Of these 6931 patients, responses about the daily PD fluid volume were obtained for 4476 patients (64.6%). The mean PD fluid volume for men and women was 6.59 and 5.69 L, respectively. The PD fluid volume decreased as age increased (Fig. 40, Additional file 37: Fig. 33Prevalent dialysis patient distribution, by dialysis modality and dialysis vintage, 2016. Abbreviations: AFBF acetate-free biofiltration, HD hemodialysis, HDF hemodiafiltration, IHDF intermittent infusion hemodiafiltration
Table S37) and increased as PD vintages lengthened (Fig. 41, Additional file 38: Table S38). The daily PD treatment time was stated for 4393 patients (63.4%); there was no evident difference based on sex (men 18.0 h, women 17.7 h) or age (Fig. 42, Additional file 39: Table S39). In contrast, longer PD vintages were correlated with longer PD treatment times; 74.9% of all patients with a PD vintage of 8 years or longer had a daily PD treatment time of 24 h (Fig.43, Additional file40: Table S40).
Responses about the use of APD were received for 4672 patients (67.4%), 41.9% of whom had undergone APD (Table 17). Responses about changing the
maneuver of PD fluid were received for 4640 patients (66.9%); UV sterilization connecting devices, completely manual methods, and thermal sterilization connecting devices were used for 53.4, 27.1, and 16.7% of these pa-tients, respectively (Table18).
Residual kidney function (urine volume and residual kidney Kt/V)
Residual kidney function was evaluated by residual kid-neyKt/Vand urine volume for the 6931 patients under-going PD alone. Mean urine volume responses were obtained for 3825 patients (55.2%), which represents a Fig. 35HDF patient distribution, by dilution mode and dialysis time, 2016. Abbreviation: HDF hemodiafiltration
Fig. 36Substitution fluid volume, by HDF modality and dilution mode, 2012–2016. Abbreviation: HDF hemodiafiltration
Blood flow rate (mL/min) 206.0 ± 35.5 228.7 ± 40.0 224.9 ± 42.2 215.8 ± 38.4 214.3 ± 36.2
Kt/Vsp male* 1.42 ± 0.26 1.45 ± 0.26 1.46 ± 0.28 1.41 ± 0.26 1.46 ± 0.27
Kt/Vsp female* 1.64 ± 0.31 1.70 ± 0.32 1.73 ± 0.35 1.62 ± 0.32 1.71 ± 0.33
Serum albumin (male) 3.57 ± 0.45 3.63 ± 0.38 3.61 ± 0.36 3.57 ± 0.46 3.55 ± 0.45
Serum albumin (female) 3.50 ± 0.44 3.58 ± 0.37 3.55 ± 0.38 3.56 ± 0.41 3.49 ± 0.43
Normalized protein catabolic rate (g/kg/day, male)* 0.84 ± 0.17 0.86 ± 0.16 0.87 ± 0.16 0.86 ± 0.17 0.85 ± 0.17
Normalized protein catabolic rate (g/kg/day, female)* 0.87 ± 0.18 0.90 ± 0.18 0.90 ± 0.18 0.92 ± 0.22 0.89 ± 0.18
Pre-dialysis serum creatinine (male)* 10.81 ± 2.78 11.41 ± 2.71 11.58 ± 2.83 10.99 ± 2.64 10.88 ± 2.72
Pre-dialysis serum creatinine (female)* 8.96 ± 2.34 9.55 ± 2.16 9.46 ± 2.04 9.18 ± 1.90 9.08 ± 2.10
Percent creatinine generation rate (%CGR) (male)* 98.77 ± 25.56 102.10 ± 23.81 102.44 ± 22.79 97.10 ± 24.91 98.17 ± 24.60
Percent creatinine generation rate (%CGR) (female)* 97.93 ± 26.36 102.60 ± 23.76 102.28 ± 23.69 98.17 ± 25.96 98.60 ± 24.85
Serum CRP level (mg/dL) 0.66 ± 1.88 0.52 ± 1.41 0.51 ± 1.30 0.69 ± 1.84 0.82 ± 2.23
Pre-dialysis serum calcium (mg/dL) 9.16 ± 0.75 9.14 ± 0.72 9.21 ± 0.70 9.22 ± 0.77 9.27 ± 0.80
Pre-dialysis serum phosphorus (mg/dL) 5.17 ± 1.44 5.35 ± 1.42 5.41 ± 1.39 5.28 ± 1.49 5.17 ± 1.46
Intact PTH level (pg/ml) 176.5 ± 170.1 181.6 ± 168.0 180.52 ± 181.9 182.5 ± 201.7 170.7 ± 189.0
Pre-dialysis serum total cholesterol (mg/dl) 155.4 ± 36.1 159.1 ± 35.7 162.3 ± 36.8 154.7 ± 35.7 155.0 ± 36.4
Pre-dialysis hemoglobin (g/dL) 10.77 ± 1.31 10.95 ± 1.23 10.95 ± 1.21 10.86 ± 1.36 10.77 ± 1.31
Population: in-center hemodialysis or hemodiafiltration (three times a week). The above data were obtained from the patient survey. For the indices from age to percent creatinine generation rate (female),“mean ± SD”are shown. Note: Total number of each index was different from each other because response rate for the question was different in each other
Abbreviations:Kt/Vspindex for standardized dialysis dose defined asKurea clearance,tdialysis time,Vbody fluid volume;spsingle pool;PTH
parathyroid hormone
*Kt/V, nPCR, creatinine concentration, and %CGR were summarized in the patients with vintages of 2 years or more and receiving dialysis three times a week
slightly lower response rate than those for the other questions about PD discussed above. The mean urine volume for men and women was 778 and 665 mL, re-spectively (Fig. 44, Additional file 41: Table S41). There were no evident differences by age, but urine volume de-creased as PD vintage inde-creased; 60.0% of patients with a PD vintage of 8 years or longer had a urine volume of < 100 mL (Fig.45, Additional file42: Table S42).
Residual kidney Kt/V responses were obtained for 2070 patients; the mean was 0.65 for men and 0.61 for women (Fig. 46, Additional file 43: Table S43). There were no evident differences by age, but residual kidney Kt/V showed a downward trend as the PD vintage lengthened (Fig.47, Additional file44: Table S44); 83.1% of patients with a PD vintage of 8 years or longer had a re-sidual renalKt/Vof < 0.4.
PD dose (ultrafiltration volume and PD Kt/V)
The PD dose was evaluated by ultrafiltration volume and PD Kt/Vfor 6931 patients undergoing PD alone. Mean ultrafiltration volume responses were obtained for 4383 patients (63.2%). The mean ultrafiltration volume for men and women was 632 and 582 mL, respectively (Fig. 48, Additional file 45: Table S45). There were no evident differences by age, but ultrafiltration volume showed an upward trend as the PD vintage lengthened; 55.6% of patients with a PD vintage of 8 years or longer had an ultrafiltration volume of 800 mL or more (Fig.49, Additional file46: Table S46).
Mean PD Kt/V responses were obtained for 2238 pa-tients (32.3%). The mean PD Kt/V for men and women was 1.17 and 1.32, respectively; thus, women tended to have higher values, but there were no evident tendencies by age (Fig.50, Additional file47: Table S47). PDKt/Valso showed an upward trend as PD vintage lengthened; 63.8% of patients with a PD vintage of 8 years or longer had a PD Kt/Vof 1.6 or more (Fig.51, Additional file48: Table S48). Table 14Prevalent PD patient distribution, by age and sex,
2016
Age Male Female Subtotal Total
< 15 41 (0.7) 44 (1.4) 85 (1.0) 85 (1.0)
15≤,< 30 58 (1.0) 37 (1.2) 95 (1.1) 95 (1.1)
30≤,< 45 392 (6.9) 224 (7.4) 616 (7.1) 616 (7.1)
45≤,< 60 1518 (26.8) 788 (25.9) 2306 (26.5) 2306 (26.5)
60≤,< 75 2558 (45.2) 1204 (39.6) 3762 (43.3) 3762 (43.3)
75≤,< 90 1028 (18.2) 675 (22.2) 1703 (19.6) 1703 (19.6)
90≤ 60 (1.1) 66 (2.2) 126 (1.4) 126 (1.4)
Total 5655 (100.0) 3038 (100.0) 8693 (100.0) 8693 (100.0)
Mean 62.96 63.41 63.12 63.12
SD 13.78 15.65 14.46 14.46
Values in parentheses under each figure represent the percentage relative to the total in each column. The above data were obtained from the patient survey Abbreviation:PDperitoneal dialysis
Table 16Prevalent patient distribution, by PD or HD and primary disease, 2016
Primary disease Peritoneal dialysis (%) Hemodialysis (%)
Diabetes 2772 (31.9) 93,905 (40.2)
Chronic glomerulonephritis 2695 (31.0) 63,287 (27.1)
Nephrosclerosis 1110 (12.8) 24,045 (10.3)
PKD 274 (3.2) 8318 (3.6)
Chronic pyelonephritis 99 (1.1) 2081 (0.9)
Others 1743 (20.1) 41,930 (18.0)
Total 8693 (100.0) 233,566 (100.0)
Values in parentheses under each figure represent the percentage relative to the total in each column. The above data were obtained from the patient survey
Abbreviations:HDhemodialysis,PDperitoneal dialysis
Table 15Prevalent PD patient distribution, by PD vintage and sex, 2016
PD vintage Male Female Subtotal Total
< 1 885 (23.8) 428 (21.6) 1313 (23.0) 1313 (23.0)
1≤,< 2 821 (22.1) 389 (19.6) 1210 (21.2) 1210 (21.2)
2≤,< 4 999 (26.8) 530 (26.7) 1529 (26.8) 1529 (26.8)
4≤,< 6 545 (14.6) 287 (14.5) 832 (14.6) 832 (14.6)
6≤,< 8 244 (6.6) 172 (8.7) 416 (7.3) 416 (7.3)
8≤,< 10 92 (2.5) 90 (4.5) 182 (3.2) 182 (3.2)
10≤ 137 (3.7) 88 (4.4) 225 (3.9) 225 (3.9)
Subtotal 3723 (100.0) 1984 (100.0) 5707 (100.0) 5707 (100.0)
No information available 1932 1054 2986 2986
Total 5655 3038 8693 8693
Mean 3.04 3.46 3.19 3.19
SD 2.96 3.35 3.11 3.11
Values in parentheses under each figure represent the percentage relative to the total in each column. The above data were obtained from the patient survey Abbreviation:PDperitoneal dialysis
PET and D/P Cr ratio
The JSDT PD guideline recommends evaluating periton-eal function with peritonperiton-eal equilibration test (PET) once or twice a year [17]. The JRDR investigated“with or with-out” of PET and the dialysate/peritoneal creatinine (D/P Cr) ratio. Among patients undergoing PD alone, a PET was performed for 45.9% of patients, whereas only fast PET1 was performed for 18.1% of patients, and no PET was performed for 36.0% of patients (Table19). The mean D/P Cr ratio for men and women was 0.67 and 0.65, re-spectively; thus, there was no sex-based difference, but an upward trend was observed as the age increased (Fig.52, Additional file 49: Table S49). No consistent trend was seen in the D/P Cr ratio by PD vintage, but the ratio de-creased slightly to 0.63 among patients with a PD vintage
of 8 years or longer (Fig.53, Additional file50: Table S50). The D/P Cr ratio by primary disease was high, 0.68, for both diabetic nephropathy and nephrosclerosis (Fig. 54, Additional file51: Table S51).
Peritonitis and exit-site infections
Peritonitis and catheter exit-site infections (ESIs) are major complications of PD and are therefore key factors that reduce PD continuation rates. The International So-ciety for Peritoneal Dialysis (ISPD) guideline recom-mends monitoring the incidence of peritonitis as part of a continuous quality improvement program [18]. Peri-tonitis is defined as a white blood cell count of 100/μL (at least 50% neutrophils) in PD drainage fluid; the Fig. 38Prevalent patient distribution, by PD + HD combination frequency, 2009–2016. Abbreviations: HD hemodialysis, PD peritoneal dialysis
peritonitis rate per patient-year was calculated based on the ISPD guideline using the formula below. ESIs were defined as evident drainage of pus.
Peritonitis rate¼peritonitis episodes in 2016
total months in 2016 on PD=12:
Of the 6931 patients undergoing PD alone, responses about peritonitis episodes were obtained from 4406 (63.6%); peritonitis was observed at least once during the year in 14.5% of patients (Fig.55, Additional file52: Table S52). Among the 4406 patients for whom responses were obtained, the peritonitis rate was 0.24 per patient-year, which was the same as in 2015. Men had a rate of 0.26 ep-isodes/patient-year, whereas women had a rate of 0.22 epi-sodes/patient-year; thus, the peritonitis rate was slightly higher among men (Fig.56, Additional file53: Table S53). Patients younger than 45 years had a peritonitis rate of 0.21 episodes/patient-year, versus a rate of 0.30 episodes/ patient-year among patients aged 75 years and older; thus,
the peritonitis rate tended to increase with age (Fig. 57, Additional file 54: Table S54). No consistent trend was found between peritonitis onset and PD vintage (Fig.58, Additional file 55: Table S55). In addition, there was no evident difference in peritonitis rate by primary disease (Fig.59, Additional file56: Table S56).
Responses about ESIs were obtained from 4391 pa-tients (63.4%), 19.7% of whom had at least one ESI dur-ing the year (Fig.60, Additional file57: Table S57).
History of EPS
Encapsulating peritoneal sclerosis (EPS) is a serious complication of PD; responses about a history of EPS and details of treatment were obtained for 13,025 pa-tients who are currently undergoing PD or have a his-tory of PD. We found that 696 (5.3%) of these patients had a history of EPS; of these patients, 83.6% had a his-tory of steroid use and 77.7% had a hishis-tory of ablative surgery (Table 20). Of these 696 patients with a history of EPS, there were 418 men (60.1%) and 278 women Fig. 40PD fluid volume, by age and sex, 2016. Abbreviation: PD peritoneal dialysis
Fig. 41PD fluid volume distribution, by PD vintage, 2016. Abbreviation: PD peritoneal dialysis
Fig. 42PD treatment time, by age and sex, 2016. Abbreviation: PD peritoneal dialysis
Fig. 43PD treatment time distribution, by PD vintage, 2016. Abbreviation: PD peritoneal dialysis
Table 17Prevalent PD patient counts, by APD machine use, 2016
Patients on APD Patients on CAPD Subtotal Unspecified No information available Total
Patients (%) 1957 (41.9) 2715 (58.1) 4672 (100.0) 9 2250 6931
Values in parentheses under each figure represent the percentage relative to the subtotal in each row. The above data were obtained from the patient survey. Population: PD patients excluding PD + HD combination