R E S E A R C H
Open Access
The diagnosis of inherited metabolic diseases by
microarray gene expression profiling
Monica Arenas Hernandez
1, Reiner Schulz
2, Tracy Chaplin
3, Bryan D Young
5, David Perrett
6, Michael P Champion
7,
Jan-Willem Taanman
8, Anthony Fensom
4, Anthony M Marinaki
1*Abstract
Background:Inherited metabolic diseases (IMDs) comprise a diverse group of generally progressive genetic metabolic disorders of variable clinical presentations and severity. We have undertaken a study using microarray gene expression profiling of cultured fibroblasts to investigate 68 patients with a broad range of suspected metabolic disorders, including defects of lysosomal, mitochondrial, peroxisomal, fatty acid, carbohydrate, amino acid, molybdenum cofactor, and purine and pyrimidine metabolism. We aimed to define gene expression signatures characteristic of defective metabolic pathways.
Methods:Total mRNA extracted from cultured fibroblast cell lines was hybridized to Affymetrix U133 Plus 2.0 arrays. Expression data was analyzed for the presence of a gene expression signature characteristic of an inherited metabolic disorder and for genes expressing significantly decreased levels of mRNA.
Results:No characteristic signatures were found. However, in 16% of cases, disease-associated nonsense and frameshift mutations generating premature termination codons resulted in significantly decreased mRNA
expression of the defective gene. The microarray assay detected these changes with high sensitivity and specificity.
Conclusion:In patients with a suspected familial metabolic disorder where initial screening tests have proven uninformative, microarray gene expression profiling may contribute significantly to the identification of the genetic defect, shortcutting the diagnostic cascade.
Background
At least 300 different IMDs have been described [1] and new disorders are being identified [2,3] due to increasing awareness and advances in identification techniques. The birth prevalence of IMDs in the West Midlands is estimated to be 1 in 784 live births, extra-polating to approximately 800 new cases per year in the UK as a whole [4]. The majority of patients (72%) are diagnosed by the age of 15 years, with only one-third diagnosed by the age of one year. Any hope of effective treatment rests on precise and early diagnosis [4,5]. The diagnosis of IMDs may be a long and tedious process. The first step relies on matching clinical pre-sentation to a potentially defective metabolic pathway. These investigations may take several months to com-plete, and even after this time, it may not be possible
to make a diagnosis. Indeed, our experience in the Pur-ine Research Laboratory at Guy’s and St Thomas’ Hos-pitals shows that a definitive diagnosis is only made in about 1% of children investigated for a suspected pur-ine or pyrimidpur-ine disorder, with one reason being the overlap in clinical presentation between unrelated metabolic disorders. In the majority of cases, referrals are made for purposes of disease exclusion, or as part of a differential diagnosis.
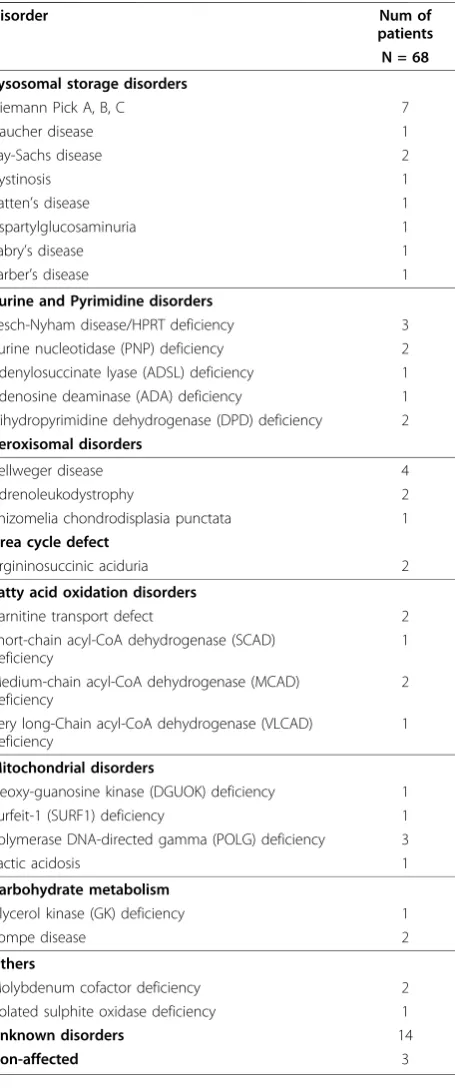
We have undertaken a study using microarray gene expression profiling of cultured fibroblasts to investigate patients with a broad range of suspected metabolic dis-orders, including defects of lysosomal, mitochondrial, peroxisomal, fatty acid oxidation, carbohydrate, amino acid, molybdenum cofactor, and purine or pyrimidine metabolism (Table 1). The aim of the study was to define a gene expression signature characteristic of a defective metabolic pathway. No characteristic
* Correspondence: [email protected]
1
Purine Research Laboratory. GSTS Pathology. Guy’s and St. Thomas’ Hospitals, London, UK
Full list of author information is available at the end of the article
transcriptome-wide signatures were evident. However, we found that in 16% of cases the defective gene could be identified from the gene expression data irrespective of the underlying metabolic disorder.
Methods
Patient samples and tissue culture
Human skin fibroblast cell lines from 68 patients with suspected or confirmed metabolic disorders (Table 1) were recovered from the cell bank held by the Enzyme
Laboratory, Medical and Molecular Genetics,
Guy’s Hospital. Cells were cultured with Ham’s F10 medium supplemented with 10% foetal bovine serum, 2% L-glutamine (200 mM), 2% penicillin (5.0 IU/ml) and streptomycin (5.0μg/ml) at 37°C in a closed system. Passage numbers were recorded where known.
Cell lines were screened for Mycoplasma infection using Venor®GeMmycoplasmadetection kit for conven-tional PCR (Minerva Biolabs GmbH, Germany).
RNA extraction and microarrays
Cells were grown in triplicate to sub-confluence. Total RNA from triplicate flasks was extracted using the RNeasy® Mini kit™(QIAGEN, Crawley, UK). The pooled RNA was then concentrated using RNeasy® MinElute™ -Cleanup kit (QIAGEN) and quantified by spectrophoto-metric analysis measuring absorbance at 260 and 280 nm. Double stranded cDNA was synthesised from 5 μg RNA using the Affymetrix One-cycle cDNA synthesis kit following the manufacturer’s instructions (Affyme-trix, High Wycombe, UK). Synthesis of Biotin-Labelled cRNA was performed using the Affymetrix GeneChip IVT Labelling kit, following the manufacturer’s instruc-tions. Labelled cRNA was then purified (sample cleanup module) and fragmented and 15μg hybridized to Affy-metrix GeneChip® Human Genome U133 Plus 2.0 arrays overnight.
Analysis of mycroarray data
Probe level summarization of all arrays was performed twice using two different methods: Robust multiarray averaging [6] (RMA) and Factor analysis for robust microarray summarization [7] (FARMS). In addition, Informative/Non-Informative (I/NI) P-values were computed [8]. Control probe sets and probe sets with a relatively large number of aligning probes or non-uniquely aligning probes were excluded. Inclusion cri-teria for a probe set were that 7 or more probes (out of a total of 11 for most probe sets) had to perfectly match the human transcriptome, and the median num-ber of perfect matches per probe had to be less than 1.5 for a probe set to be included. In the case of the RMA-summarized data, a probe set had to also exceed a median expression level of 100 (linear scale) across all arrays, resulting in 11,753 probe sets entering into the subsequent analyses. In the FARMS case, only informative probe sets were considered (I/NI P-value of less than 0.6), leaving a total of 9,787 probe sets for
Table 1 Inherited metabolic disorders included in this study and number of patients.
Disorder Num of
patients N = 68
Lysosomal storage disorders
Niemann Pick A, B, C 7
Gaucher disease 1
Tay-Sachs disease 2
Cystinosis 1
Batten’s disease 1
Aspartylglucosaminuria 1
Fabry’s disease 1
Farber’s disease 1
Purine and Pyrimidine disorders
Lesch-Nyham disease/HPRT deficiency 3 Purine nucleotidase (PNP) deficiency 2 Adenylosuccinate lyase (ADSL) deficiency 1 Adenosine deaminase (ADA) deficiency 1 Dihydropyrimidine dehydrogenase (DPD) deficiency 2
Peroxisomal disorders
Zellweger disease 4
Adrenoleukodystrophy 2
Rhizomelia chondrodisplasia punctata 1
Urea cycle defect
Argininosuccinic aciduria 2
Fatty acid oxidation disorders
Carnitine transport defect 2 Short-chain acyl-CoA dehydrogenase (SCAD)
deficiency
1
Medium-chain acyl-CoA dehydrogenase (MCAD) deficiency
2
Very long-Chain acyl-CoA dehydrogenase (VLCAD) deficiency
1
Mitochondrial disorders
Deoxy-guanosine kinase (DGUOK) deficiency 1 Surfeit-1 (SURF1) deficiency 1 Polymerase DNA-directed gamma (POLG) deficiency 3
Lactic acidosis 1
Carbohydrate metabolism
Glycerol kinase (GK) deficiency 1
Pompe disease 2
Others
Molybdenum cofactor deficiency 2 Isolated sulphite oxidase deficiency 1
Unknown disorders 14
analysis. We refer to the measurements taken by the included probe sets for a patient sample as the sample’s expression profile. Principal component analysis (PCA) was applied to identify and quantify independent sources for the variance observed in the data. Matlab r2007a was used for correlation, hierarchical clustering and PCA.
We used two metrics to determine the degree to which a gene expression measurement x constitutes an outlier: Dixon’s Q statistic defined as (2nd-to-minimal-value-x)/range, and a variant of Grubb’s outlier test sta-tistic MAD-Grubb and defined as (median-x)/MAD where MAD is the median absolute deviation. MAD-Grub was preferred to MAD-Grubb’s standard statistic, as it is outlier-resistant, which is beneficial for the detection of outliers at the extreme low end of the distribution, since irrelevant extreme values at the high end of the distribu-tion have little or no influence on the median or the MAD.
PCR and Sequencing analysis
The coding region of genes of interest was sequenced from genomic DNA extracted from cultured fibroblast cell lines. Intron-located primers were designed using Primer3 v.0.4.0 website [9] for the following genes:
AGA, ADA, ADSL, GAA, ACADM, HPRT1, SURF1, MOCS2, DGUOK, NPC1, NPC2, HEXA(Additional file 1). PCR products were purified using QIAquick®PCR purification Kit (QIAGEN). Dye-terminator cycle sequencing was performed using the BigDye®terminator v3.1 cycle sequencing kit (Applied Biosystems, Warring-ton, UK). Excess dye terminators were removed using
Agencourt®CleanSeq® (Beckman Coulter, High
Wycombe, UK). Samples were run on an ABI PRISM 3130 × l Genetic Analyzer (Applied Biosystem). Sequences were analysed by Mutation Surveyor Local v3.20 (Biogene, Kimbolton UK).
Results
Search for a gene expression signature
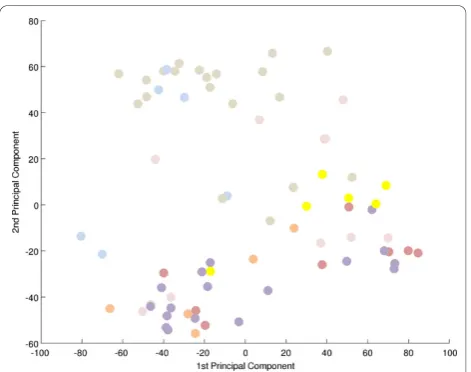
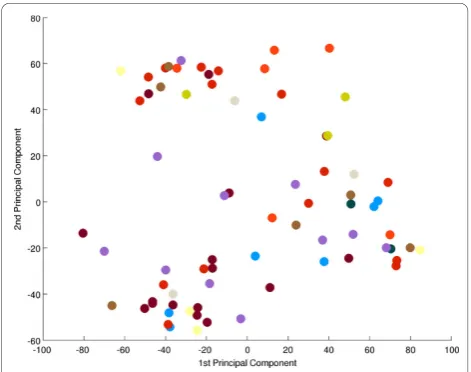
To search for a metabolic signature, principal compo-nent analysis (PCA) was applied to identify and quantify independent sources of variation observed in the data. PCA identified no single dominating source of variance (Figure 1). The first and second principle components (PCs) accounted for ~20% and ~15% of overall variance, with the microarray batch experimental variable being the source of these two components of overall variance (Figure 2), as opposed to patient gender or disease cate-gory (Figure 3 and 4). Although, the analytical variance introduced by batching the arrays in different experi-ments was greater than the variation due to biological factors, batching arrays was not a dominant source of variance overall. This was a first indication that
transcriptional profiles do not effectively discriminate between different categories of metabolic disease.
Correlation analysis showed that correlation coeffi-cients (r2) for any pair of expression profiles ranged from 0.73 to 0.98. While r2 was greater than 0.9 for all
Figure 1Principal component analysis of microarray data. PCA determines the independent axes along which the data exhibits the largest variation. The first ten principal axes/components and their contribution to the overall variance in the data are shown. No single component contributes more than 20% to the overall experimental variation.
pairs of replicate samples (arrays 23 & 67, 17 & 61, 20 & 59, 16 & 62), a sample and its replicate did not typically achieve the maximum r2 (Additional file 2 ‘FARMS_CCs’). There were other non-identical samples from the same microarray batch for which r2 was greater. Since the replicate of a sample was always pro-cessed as part of a different batch, this suggests that there were systematic differences between the
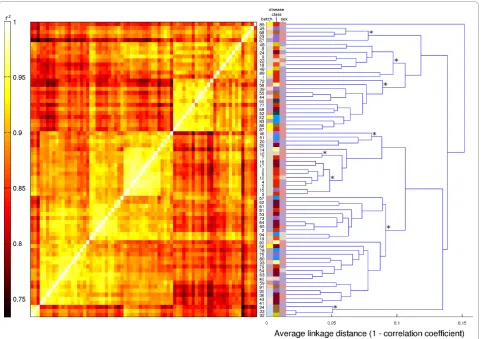
microarray batches which were sufficiently large to make replicates appear to be relatively uncorrelated, even though in absolute terms, the correlation between replicates was high. More importantly, this also indicates the absence of disease-dependent systematic effects on gene expression profiles that are large enough to super-sede the technical microarray batch effect. This was underscored by the results of applying unsupervised hierarchical clustering to the data (Figure 5). The eight most distinct non-singleton clusters tended to partition the set of samples along microarray batch boundaries, and not according to patient gender or disease class (Additional file 2‘Samples’).
Outlier (NMD) detection
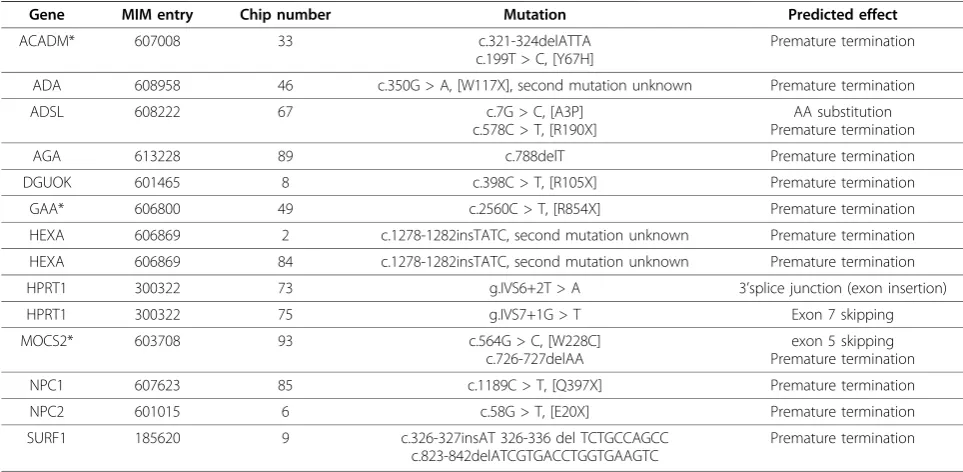
While metabolic diseases do not appear to result in a specific gene expression profile characteristic of dis-ease-class, we observed that in 14/68 (21%) of the assayed patient fibroblast cell lines, mRNA expression of the gene responsible for the metabolic defect was decreased and well separated from the population (Figure 6). DNA sequencing identified mutations con-sistent with nonsense-mediated decay (NMD) of the mRNA (Table 2).
We then determined whether NMD of the disease-causing gene was systematically detectable from the microarray data using outlier statistics. We used two metrics to determine the degree to which a gene expres-sion measurement x constitutes an outlier relative to the patient population: Dixon’s Q statistic defined as 2nd-to-minimal-value-x)/range, and a variant of Grubb’s out-lier test statistic MAD-Grubb defined as median-x)/ MAD where MAD is the median absolute deviation. For each metric, we investigated sensitivity and specificity with respect to NMD detection. Since we suspected that the results also depended on the choice of microarray probe-level summarization method, we performed the analysis twice, using Factor analysis for robust microar-ray summarization (FARMS) or Robust multiarmicroar-ray aver-aging (RMA) respectively.
Using the FARMS-summarized data (Additional file 2 ‘FARMS_GoIs), we found that a threshold of Dixon’s Q > 0.25 achieved maximum sensitivity. For 11 out of the 14 positive NMD patients, the measurement of a probe set for the specific mutated gene exceeded the threshold. Three patients (33, 49, and 93) were considered false negatives as the probe set or sets for the affected gene (ACADM, GAA, MOCS2) were excludeda priorydue to having been called non-informative during data pre-processing. Therefore, lowering the Dixon’s Q threshold did not increase sensitivity and hence, 11/14 was the maximally achievable sensitivity. Using the MAD-Grubb metric, maximum sensitivity was achieved with a thresh-old of >4.5.
Figure 3Principal component analysis-effect of patient gender. There is no correspondence between PC1 and 2 and patient gender. A projection of all expression profiles onto the plane spanned by the first two PCs is shown. There is no clustering of male (blue) or female (red) arrays, indication that gender does not contribute substantially to gene expression variation. Grey = unknown; see also Additional file 2‘Samples’).
For the RMA-summarized data (Additional file 2 ‘RMA_GoIs’), a threshold of Dixon’s Q > 0.25 gave a sensi-tivity of 12 out of 14 positive controls, with the false nega-tives being 49 and 93. Maximum sensitivity (13/14) was achieved for a threshold of 0.19, which was exceeded for a
MOCS2probe set in patient 93. Patient 49 remained a false negative due to the onlyGAAprobe set having been excluded during pre-processing. Using the MAD-Grubb metric, maximum sensitivity was achieved with a threshold of > 5.4.
Next, we investigated the specificity of the Dixon’s Q and MAD-Grubb outlier metrics. Specifically, we deter-mined, separately for each sample, the fraction of probe sets for which Dixon’s Q (or MAD-Grubb) was less than the threshold, while systematically varying the threshold. We estimated the false positive rate (FPR) for a sample as the fraction of probe sets exceeding the threshold. This is a conservative estimate, since for some of the false positive
genes polymorphism affecting mRNA expression may be responsible for the decreased expression.
For FARMS-summarized data and a threshold of Dix-on’s Q > 0.25 (maximum sensitivity 11/14), the false positive rate (FPR) was <0.1% for all samples except sample 34 (FPR < 0.25%. In absolute terms, an FPR of < 0.1% corresponded to, on average, less than 10 probe sets per sample exceeding the threshold from a total of 9,787 probe sets. For the MAD-Grubb threshold of > 4.5 (maximum sensitivity 11/14), the FPR was < 0.9% for most samples. The exceptions were four samples 33, 36, 32, 34 with FPR > 1%, all from the same microarray batch. So, at maximum sensitivity, the FPR for the MAD-Grubb metric was an order of magnitude larger than for Dixon’s Q, and MAD-Grubb was more suscep-tible to microarray batch effects.
For RMA-summarized data and a threshold of Dixon’s Q > 0.25 (sensitivity 12/14), the FPR was <0.25% for all
but two samples (34 and 36; FPR > 1%). For MAD-Grubb > 5.4 (maximum sensitivity 13/14), the FPR was < 0.9% for all but four samples (33, 36, 32, 34; FPR > 1%). For Dixon’s Q > 0.19 (maximum sensitivity 13/ 14), the FPR was < 0.5%, again except for samples 34 and 36. Given the total number of 11,753 probe sets in the analysis, an FPR of < 0.25% corresponds to < 30 probe sets.
Discussion
No evidence of a gene expression signature characteris-tic of a specific metabolic disorder was found using PCA and hierarchical clustering. Few studies have attempted to characterise mRNA profiles in inherited metabolic disorders. Using microarray-generated expres-sion data, Bozzato et al, compared three fibroblast cell lines from patients with mucolipidoses type IV, an auto-somal recessive lysoauto-somal storage disorder, to three con-trol cell lines, and reported differential expression of a number of genes belonging to endosome/lysosome traf-ficking, lysosome biogenesis, organelle acidification and lipid metabolism [10]. The authors concluded that dif-ferential expression of these genes correlated with altered biological processes associated with the disease. Bifsha et al noted down regulation of ubiquitin C-terminal hydrolase (UCH-L1) in eight different lysoso-mal storage disorder samples [11] suggesting that impairment of the ubiquitin-dependent protein degrada-tion pathway may contribute to increased cell death seen in some of these disorders. We found no clustering of patients with lysosomal disorders that would indicate a gene expression signature. Considerable variation in levels of gene expression between different patient cell lines was found. We have however not defined a‘normal range’for the expression of individual genes as 65/68 of cell lines in the study were derived from patients with a suspected metabolic defect. Gene expression would also be expected to vary under different culture conditions to those used in this study. A proportion of the cohort
Figure 6Genes identified with premature termination codon mutations leading to nonsense mediated decay. Messenger RNA expression levels for all patients for selected genes are shown. The outliers seen at the bottom of distribution correspond to patients (numbered) with nonsense mediated decay associated mutations. The genesACADM, GAAandMOCS2were excluded from analysis through probe set selection and classified as false negatives.
Table 2 Genes with mutations resulting in premature termination codons and nonsense mediated decay.
Gene MIM entry Chip number Mutation Predicted effect
ACADM* 607008 33 c.321-324delATTA
c.199T > C, [Y67H]
Premature termination
ADA 608958 46 c.350G > A, [W117X], second mutation unknown Premature termination
ADSL 608222 67 c.7G > C, [A3P] c.578C > T, [R190X]
AA substitution Premature termination
AGA 613228 89 c.788delT Premature termination
DGUOK 601465 8 c.398C > T, [R105X] Premature termination
GAA* 606800 49 c.2560C > T, [R854X] Premature termination
HEXA 606869 2 c.1278-1282insTATC, second mutation unknown Premature termination
HEXA 606869 84 c.1278-1282insTATC, second mutation unknown Premature termination
HPRT1 300322 73 g.IVS6+2T > A 3’splice junction (exon insertion)
HPRT1 300322 75 g.IVS7+1G > T Exon 7 skipping
MOCS2* 603708 93 c.564G > C, [W228C] c.726-727delAA
exon 5 skipping Premature termination
NPC1 607623 85 c.1189C > T, [Q397X] Premature termination
NPC2 601015 6 c.58G > T, [E20X] Premature termination
SURF1 185620 9 c.326-327insAT 326-336 del TCTGCCAGCC c.823-842delATCGTGACCTGGTGAAGTC
Premature termination
variation, < 20%, can be ascribed to a batch effect or variation between different experiments. Although varia-tion between experiments is low, this may have been sufficient to mask the identification of a metabolic sig-nature. Non-genetic factors which may contribute to variation in gene expression seen in the population include passage number of the cell lines and differences between cell culture medium batch.
We were able to detect significantly decreased mRNA expression levels of the defective gene relative to the expression range in the study cohort in 11/68 (16%) patients. The low levels of mRNA correlating with pre-mature termination codon (PTC) mutations are consis-tent with nonsense mediated mRNA decay (NMD), a process which enables the cell to eliminate faulty mRNA that would otherwise translate into aberrant truncated proteins with potential toxic effects for the organism [12-14].
Our results suggest that FARMS-summarization and Informative/Non-Informative (I/NI)-filtering [8] of the array data combined with the Dixon’s Q outlier metric provide the best trade-off between sensitivity (> 78%; 11/14 patients) and specificity (> 99.9%) for the purpose of NMD detection. The sensitivity can be improved (> 92%) by using RMA-summarization combined with rela-tively conservative low-expression threshold filtering and/or using the MAD-Grubb outlier metric. However, this reduces specificity by an order of magnitude which, given the total number of tests performed (~10,000 probe sets), can lead to dozens of genes being identified as potentially undergoing NMD (Additional file 2
‘NMD_summary’,‘FARMS_NMD’,‘RMA_NMD’).
Using FARMS-summarization and I/NI-filtering of the array data, three false negatives were identified with NMD-associated mutations in ACADM, MOCS2and
GAA. These three genes were identified as outliers and true positives when Dixon’s Q outlier metric was applied to the unfiltered data. This represents a limita-tion of the assay as only genes with significant levels of expression in fibroblasts were included in the analysis in order to maximize specificity. As a result, disease asso-ciated genes expressed at a low level or not expressed at all in fibroblasts will be excluded from the analysis.
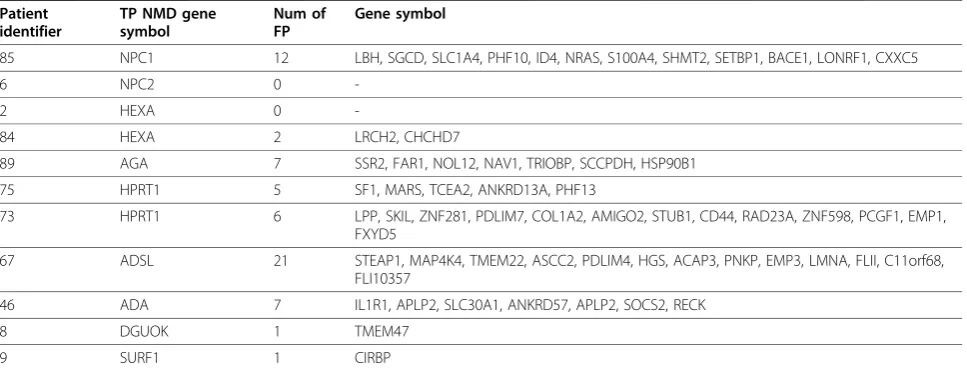
For FARMS-summarized data and a threshold of Dix-on’s Q > 0.25 (maximum sensitivity 11/14 patients), the false positive rate (FPR) of < 0.1% corresponded on average, to less than 10 of 9,787 probe sets per sample exceeding the threshold for detection as an outlier. For example, for cell line 73 with a confirmed deficiency of the enzyme HPRT due to the mutation, HPRTg.IVS6
+2T > A (Table 2), genesLPP, SKIL, ZNF281, PDLIM7,
COL1A2, and AMIGO2 were detected as outliers in addition toHPRT1(Table 3). For cell line 75, also with a confirmed deficiency of enzyme HPRT, with mutation,
HPRTg.IVS7+1G > T (Table 2), genes SF1, MARS,
TCEA2, ANKRD13A, and PHF13 (Table 3) were detected as outliers in addition to HPRT1. The outlier genes identified in the two HPRT deficient patients were different and none of these genes to our knowl-edge are disease associated. It is also possible that low levels of mRNA detected as false positives may be the result of promoter variants or asymptomatic heterozy-gous PTC mutations; however this was not investigated. Clinical phenotypes provide guidance to limit the num-ber of candidate disease-associated genes for further investigation.
There are more than 300 different inherited metabolic diseases [4,15]. Nonsense and frameshift mutations gen-erating PTCs account for approximately one third of mutations in human genetic diseases [16]. In our study, the defective gene could be identified in 16% of patients with an IMD. Fibroblast cell cultures are often estab-lished in patients with suspected familial metabolic dis-orders where initial screening tests have proven uninformative. It is in this group of patients where gene expression may contribute significantly to shortcutting the diagnostic cascade.
Conclusion
In this study, we investigated whether microarray gene expression profiling of cultured fibroblasts could identify the metabolic defect in 68 patients with proven or sus-pected inherited metabolic diseases. Using this approach, we were able to identify the defective gene in 16% of patients irrespective of the underlying metabolic defect. There are a number of emerging technologies which will find application in the routine diagnosis of genetic disorders. These include targeted re-sequencing chips aimed at specific groups of disorders [17] and massively parallel next generation sequencing, which is orders of magnitude more expensive than gene expres-sion profiling. We suggest that due to the relatively low cost of microarray gene expression profiling, this tech-nology has a role to play in the diagnosis of genetic dis-orders where first-line screening tests are uninformative.
Additional material
Additional file 1: Table S1. Primers and PCR conditions
Additional file 2: Excel spread sheet containing the following data. Sample/Patient annotation,FARMS_CCs: Pair-wise correlation coefficients between gene expression profiles for all samples, based on FARMS data,
FARMS_GoIs: Annotation and outlier test for metabolic genes of interest using FARMS expression values and I/NI filtering,RMA_GoIs: Annotation and outlier test for metabolic genes of interest using RMA expression values and 100 as expression cut-off,FARMS_NMD: NMD candidates based on FARMS data,RMA_NMD: NMD candidates based on RMA data,
Acknowledgements
We acknowledge financial support from Guy’s and St.Thomas’Charity. The Purine metabolic patients association (PUMPA) provided funding for a pilot study. We would like to thank Tina Slade for her assistance with tissue culture.
Author details 1
Purine Research Laboratory. GSTS Pathology. Guy’s and St. Thomas’ Hospitals, London, UK.2Division of Medical and Molecular Genetics. King’s
College London, London, UK.3Cancer Research UK Medical Oncology Laboratory. Barts and the London School of Medicine and Dentistry. Queen Mary, University of London, London, UK.4Genetics Centre. GSTS Pathology.
Guy’s and St. Thomas’Hospitals, London, UK.5Institute of Cancer, Barts and the London School of Medicine, Queen Mary University, London, UK.
6
Chemistry Department. Barts and the London School of Medicine and Dentistry. Queen Mary, University of London, London, UK.7Department of
Inherited Metabolic Disease. Evelina Children’s Hospital, London, UK.
8Department of Clinical Neurosciences. Institute of Neurology, University
College London, UK.
Authors’contributions
The study was designed by AMM, MAH and DP. A first draft of the manuscript was prepared by MAH, RS and AMM. MAH was responsible for the laboratory aspects of the study. RS analysed the microarray data with contributions from MAH and AMM. Clinical information and samples were provided by MPC, JWT, and AF. Access to microarray facilities and technical support were provided by BDY, DP, and TC.
All authors read and approved the final manuscript.
Competing interests
The authors declare that they have no competing interests.
Received: 21 July 2010 Accepted: 1 December 2010 Published: 1 December 2010
References
1. Martins AM:Inborn errors of metabolism: a clinical overview.Sao Paulo Med J1999,117:251-265.
2. Haberle J, Gorg B, Toutain A, Rutsch F, Benoist JF, Gelot A, Suc AL, Koch HG, Schliess F, Haussinger D:Inborn error of amino acid synthesis: human glutamine synthetase deficiency.J Inherit Metab Dis2006, 29:352-358.
3. Marie S, Heron B, Bitoun P, Timmerman T, Van Den Berghe G, Vincent MF: AICA-ribosiduria: a novel, neurologically devastating inborn error of purine biosynthesis caused by mutation of ATIC.Am J Hum Genet2004, 74:1276-1281.
4. Sanderson S, Green A, Preece MA, Burton H:The incidence of inherited metabolic disorders in the West Midlands, UK.Arch Dis Child2006, 91:896-899.
5. Raghuveer TS, Garg U, Graf WD:Inborn errors of metabolism in infancy and early childhood: an update.Am Fam Physician2006,73:1981-1990. 6. Irizarry RA, Bolstad BM, Collin F, Cope LM, Hobbs B, Speed TP:Summaries
of Affymetrix GeneChip probe level data.Nucleic Acids Res2003,31:e15. 7. Hochreiter S, Clevert DA, Obermayer K:A new summarization method for
Affymetrix probe level data.Bioinformatics2006,22:943-949. 8. Talloen W, Clevert DA, Hochreiter S, Amaratunga D, Bijnens L, Kass S,
Gohlmann HW:I/NI-calls for the exclusion of non-informative genes: a highly effective filtering tool for microarray data.Bioinformatics2007, 23:2897-2902.
9. Rozen S, Skaletsky H:Primer3 on the WWW for general users and for biologist programmers.Methods Mol Biol2000,132:365-386.
10. Bozzato A, Barlati S, Borsani G:Gene expression profiling of mucolipidosis type IV fibroblasts reveals deregulation of genes with relevant functions in lysosome physiology.Biochim Biophys Acta2008,1782:250-258. 11. Bifsha P, Landry K, Ashmarina L, Durand S, Seyrantepe V, Trudel S,
Quiniou C, Chemtob S, Xu Y, Gravel RA,et al:Altered gene expression in cells from patients with lysosomal storage disorders suggests impairment of the ubiquitin pathway.Cell Death Differ2007,14:511-523. 12. Chang YF, Imam JS, Wilkinson MF:The nonsense-mediated decay RNA
surveillance pathway.Annu Rev Biochem2007,76:51-74.
13. Le Hir H, Seraphin B:EJCs at the heart of translational control.Cell2008, 133:213-216.
14. Muhlemann O:Recognition of nonsense mRNA: towards a unified model.
Biochem Soc Trans2008,36:497-501.
15. Seymour CA, Thomason MJ, Chalmers RA, Addison GM, Bain MD, Cockburn F, Littlejohns P, Lord J, Wilcox AH:Newborn screening for inborn errors of metabolism: a systematic review.Health Technol Assess
1997,1:i-iv, 1-95.
16. Linde L, Kerem B:Introducing sense into nonsense in treatments of human genetic diseases.Trends Genet2008,24:552-563.
17. Bruce CK, Smith M, Rahman F, Liu ZF, McMullan DJ, Ball S, Hartley J, Kroos MA, Heptinstall L, Reuser AJ,et al:Design and validation of a metabolic disorder resequencing microarray (BRUM1).Hum Mutat2010, 31:858-865.
doi:10.1186/1750-1172-5-34
Cite this article as:Arenas Hernandezet al.:The diagnosis of inherited metabolic diseases by microarray gene expression profiling.Orphanet Journal of Rare Diseases20105:34.
Table 3 Genes identified as false positives (FP) after FARMS-summarization and I/NI-filtering of the data combined with Dixon’s Q outlier metric in true positive (TP) patients.
Patient identifier
TP NMD gene symbol
Num of FP
Gene symbol
85 NPC1 12 LBH, SGCD, SLC1A4, PHF10, ID4, NRAS, S100A4, SHMT2, SETBP1, BACE1, LONRF1, CXXC5
6 NPC2 0
-2 HEXA 0
-84 HEXA 2 LRCH2, CHCHD7
89 AGA 7 SSR2, FAR1, NOL12, NAV1, TRIOBP, SCCPDH, HSP90B1
75 HPRT1 5 SF1, MARS, TCEA2, ANKRD13A, PHF13
73 HPRT1 6 LPP, SKIL, ZNF281, PDLIM7, COL1A2, AMIGO2, STUB1, CD44, RAD23A, ZNF598, PCGF1, EMP1, FXYD5
67 ADSL 21 STEAP1, MAP4K4, TMEM22, ASCC2, PDLIM4, HGS, ACAP3, PNKP, EMP3, LMNA, FLII, C11orf68, FLI10357
46 ADA 7 IL1R1, APLP2, SLC30A1, ANKRD57, APLP2, SOCS2, RECK
8 DGUOK 1 TMEM47