DOI10.1186/s40008-014-0010-3
R E S E A R C H Open Access
A Human Capital Based Growth Model
with Environment and Corruption
Daisuke Ikazaki
Received: 29 June 2014 / Revised: 10 December 2014 / Accepted: 12 December 2014 /
? 2014 Ikazaki; licensee Springer. This is an Open Access article distributed under the terms of the Creative Commons Attribution License (http://creativecommons.org/licenses/by/4.0), which permits unrestricted use, distribution, and reproduction in any medium, provided the original work is properly credited.
Abstract In this paper, we present a simple overlapping-generations model with human capital, pollution, and political corruption to consider problems related to sustainable growth. In many growth models that incorporate the environment, it is assumed that there exists an altruistic government that enforces the environmental policy to maximize the utility of households or social welfare. The conditions for sus-tainable growth are derived based on this assumption. However, the assumption that the government implements appropriate policies might be overly optimistic. Bribes, political donations, and corruption might taint and skew government policy. This pa-per also considers politico-economic problems. We assume that environmental policy is determined endogenously through a process of bargaining between the government and the ?rm (or interest group). Corruption relaxes environmental standards, lowers the long-run growth rate, and might cause economic stagnation. The long-run growth rate might become negative if the economy is rife with corruption.
Keywords Political corruption⊥Sustainable growth⊥Human capital⊥Environment
JEL Classi?cation O44⊥P48⊥Q20
1 Introduction
As described in this paper, we present a simple overlapping-generations model with human capital, pollution, and political corruption to consider problems related to sus-tainable growth.
D. Ikazaki (
B
)Faculty of Human Sciences and Design, Japan Women?s University, 2-8-1, Mejirodai, Bunkyo-ku, Tokyo, 1128680, Japan
In earlier studies, for example, John and Pecchenino (1994), John et al. (1995), and Bovenberg and Heijdra (2002) extend the model of Diamond?s (1965) OLG model and examine the relation between growth and the environment. Stokey (1998), Aghion and Howitt (1998) also examine the relation between economic growth and the environment.1 These studies assume that the government is altruistic. Results obtained using such models suggest that environmental externalities should be inter-nalized by environmental policies. These studies do not consider politico-economic problems. Moreover, the assumption that the government implements appropriate policies might be overly optimistic. Bribes, political donations, and corruption might taint and skew government policy. Negotiation and compromise between parties might occur when the government executes policies. Furthermore, not only govern-ment but also the private sector might use political power to head off the introduction of strict environmental policies if such policies reduce their pro?ts.2
In this paper, we will consider how political corruption affects economic growth and the environment. To highlight the dynamic features of economic activities, we use the ideas of human capital. Human capital accumulation is one of the most important factors when we consider long-run growth (Lucas1988). Some insist that R&D and innovation exert an important role in long-run growth (Romer1990; Aghion and Howitt1992). We can construct a growth model with R&D and innovation instead of human capital. However, we can derive similar results even if we introduce R&D. So, we assume that human capital accumulation becomes an engine of productivity improvement.
Lopez and Mitra (2000) consider the relation between pollution and growth. The amounts of donations and pollution level (environmental standard) are determined endogenously through a process of bargaining between the government and the ?rm. They show that corruption does not affect the sustainability of economic growth, although the economy emits more pollution than under the social optimum.
Our model might be interpreted as an extension of Lopez and Mitra (2000). A salient difference is that we construct a dynamic OLG model rather than a static model (Lopez and Mitra2000construct a static model). By constructing an OLG model, we can derive the different results from Lopez and Mitra (2000). It can be demonstrated that corruption relaxes environmental standards and lowers the long-run growth rate. Results show that the growth rate might become zero or negative if the government and/or public sector are corrupt to such a degree. Our paper specif-ically examines the case in which the government colludes with the entrepreneur. Their utility will increase at the expense of the laborer. In this sense, an implicit con?ict exists between entrepreneurs and laborers.3
This paper is organized as follows. In Sect.2, the basic setting of this paper is de-scribed. In Sect.3, we consider environmental policy. In Sect.2and Sect.3, we do not take bribes or political donations into consideration. In this case, the long-run growth
1Stokey (1998) and Aghion and Howitt (1998) assume individuals with in?nite longevity. Their models
are not the OLG model.
2See Fredriksson (1997), Aidt (1998). Furthermore, Damania et al. (2003) discuss the linkages between
trade policy, corruption, and environmental policy.
rate becomes positive and the environment improves over time if certain conditions are met. In Sect.5, problems related to political corruption are introduced. The en-trepreneurs offer political donations to the government if such donations can increase their pro?ts to a great extent. However, the government accepts donations if the net bene?t of taking political donations is positive. We assume that the amount of dona-tions and the pollution level (environmental standards) are determined endogenously through a process of bargaining between the government and the entrepreneur. In this case, the government and the ?rm try to arrive at a cooperative outcome through mu-tual agreement. We show that this interlocking relation between entrepreneurs and government lowers the growth rate. The economy might stagnate if the economy is heavily tainted by corruption.
2 The Model
First, we will analyze the ?nal goods sector. The market for ?nal goods is assumed to be perfectly competitive. A continuum of ?rms exists. Because the technology displays constant returns to scale, the precise number of ?rms is irrelevant. For sim-plicity, we will take their total mass to be one. Following Copeland and Taylor (1994) and Stokey (1998), we assume that the output of the ?nal good can be written as a function of pollution and effective input (in our model, human capital). We establish the production function of the ?nal good as
Yt=AHtαD
1⊥α
t , (1)
whereYt is the aggregate output,4Adenotes the productivity parameter,Ht repre-sents the human capital, andDt signi?es the pollution. The parameter αis assumed as 0< α <1. Presuming that the government distributes permits uniformly across ?rms and then allows a secondary market in those permits, then those ?rms maxi-mize their pro?ts at each date, taking the wage ratewt and the price of permitτt as given. The pro?t of the ?rm is given as
πt=AHtαDt1⊥α⊥ wtHt⊥ τt(Dt⊥ ˆDt).
HereDtˆ denotes the numbers of permits that the government supplies to each ?rm. From the ?rms? pro?t maximization (evaluated market equilibrium), we can obtain
wt=AαHtα⊥1Dt1⊥α, (2)
τt=A(1⊥ α)HtαD⊥t α. (3)
Presuming that the market for permits clears at every moment:Dt = ˆDt for allt. Thenπt=τtDt=A(1⊥ α)HtαD
1⊥α t .5
4Subscripttrepresents the level in periodtthroughout this paper.
5See Stokey (1998). In her model, the pro?ts are allocated to households because the ?rms are owned by
Let us consider consumers. Generationtis de?ned as the people who are born in periodt. We assume that individuals live for two periods and that each has one child. Without loss of generality, we assume that the number of each generation is unity. During the period of youth, individuals accumulate human capital and do not work. The production function of human capital of generationtis speci?ed as
Ht+1=BHtβz
1⊥β
t , (4)
whereBis the parameter and 0< β <1. TheHton the right-hand-side denotes pos-itive externalities from the human capital of parents (generationt⊥ 1), andzt is the educational outlay from the parents. Education cost of young people (generationt) is paid by their parents (generationt⊥ 1). Note also that there is no decision making when they are young.
Each individual can only work during the second period of life. They supply hu-man capital inelastically, earn a wage, and allocate their income to consumption and education outlay of their children. It is assumed that the labor market clears at ev-ery moment. We also assume that utility of the representative individual depends on consumption and the parents? education expenditure on the child.6We specify the expected utility of an individual in generationt (which is represented asUtI) as
UtI=φ1logct+1+(1⊥ φ1)logzt+1+φ2logEt+1, (5)
wherect signi?es consumption andzt denotes the education outlay to their children. Also,φ1(0< φ1<1) andφ2(φ2>0) are the parameters.
In addition,Et represents the environmental quality. We assume that the dynamic behavior of environmental quality is speci?ed as
Et+1=b1Et⊥ b2Dt, (6)
whereb1>1 andb2>0. The stock of the environmental good has the ability to
renew itself. The rate of renewal is given as functionb1Et. However, pollution causes environmental damage. One unit of pollution spoilsb2units of environmental quality.
Therefore, the net rate of change of the stock of the environment is given as (6). Let us consider generationt⊥ 1. They accumulate their human capital in period t⊥ 1 and work in periodt. Their budget constraint is given aswtHt =ct+zt. In-dividuals maximize their utility (5)7subject to the budget constraint, taking Et as given. From the individuals? utility maximization, we can obtain
ct=φ1wtHt, (7)
zt=(1⊥ φ1)wtHt. (8)
6See Glomm and Ravikumar (1992), Galor and Moav (2004), and others. 7Note that the utility of an individual in generationt⊥ 1 is given as
From Eqs. (2), (4), and (8), we can obtain the following:
Ht+1=BHtβ
(1⊥ φ1)wtHt
1⊥β
=BHtβAα(1⊥ φ1)HtαD
1⊥α t
1⊥β
=BAα(1⊥ φ1)
1⊥β
Ht1⊥(1⊥α)(1⊥β)D(t1⊥α)(1⊥β). (9) Next, we will speci?cally examine the entrepreneur.8We assume that the utility of the entrepreneur in periodt depends only on the pro?t of the ?rm in period t (we implicitly assume that entrepreneurs are short lived). We specify the utility of entrepreneur (UtF) as
UtF =logπt=log
(1⊥ α)Yt
. (10)
3 Environmental Policy
In this section, we consider government policy. A government supplies a permit to control the pollution. We assume that the government is short-lived and that its ob-jective is to maximize utility (UtG), which is de?ned as
UtG=UtI⊥1+UtI+φ3UtF+f (Mt, Yt),
whereUtI andUtF are de?ned in the previous section. Also, Mt signi?es the political donation andf (Mt, Yt)denotes the net bene?t of such a donation. In this section, we speci?cally examine the case in which Mt=0. In other words, we analyze the case in which no political corruption exists. Therefore, the utility of the government in this is given asUtG=UtI⊥1+UtI+φ3UtF because we assumef (0, Yt)=0. In Sect.4, we will discuss problems related to political corruption in detail. Parameter φ3is the relative weight that the politicians assign to the utility of the entrepreneur.
The following equations must hold:
ct+1=φ1αYt+1 =Aαφ1Htα+1D
1⊥α t+1 =Aαφ1Dt1+⊥1α
BAα(1⊥ φ1)
1⊥β
Ht1⊥(1⊥α)(1⊥β)Dt(1⊥α)(1⊥β)α
=(Aα)1+α⊥αβφ1(1⊥ φ1)α(1⊥β)
⊥ BαD1t+⊥1αHtα(1⊥(1⊥α)(1⊥β))Dtα(1⊥α)(1⊥β), (11) zt+1=(1⊥ φ1)αYt+1
=Aα(1⊥ φ1)Htα+1D1t+⊥1α
8Acemoglu et al. (2006) describe a model in which collusion between capitalists and entrepreneurs
=Aα(1⊥ φ1)Dt1+⊥1α
BAα(1⊥ φ1)
1⊥β
Ht1⊥(1⊥α)(1⊥β)Dt(1⊥α)(1⊥β)α
=Aα(1⊥ φ1)
1+α⊥αβ
BαD1t+⊥1αHtα(1⊥(1⊥α)(1⊥β))Dtα(1⊥α)(1⊥β). (12) The government in periodtlooks ahead to the subsequent period because the util-ity of each young voter depends onct+1andEt+1. Following Verbon and Verhoeven
(1992), Meijdam and Verbon (1997), and Ono (2005), this paper assumes rational ex-pectations and myopic decision making. Rational exex-pectations mean that the short-lived government can estimate the environmental tax rate in the subsequent period accurately. Myopic decision making implies that the government does not consider the impact of current policies on future political decisions. These assumptions imply that the government chooses a level of pollutionDt, taking the level of pollution in the next periodDt+1as given.
Let us consider the impact of the relaxation of environmental regulations (the in-crease in the supply of the emissions credits). First, it raises the wages and consump-tion of elderly worker. This effect increases the utility of each old voter. Second, it drives up pro?ts of the ?rm. This effect improves the utility of each entrepreneur. Third, it increases the consumption of periodt+1 because human capital in period t+1 will drive up by such deregulation. This effect increases the utility of each young voter. Fourth, the environmental quality decreases in periodt+1. Each young voter will be worse off by this effect.
The condition for the maximum is given as
φ4
Dt =
b2φ2
b1Et⊥ b2Dt ,
whereφ4≡(1⊥ α)(1+φ3+α(1⊥ β)). Then we can express the level of pollution
(denoted asDt∗) as
D∗t = b1φ4 b2(φ2+φ4)
Et. (13)
The level of pollution will be higher when individuals do not care about the envi-ronment (lowerφ2), when the regenerative ability of the environment is high (higher
b1), when pollution does not severely affect the environment (lowerb2), when the
pro?t rate is high (lowerα), and when the relative weight the politicians attach to the utility of entrepreneur is high (higherφ3). From Eqs. (6) and (13), we obtain
Et+1=
b1φ2
φ2+φ4
Et ≡g∗Et. (14)
Here we de?ne g∗≡ b1φ2
φ2+φ4. The growth rate ofEt isg
∗⊥ 1 for allt. It is assumed
thatg∗>1. That is,Et improves over time. Furthermore, from Eqs. (9) and (13), we obtain
Ht+1=B
Aα(1⊥ φ1)
1⊥β
Ht1⊥(1⊥α)(1⊥β)
b1φ4
b2(φ2+φ4)
Et
(1⊥α)(1⊥β)
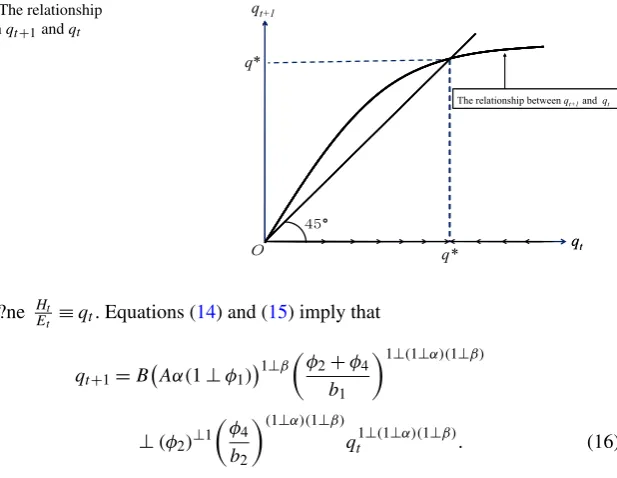
Fig. 1 The relationship betweenqt+1andqt
We de?ne Ht
Et ≡qt. Equations (14) and (15) imply that
qt+1=B
Aα(1⊥ φ1)
1⊥β
φ2+φ4
b1
1⊥(1⊥α)(1⊥β)
⊥ (φ2)⊥1
φ4
b2
(1⊥α)(1⊥β)
qt1⊥(1⊥α)(1⊥β). (16) The dynamic behavior ofqt is given as (16). We can show thatqt=qt+1in the
long run because 0<1⊥ (1⊥ α)(1⊥ β) <1 (see Fig.1). This steady state is unique and stable. In the steady state,Ht+1
Ht =g
∗. Therefore, the growth rate of the ?nal good is also given byg∗. The initial values of qt do not play an important role in our model.
We have not considered the range ofDt until this point. However, as pointed out by Copeland and Taylor (1994), and Stokey (1998), the contribution ofDt toYt must be limited by a ceiling. Suppose thatDt ≤ ⊥dYt. Copeland and Taylor (1994), and Stokey (1998) make similar assumptions. We assume thatd⊥ is relatively large and the existence of this assumption does not affect our results thus far.
We can show that human capital accumulation is necessary for Yt+1⊥Yt
Yt >0 if we
assumeDt ≤ ⊥dYt. To prove this, suppose thatB=0 andβ=1. ThenHt=H0for
allt. Suppose also that b1φ2
φ2+φ4 >1 (see Eq. (14)). In this case theDt come atdY⊥ t(note thatDt/dY⊥ t=Dtα/AH0α) and the growth rates ofYtandEtbecome 0 in the long run. Human capital accumulation play an essential role in our model whenDt ≤ ⊥dYt. In this paper, we would like to analyze how political corruption affects growth rate and environment. So, considering the human capital accumulation is necessary in our model.
4 Corruption and Political Donation
show that knowledge related to cottage technology sometimes blocks the adoption of new technology. Ehrlich and Lui (1999) construct a model in which each agent invests in political capital that affects income distribution. However, investment in political capital does not contribute to production or productivity increases, it counts for nothing from a social point of view. Acemoglu et al. (2006) show that interlock-ing relations among existinterlock-ing low-skilled managers (which can be interpreted as low productivity industries), capitalists (which can be interpreted as owners of the ?rms or ?nancial sectors), and government might bring about the delay of changes in the industrial structure. In these models, corruption tends to affect the steady state of the economy. However, these models do not consider environmental problems or bar-gaining between government and the private sector to affect environmental policies.
In this section, we introduce an interest group that offers a political donation to a government to head off the introduction of a strict environmental policy. Here, we assume that the entrepreneurs can form an interest group and affect government poli-cies.9The net pro?t of entrepreneurs is given as (1⊥ α)Yt⊥ Mt (whereMt denotes the political donation). Therefore, the utility of representative entrepreneur is given as log[(1⊥ α)Yt⊥ Mt]. The utility of the government is de?ned as
UtG=UtI⊥1+UtI+φ3UtF +f (Mt, Yt). (17) In that equation,f (Mt, Yt)represents the net bene?t of political donation.10 We as-sume thatf (0, Yt)=0 for allYt. In Sects.2and3, we do not consider political dona-tions (that is,Mt=0). IfMt=0, Eq. (17) is equivalent toUtG=UtI⊥1+UtI+φ3UtF. It is also assumed that a risk of taking a donation exists because a collusive relation between the interest group and government might not be supported by voters. We as-sume that the risk of accepting a donation increases withYt. Economic development increases the government?s risk of taking a donation: we assume∂M∂f >0 and ∂f∂Y <0. The donation might be regarded as a bribe. In many countries, bribes are illegal in general. Bribery scandals might engender a change of government. The government of?cials might be arrested for corruption.
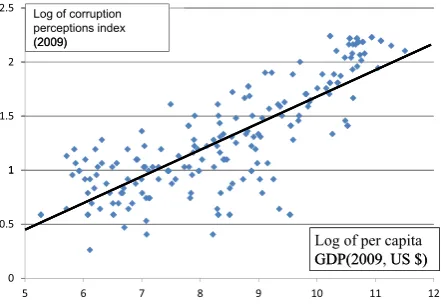
Figure2shows a positive correlation between per-capita GDP11 and corruption perceptions index (CPI) published by Transparency International a non-governmental organization that monitors corporate and political corruption in international devel-opment (Transparency International2009). Corruption is de?ned as the abuse of en-trusted power for private gain. A higher score of the index indicates less corruption. The highest (lowest) value is de?ned as 10 (0). The results show that seven out of every ten countries (and nine out of every ten developing countries) have an index of
9Grossman and Helpman (1994) consider the effect of the interest groups. Acemoglu et al. (2006) consider
the case in which old low-skill managers and capitalists entered into a collusive agreement. Ehrlich and Lui (1999) discuss the situation in which each agent (individuals or bureaucrat) invests not only in human capital but also in political capital, which affects income redistribution. Aidt et al. (2008) construct a model in which the government sets a tax rate to maximize its net bene?t. In his model, raising the tax rate increases the share that the government can obtain, but it decreases the tax base because some workers begin to move to the informal sector.
10Downs (1957) assumes that the sole motive behind government policy formulation is the winning of
elections. He did not consider rent-seeking behavior of the government.
Fig. 2 The relationship between log (per capita GDP) and log (corruption perceptions index)
fewer than 5 points out of 10. We present a plot showing the data of 168 countries in Fig.2.
Lambsdorff (2007) shows that an improvement in the CPI by one point increases average income by 4 percentage points because appropriate institutions increase cap-ital in?ows and raise productivity.12
This might imply that rich countries tend to have cleaner government, fair in-stitutions, and appropriate laws. If so, the risk of taking political donations might increase with per-capita income because citizens in the developed countries call on the rectitude of government. To re?ect this point, we assume that the net bene?t of political donation increases with Mt and decreases with Yt. In this paper, we as-sume that f (Mt, Yt)≡γMYtt. Therefore, the utility of the government is given as UtG=UtI⊥1+UtI+φ3UtF +γMYtt.
We assume thatMt andDt are determined endogenously through a process of bargaining between the government and the private ?rm. In this case, the government and the ?rm try to arrive at a cooperative outcome through mutual agreement. Avail-able to them are a set of outcomes from which they can choose and a disagreement outcome, i.e., the outcome that is obtained when the government and the ?rm fail to arrive at an agreement (see Nash1953and Osborne and Rubinstein 1990). In this paper, the bargaining solution is to determineτt andDt to maximize
UtF ⊥ UtG,
where UtF and UtGare de?ned as
UtF =log(1⊥ α)AHtαDt1⊥α⊥ Mt
⊥ log(1⊥ α)AHtαDt∗1⊥α, (18) UtG=φ4logDt+φ2log(b1Et⊥ b2Dt)+γ
Mt Yt
⊥ φ4logDt∗⊥ φ2log
b1Et⊥ b2D∗t
. (19)
12Data used in Lambsdorff (2007) are the older version. His book was published in 2007. Kurtzman et al.
Therein,D∗t is given as (13). The conditions for the maximum are expressed as
(1⊥ α)2YtDt⊥1 (1⊥ α)Yt⊥ Mt ⊥
UtG+
φ4
Dt ⊥
b2φ2
b1Et⊥ b2Dt
⊥ UtF =0, (20)
⊥ 1
(1⊥ α)Yt⊥ Mt ⊥ U G t +γ
1 Yt ⊥ U
F
t =0. (21)
Equations (20) and (21) imply
φ4+γ (1⊥ α)2
Dt =
φ2
b1Et⊥ b2Dt
, (22)
which suggests that
Dt1= b1[φ4+γ (1⊥ α)
2]
b2[φ2+φ4+γ (1⊥ α)2]
Et, (23)
whereDt1is the pollution discharged in this situation. The pollution is more emitted (and differs from the optimal values) when the marginal bene?t of the political dona-tion is high (largerγ) and pro?t rate is high (lowerα). In this case, dynamic behavior ofEt is given as
Et+1=
b1φ2
φ2+φ4+γ (1⊥ α)2
Et≡
g1Et. (24)
Hereg1≡ b1φ2
φ2+φ4+γ (1⊥α)2. In the steady state, the growth rates ofEt,Ht,Yt are the same and are denoted asg1⊥ 1. From Eqs. (14) and (24), we know thatg∗> g1.
The intuition behind these results is as follows. Corruption increases the total amount of pollution because the government accepts political donations in exchange for the extra issuance of permits. An increase in pollution bumps the total output becauseYt is positively correlated with Dt (see Eq. (1)). So, corruption allows the economy to grow faster in periodt. However, environmental stock decreases because Et+1is negatively correlated withDt(see Eq. (6)). So corruption has two opposite ef-fects onDt+1. First, corruption tends to increaseDt+1because the government issues
more permits for a givenEt+1. On the other hand, corruption in periodt decreases
Et+1and this reducesDt+1 (see Eq. (23)). The latter negative effects predominate
eventually and the growth rate settles down at a lower steady state rate.
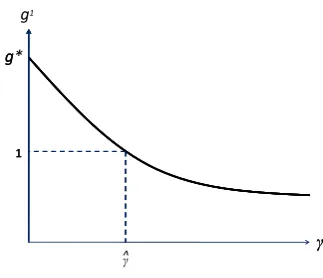
Figure3shows the relation betweeng1andγ.g1is correlated negatively withγ. The growth rate is positive ifγ is small, although the growth rate is lower thang∗. However,g1becomes smaller than 0 ifγ >γˆ, whereγˆ is de?ned as follows:
ˆ
γ≡(b1⊥ 1)φ2⊥ φ4
(1⊥ α)2 . (25)
Fig. 3 The relationship betweenγandg
stagnation. Therefore, preventing politicians? or government of?cials? unfair med-dling in government affairs might be necessary to achieve sustainable growth. Lopez and Mitra (2000) also assume that environmental policy and the amount of politi-cal donations are determined by bargaining between ?rms and government. In their model, corruption is unlikely to preclude the possibility of sustainable growth, al-though the pollution levels corresponding to corrupt behavior are always above the socially optimal level. In our model, this is no longer true. The long-run growth rate might become negative if the economy is rife with corruption.
Hall and Jones (1999) insist that the difference in output per worker and per-capita income are driven by differences in social infrastructure across countries. They de?ne social infrastructure as institutions and government policies that determine economic environment within which individuals accumulate skills, ?rms accumulate capital and engage in product activity. They conclude that per-capita output is positively related with social infrastructure. If we can relate uncorrupt government (in this case,γ is small) to one feature of desirable social infrastructure, then our results might support the contention of Hall and Jones (1999).
5 Concluding Remarks
In this study, we extend a simple overlapping-generations model to consider the sus-tainability of growth. Our model includes environmental problems and political cor-ruption. In many growth models that incorporate the environment, it is assumed that there exists an altruistic government that enforces the environmental policy to maxi-mize the utility of households or social welfare. In many previous studies, the condi-tions for sustainable growth are derived based on this assumption.
between the government and the entrepreneur. This paper showed that the interlock-ing relations between the government and the interest group lower the growth rate and might cause economic stagnation. Lopez and Mitra (2000) show that corruption is unlikely to preclude the possibility of sustainable growth, although the pollution levels corresponding to corrupt behavior are always above the socially optimal level. In our model, this is no longer true. The long-run growth rate might become negative if the economy is rife with corruption.
Competing Interests
The author declares that he has no competing interests.
Acknowledgements This work was supported by JSPS KAKENHI Grant Number 25245042. I am grateful to Keisuke Osumi, Hikaru Ogawa, Kenichiro Ikeshita, Masayuki Sato, Shintaro Nakagawa, and two anonymous referees for their helpful comments. I would also like to express my appreciation to the par-ticipants in some conferences (The 9th World Congress of the Regional Science Association International held at Timisoara, Romania, and Seminars held at Kagoshima University and Japan Women?s University) who made valuable suggestions on earlier versions of this paper. Needless to say, all remaining errors are mine.
References
Acemoglu D, Aghion P, Zilibotti F (2006) Distance to frontier, selection, and economic growth. J Eur Econ Assoc 4:37?74
Aghion P, Howitt P (1992) A model of growth through creative destruction. Econometrica 60(2):323?351 Aghion P, Howitt P (1998) Endogenous growth theory. MIT Press, Cambridge
Aidt TS (1998) Political internalization of economic externalities and environmental policy. J Public Econ 69:1?16
Aidt TS, Dutta J, Senac V (2008) Governance regimes, corruption and growth: theory and evidence. J Comp Econ 36:195?220
Bovenberg A, Heijdra B (2002) Environmental abatement and intergenerational distribution. Environ Re-sour Econ 23(1):45?84
Copeland BR, Taylor MS (1994) North-south trade and the environment. Q J Econ 109:755?787 Damania R, Fredriksson PG, List JA (2003) Trade liberalization, corruption, and environmental policy
formation: theory and evidence. J Environ Econ Manag 46:490?512
Diamond PA (1965) National debt in a neoclassical growth model. Am Econ Rev 55:1126?1150 Downs A (1957) An economic theory of democracy. Harper & Row, New York
Ehrlich I, Lui FT (1999) Bureaucratic corruption and endogenous economic growth. J Polit Econ 107:S270?S293
Fredriksson PG (1997) The political economy of pollution taxes in a small open economy. J Environ Econ Manag 33:44?58
Galor O, Moav O (2004) From physical to human capital accumulation: inequality and the process of development. Rev Econ Stud 71:1001?1026
Glomm G, Ravikumar B (1992) Public versus private investment in human capital: endogenous growth and income inequality. J Polit Econ 100(4):818?834
Grossman GM, Helpman E (1994) Protections for sale. Am Econ Rev 84:833?850
Hall RE, Jones CI (1999) Why do some countries produce so much more output per worker than others. Q J Econ 114:83?116
John A, Pecchenino R (1994) An overlapping generations model of growth and the environment. Econ J 104:1393?1410
Jones L, Manuelli R (2001) Endogenous policy choice: the case of pollution and growth. Rev Econ Dyn 4:369?405
Krusell P, Rios-Rull JV (1996) Vested interests in a positive theory of stagnation and growth. Rev Econ Stud 63:301?329
Kurtzman J, Yago G, Phumiwasana T (2004) The global costs of opacity: measuring business and invest-ment risk worldwide. MIT Sloan Manag Rev 46(1):38?44
Lambsdorff JG (2007) The institutional economics of corruption and reform: theory, evidence and policy. Cambridge University Press, Cambridge
Lopez R, Mitra S (2000) Corruption, pollution, and the Kuznets environment curve. J Environ Econ Manag 40:137?150
Lucas RE Jr (1988) On the mechanics of economic development. J Monet Econ 22:3?42
Meijdam L, Verbon HAA (1997) Aging and public pensions in an overlapping-generations model. Oxf Econ Pap 49:29?42
Nash JF (1953) Two person cooperative games. Econometrica 21:128?140
Osborne MJ, Rubinstein A (1990) Bargaining and markets. Academic Press, San Diego
Ono T (2005) The political economy of environmental taxes with an aging population. Environ Resour Econ 30:165?194
Romer PM (1990) Endogenous technological change. J Polit Econ 94:S71?S102 Stokey NL (1998) Are there limits to growth? Int Econ Rev 39:1?32
Transparency International (2009) Corruption perceptions index 2009. http://www.transparency.org/ research/cpi/cpi2009/0/
Verbon HAA, Verhoeven MJM (1992) Decision making on pension schemes under rational expectations. J Econ 56:71?97