O R I G I N A L A R T I C L E
Open Access
Testing a conditional cash transfer program
in the U.S.: the effects of the family rewards
program in New York City
Cynthia Miller
*, James Riccio, Nandita Verma, Stephen Nuñez, Nadine Dechausay and Edith Yang
* Correspondence:
MDRC, 16 East 34th Street, New York, NY 10016, USA
Abstract
Family Rewards represents the first test of a Conditional Cash Transfer (CCT) program in the U.S., offering families incentives for children’s education, family preventive health care and parents’work and training. Using a randomized controlled trial, we find that the program led to substantial reductions in poverty and hardship during the 3 years in which the rewards were offered. The program also led to some effects in each of the three areas of education, health and work, although the effects were fairly modest or limited to certain subgroups.
JEL classification:I1, I2, I3, J1.
Keywords:Conditional cash transfers; Education; Health; Income
1 Introduction
Incentives have become increasingly popular in the U.S. and other countries as a way to influence individual decisions about schooling, health and work. Programs have been tested that provide incentives for students to take and perform well on standard-ized exams, to attend school, or to read books (Fryer 2011, Bettinger 2012; Angrist and Lavy 2009). Other incentives are designed to encourage patients to adhere to medica-tion regimes or to a weight loss plan (Volpp et al. 2008a, b; Sindelar 2008). The examples are numerous, and the evidence to date suggests that in many cases these incentives can affect behavior.
Incentives are also popular in lower- and middle-income countries in the form of Conditional Cash Transfer (CCT) programs. From a handful of programs in Central and South America (including Mexico’s well-known Opportunidades program), there are now CCTs in most Latin American countries and in several African and Middle Eastern countries. The programs typically offer families incentives for children’s school attendance and use of health care services, and a series of reviews suggests that they have increased service use in both areas (Fiszbein and Shady 2009; Saavedra and Garcia 2012; IEG Independent Evaluation Group 2011).
In 2007, the Center for Economic Opportunity within the New York City Mayor’s Office decided to implement and test a version of a CCT in New York City. The pro-gram, called Opportunity NYC - Family Rewards, was offered to low-income families in several high poverty neighborhoods and provided incentives (or cash rewards) for
activities and outcomes related to children’s education, family preventive health care and parents’employment. As with other CCTs, the intent of the program was to reduce family poverty and hardships in the short term through the cash transfers and in the long term by encouraging families to make these investments in their own human capital.
When the program was launched, it sparked a great deal of interest and speculation about whether a traditional CCT would work in the very different context of a high in-come country and within that, the somewhat unique context of New York City. This paper presents interim findings from the evaluation, following families for 3 to 4 years after they entered the study.1 The program is being evaluated using a randomized controlled trial in which low-income families with an entering 4th, 7th, or 9th grader were randomized either to a program group, offered the program, or to a control group that was not offered the program.
We find that the program led to substantial reductions in poverty and hardship during the 3 years that the rewards were offered. Our “intent-to-treat” estimates, for example, indicate that the program reduced the poverty rate by 11 percentage points. It also led to some behavioral responses in each of the three areas of education, health and work, although the effects were fairly modest or limited to certain subgroups. The most notable and lasting effects include an increase in grade progression and graduation rates among a subgroup of more academically prepared students who entered the study as 9th graders and an increase in dental visits among all family members. The program also led to a small increase in parents’employment rates, although much of this new work was in jobs that were not covered by the Unemployment Insurance (UI) system.
The findings add not only to the accumulating evidence on CCTs in other countries but to the growing literature studying more targeted incentives programs in the U.S. As one example, our findings for entering 9th graders are consistent with other research suggesting that the effects of incentives for school performance tend to be concentrated on higher ability students (Bettinger 2012; Angrist and Lavy 2009; Leuven et al. 2010). As another example, the potential for a CCT to reduce work effort through income effects is always a concern, and we provide evidence on the existence and magnitude of such effects for a U.S. sample. Finally, some researchers and policymakers have consid-ered building the CCT idea into the existing U.S. safety net. The findings presented here regarding the amount families earned and the program’s effects on income, pov-erty and other behaviors can inform the design of such a policy.
2 Background 2.1 Related research
The programs overall have been found to reduce short-term poverty and increase consumption, with larger effects in programs that offer bigger transfers. These pro-grams have also generally led to increases in school attendance.3The effects have been larger at the secondary level, since attendance at the primary level is already fairly high, and they have been larger in areas or countries where attendance rates would have been lowest in the absence of the program. In addition, there is some evidence that the educational impacts are larger among the poorest households. Similarly, the programs have also increased the use of health services, with parents in the program more likely than other parents to take their children to visit health clinics (Fiszbein and Shady 2009; Lagarde et al. 2007).
However, there is no consistent evidence that this increased use of services improved outcomes. A recent survey by Baird et al. (2014), for example, finds that although one or two individual programs did seem to improve test scores, overall the effect of CCTs on achievement is “small, at best.” While none of them rewarded performance per se, the expectation was that students would learn more if they attended more. Some re-searchers attribute the lack of effects to poor schools and poor home environments, neither of which was addressed by the CCTs. The exception to this finding is for very young children, where some studies suggest cognitive gains for children who were pre-school age when their families participated (Paxson and Shady 2010). Similarly, the evi-dence is mixed on whether the programs have improved children’s health. Some programs have been found to increase height among the youngest children, while others have had no effects on health status (Fiszbein and Shady 2009).
More recently, research on CCTs has started looking at longer-term effects on chil-dren’s outcomes, with encouraging findings. For example, Baez and Camacho (2011) find continued positive effects after 9 years of a Colombian CCT on graduation rates. Studying a program in Nicaragua, Barham et al. (2013) find effects after 10 years on educational attainment and test scores. Another more recent line of research has exam-ined the impact of conditional versus unconditional transfers, sometimes through meta-analyses (Baird et al. 2014) and sometimes through direct comparisons within a single experiment (Baird et al. 2011; Benhassine et al. forthcoming; Akresh et al. 2013). Although only a small number of studies, the findings suggest that both types of trans-fers have positive effects on schooling but that conditionality tends to lead to larger ef-fects, particularly for more marginal students.
A general finding from this literature is that incentives can increase student effort, at least in the short-run. For example, the Israeli program encouraged more students to take and pass required high school exams, largely by encouraging some students to spend more time studying. However, it is not always clear that this increased effort while the incentives were offered translated into higher achievement in the long-run. The program tested in rural Ohio for performance on annual, standardized tests found positive effects on math scores during the program but no effects in later years when the rewards were not offered (Bettinger 2012).
Another finding from several of these studies is that the incentives had larger effects on students on the margin of higher performance, or students who were within reach of the outcome that was rewarded (Bettinger 2012; Angrist and Lavy 2009; Leuven et al. 2010). For example, the positive effects on math test scores for elementary school students in rural Ohio were larger for students with higher pre-program math scores. The program that rewarded the passing of high school exit exams in Israel similarly had larger effects for more prepared students.
Finally, an ongoing concern with offering incentives is that they may reduce students’ intrinsic motivation to perform well in school once the incentives are removed (Deci et al. 2001). While the existing literature does not provide much evidence to suggest that performance incentives reduce students’intrinsic motivation, it is nonetheless an important outcome to consider.4
In the health domain, a growing research documents that incentives can affect a var-iety of health-related behaviors, such as weight loss (Volpp et al., 2008b), smoking (Volpp et al. 2009) and adherence to prescribed medication (Volpp et al. 2008a). In addition, one summary of studies found that the majority of incentives programs revie-wed—providing rewards in the form of cash, lotteries, gifts, or coupons—were found to affect individuals’ behavior (Kane et al. 2004). Another review suggests that the pay-ments need not be large to affect a variety of health-related outcomes (Sindelar 2008).
However, most of the U.S. studies are small, clinical trials, and most of them only studied behavior change in the short-term. In the few studies that did track long-term outcomes, the effects typically faded after the program ended. In addition, there is lim-ited evidence, to our knowledge, of studies examining incentives to obtain and maintain health insurance.
Finally, in the work domain, none of the major CCTs in low- and middle-income countries has included rewards for parents’ work or training, although there was con-cern that the provision of education and health rewards may lead to a reduction in adults’ work effort. In general, evaluations have not found negative effects on work, with the exception of one program in Nicaragua, where the rewards were quite large (Fiszbein and Shady 2009).
more people into work and in other cases by encouraging part-time workers to work full time. In several of the program studied, the effects on employment faded over time, even before the incentives had ended, meaning that the main effect of the incentives was to move individuals into work more quickly than they would have gone otherwise. However, for some groups who would have had low employment rates in the absence of the program, the effects can last longer.
The evidence for training incentives is more mixed. Some recent programs targeted to welfare recipients or low-wage workers in general have increased the take up of training and the receipt of certificates. However, the lack of sustained earnings effects for these same programs suggests that the training that people were induced to take up may not have had much return in the labor market (Hendra et al. 2011; Miller et al. 2012).
2.2 Family rewards
Family Rewards is the first CCT program to be piloted in the U.S. The program was de-signed by the Center for Economic Opportunity within the Mayor’s Office, MDRC, a nonprofit social policy evaluation firm and Seedco, a workforce and economic develop-ment organization. It offered cash rewards to low-income families for meeting a variety of activities and outcomes related to children’s educational efforts and achievement, family preventive health care practices and parents’employment. The intent of the pro-gram was to reduce family poverty and hardships in the short term through the cash transfers and in the long term by supporting and encouraging families to invest in their own health, education and employment potential. The program offered participants cash rewards for 3 years, from late 2007 to late 2010.
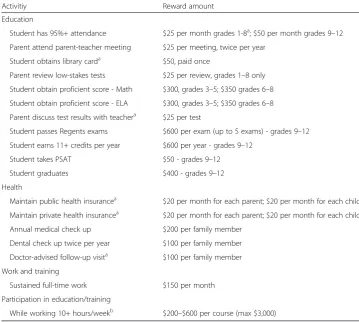
At the outset, Family Rewards offered families cash rewards for 22 different behaviors (Table 1). In the education domain, rewards were offered for parents’ attendance at parent-teacher conferences, children’s high attendance in school, their performance on standardized tests, their completion of adequate credits per year, their passing of exams required to graduate and their graduation. For example, elementary students could earn $25 every month for achieving high attendance, and high school students could earn $50 every month. Elementary school students could earn $300 per test for scoring at the proficient level or higher on their standardized Math and English Language Arts (ELA) tests, while high school students could earn $600 for every Regents exam passed (students are required to pass five exams to graduate with a New York State Regents diploma).
In the health domain, rewards were offered for maintaining health coverage and for preventive medical and dental checkups for each family member. For example, families could earn $20 each month for having public health coverage and $200 each year (per family member) for making two preventive visits to the dentist. In the work domain, parents were offered $150 per month for sustained full-time work and up to $3,000 for pursuing education or training while working.
from the health rewards and over $1,800 from the work rewards. In addition, 22 re-wards meant that families had multiple opportunities to earn money. If some rere-wards remained out of reach, others were not.
There were some modifications to the incentive schedule at the end of the second year, also noted on Table 1. In an effort to simplify the program and reduce its costs, several rewards were eliminated, including those for maintaining health coverage and for high attendance for elementary and middle school students.
Families received payments every 2 months, covering all rewards earned during a given payment period. Rewards were verified using automated data (such as test score data from the Department of Education) and coupons submitted by families (such as for visits to the doctor). Families without bank accounts were encouraged to open ac-counts in order to receive the payments electronically.5A small fraction of families pre-ferred to receive payments on stored value cards. The head of household, usually a single mother, received the payments for all health and workforce rewards earned by the family and any education rewards earned by elementary or middle school children. The parent also received half the value of some education rewards earned by high school students. For example, high school students received the full amount earned for passing Regents exams, but half of the amount earned for attendance, credits earned and graduation.
Table 1Family rewards activities and reward amounts
Activitiy Reward amount
Education
Student has 95%+ attendance $25 per month grades 1-8a; $50 per month grades 9–12 Parent attend parent-teacher meeting $25 per meeting, twice per year
Student obtains library carda $50, paid once
Parent review low-stakes tests $25 per review, grades 1–8 only Student obtain proficient score - Math $300, grades 3–5; $350 grades 6–8 Student obtain proficient score - ELA $300, grades 3–5; $350 grades 6–8 Parent discuss test results with teachera $25 per test
Student passes Regents exams $600 per exam (up to 5 exams) - grades 9–12 Student earns 11+ credits per year $600 per year - grades 9–12
Student takes PSAT $50 - grades 9–12 Student graduates $400 - grades 9–12 Health
Maintain public health insurancea $20 per month for each parent; $20 per month for each child Maintain private health insurancea $20 per month for each parent; $20 per month for each child Annual medical check up $200 per family member
Dental check up twice per year $100 per family member Doctor-advised follow-up visita $100 per family member Work and training
Sustained full-time work $150 per month Participation in education/training
While working 10+ hours/weekb $200–$600 per course (max $3,000)
a
Reward dropped for program Year 3
b
A final feature of the program is that it offered no services or proactive counseling. Staff at the CBOs did not develop plans with families to earn the rewards, follow up with families during the program, or provide direct services, such as tutoring, test prep-aration, or job search assistance, although they could refer individuals to these services. Services were excluded from the model in order to test the incentives offer alone. In addition, it was expected that families in New York City would have access to services through other programs in the community.
2.3 The evaluation
Seedco administered and oversaw the program. The agency selected six community based organizations (CBOs) in each targeted community district to recruit families and implement the program. The CBOs began recruiting families for the study in July 2007, using lists of likely eligible families obtained from the New York City Department of Education. The lists contained the names and contact information for families who lived in the targeted areas, who had children expected to enter 4th, 7th, or 9th grade in September 2007 and whose children were enrolled in the National School Lunch pro-gram, which was open to families with incomes at or below 130% of the federal poverty line. Staff enrolled approximately 4,800 families between July and December 2007, with most families entering before October 2007.
Families were assigned at random to the program group, eligible to enroll in Family Rewards, or a control group. Once in the program, all children in the family were eli-gible for the education and health rewards. The study sample includes over 11,000 chil-dren, the majority of whom are in the three target grades.
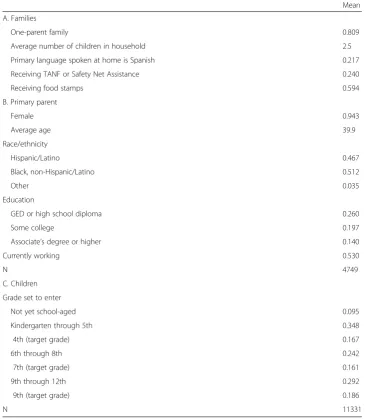
Table 2 presents selected characteristics of the sample at baseline. The majority (81%) of families are headed by a single parent (typically the mother), and the families are fairly large, with an average of 2.5 children. The sample consists primarily of Hispanic or Black families, representing the racial and ethnic makeup of the targeted neighborhoods. About 60% of parents had a GED or higher education level at study entry, and half of them were working.
The bottom panel presents the data on school level for all children enrolled in the study. About half of the children were set to enroll in one of the three target grades (4th, 7th, or 9th) at study entry, while the remainder was either too young for school or set to enroll in another grade. As noted below, for ease of interpretation, we focus the analysis of school outcomes on children entering the target grades. The findings were similar when we included children in all grades.
2.4 Program implementation
The implementation of the program was examined through site visits, interviews with staff and participants and analyses of payment data and program documents. Overall, the program was implemented as designed, particularly by year 2 when the early oper-ational challenges were overcome. Several features of the design and implementation may affect how families interact with the program and its ultimate effects.
about the full spectrum of program rules and documentation requirements. The unpected challenge of recruiting eligible and interested families into the study, for ex-ample, overlapped with the task of getting the program up and running in the first few months. As a result, the CBOs were sometimes not able to provide families with ad-equate orientations to the program. Although site visits determined that most of the CBOs delivered this information in a clear and concise way, these initial orientations varied in quality. Staff were sometimes challenged to explain detailed rules for the pro-gram’s different activities while also welcoming them and encouraging them to take ad-vantage of the program.
Data from the 18-month survey indicate that parents had a good but very general un-derstanding of the rewards. As an example, over 90% of parents reported knowing that a reward was offered for their children’s good attendance, but only 27% of parents knew that the reward required attending 95% of school days. Also, about 60% of parents re-ported that the program included a reward for good behavior in school, when it did not. Table 2Selected characteristics at baseline
Mean A. Families
One-parent family 0.809
Average number of children in household 2.5
Primary language spoken at home is Spanish 0.217
Receiving TANF or Safety Net Assistance 0.240
Receiving food stamps 0.594
B. Primary parent
Female 0.943
Average age 39.9
Race/ethnicity
Hispanic/Latino 0.467
Black, non-Hispanic/Latino 0.512
Other 0.035
Education
GED or high school diploma 0.260
Some college 0.197
Associate’s degree or higher 0.140
Currently working 0.530
N 4749
C. Children Grade set to enter
Not yet school-aged 0.095
Kindergarten through 5th 0.348
4th (target grade) 0.167
6th through 8th 0.242
7th (target grade) 0.161
9th through 12th 0.292
9th (target grade) 0.186
N 11331
In addition, program staff did not initially push parents to attempt more challenging activities, but, instead, encouraged them to obtain rewards for the activities they were already doing. Thus, some parents may have avoided focusing on certain activities, such as work and test-taking, which they may have felt were less in their control. The large number of rewards may have also overwhelmed participants and encouraged them to focus on just a few.
Second, a basic tenet of learning theory emphasizes the need for rewards to be close in time to the desired behavior (Skinner 1974). Although a cash transfer system was successfully developed, there were inevitable delays between meeting certain conditions and reward receipt, even beyond the regular two-month program payment cycle. For example, the results of the annual standardized ELA and math tests were not available until months after the tests were taken because of the time required by New York State to grade the exams and for New York City to process the results and provide the data to the program. This delay may reduce the salience of these particular rewards.
Finally, trust between the reward giver and the reward seeker has been identified as a potential factor influencing motivation (Benabou and Tirole 2003). Although the types of frustrations experienced by some Family Rewards participants are not unusual for cash transfer programs, which might diminish motivation, the CBOs and the helpline created a good degree of trust for the program—through dedicated customer service, community-building social events and clear explanations of rules for payment and their legitimacy. Customer service and support was provided in two ways. Participants could either call the helpline or they could call or visit the CBOs. The helpline provided bilin-gual support to Family Rewards participants, primarily to answer questions about payment.
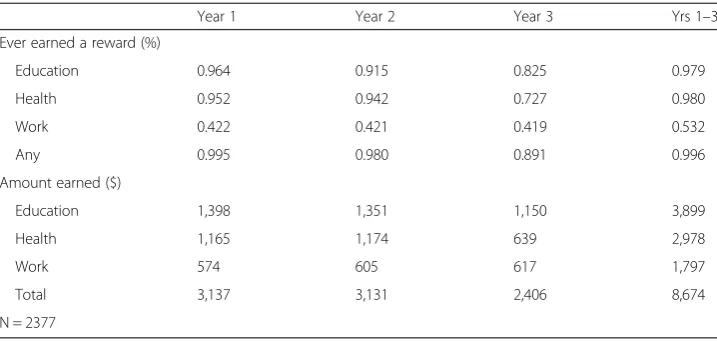
Table 3 presents reward receipt rates and amounts for families in the program group. Nearly all families received at least some rewards in the education and health domains, while only about half ever earned a work reward. The average family earned over $3,100 in the first 2 years of the program and $2,400 in year 3. Dollar amounts include zeroes for families that did not earn any rewards. The fall in receipt rates between years two and three reflects the elimination of the attendance reward for younger students and the reward for maintaining health insurance.
Table 3Rewards earned by families in the program group
Year 1 Year 2 Year 3 Yrs 1–3
Ever earned a reward (%)
Education 0.964 0.915 0.825 0.979
Health 0.952 0.942 0.727 0.980
Work 0.422 0.421 0.419 0.532
Any 0.995 0.980 0.891 0.996
Amount earned ($)
Education 1,398 1,351 1,150 3,899
Health 1,165 1,174 639 2,978
Work 574 605 617 1,797
Total 3,137 3,131 2,406 8,674
N = 2377
3 Data and methods 3.1 Data
We use data from several sources. First, all participants filled out a baseline survey prior to study entry, providing demographic and other information for adults and chil-dren in the household. Records data are available from the New York City Department of Education for the full sample of school-aged children, with information on attend-ance rates, test scores, credits earned, Regents exam scores and graduation. Records data are also available from the agency managing the payment system on reward pay-ments made to families throughout the three-year period. Unemployment Insurance (UI) records provide information for every adult in the sample on quarterly earnings re-ported to the UI system. As is well-known, these records miss some types of employ-ment that are either exempt from reporting to the UI system (self-employemploy-ment, federal government employment, domestic work) or underreported (Abraham et al. 2013).
Two surveys were fielded to a randomly selected subset of the full sample, at 18 and 42 months after study entry. The surveys included modules covering participants’ un-derstanding of and experiences with the program, income and material hardship, em-ployment and earnings, health care status and use of health services and parental engagement in children’s schooling. The survey sample was drawn by first selecting families who had entered the study by October 31, 2007, representing 86% of all fam-ilies in the study. This sample was then stratified by the entering grade of the target children, e.g., 4th, 7th, or 9th grade. Then a random subset of 1,250 families was se-lected for the survey from each stratum, for a total fielded sample of 3,750 families. Fi-nally, given the length of the survey, certain modules were administered to randomly selected subsets of the full sample.
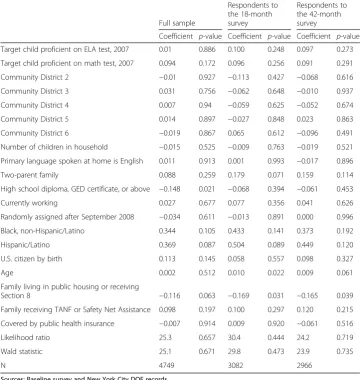
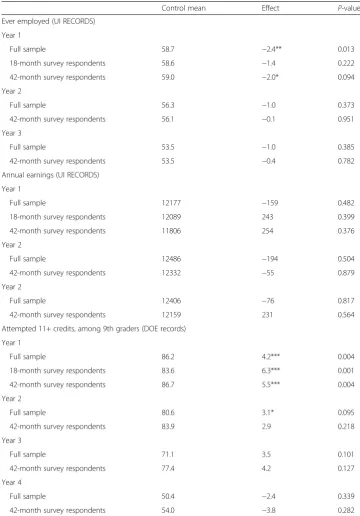
The 18-month survey achieved a response rate of 84% for the program group and 80% for the control group. The 42-month survey achieved response rates of 82% for the program group and 76% for the control group. Both of these differences are statis-tically significant. Nonetheless, the survey samples are generally representative of the full sample, and program and control group respondents are well-matched on baseline characteristics (see Table 4). In addition, we performed two checks to assess the balance and representativeness of the survey samples. First, we compared effects on administra-tive records outcomes for the full sample and the two survey samples. The impacts were generally similar across the three samples (see Table 5). Second, we assessed the sensitivity of the results to weighting, with weights equal to the inverse probability of predicted response for each survey. In general, the results were very similar using weighted data. The one exception was for selected health effects for the 18-month sur-vey. In general, however, the results of these analyses suggest that the survey samples provide valid estimates of program effects and are representative of the full research sample.
3.2 Methods
We use the following equation to estimate the effects of being offered the Family Rewards program:
yihc¼βoþβ1Thcþβ2Xihcþcdcþεih;
Thc is an indicator variable for whether or not the household was assigned to the Family Rewards group or to the control group. The vectorXihcincludes family and indi-vidual covariates that are correlated with the outcomes of interest and are included for in-creased precision.6Family-level variables include family structure, number of children and primary language spoken at home. Parent-level variables include race/ethnicity, educa-tional attainment, marital status and prior work experience. Whenyihcincludes outcomes in the education domain for children,Xihcalso includes the child’s gender, special edu-cation status and scores for the Math and ELA tests in the year prior to entering the study. The coefficient on Thc is the key coefficient of interest and represents the effect of the program offer. The variable cdc includes community district fixed effects. Standard errors are clustered at the household level for models that esti-mate effects on individual outcomes.
Given that families were assigned at random to receive the offer of Family Rewards, β1represents an unbiased estimate of the effect of the program offer. Unbiased effects can be estimated in this way, assuming that the randomization process was carried out successfully and that the treatment and control groups are similar on baseline Table 4Program-control balance (Logit estimates)
Full sample
Respondents to the 18-month survey
Respondents to the 42-month survey
Coefficient p-value Coefficient p-value Coefficient p-value Target child proficient on ELA test, 2007 0.01 0.886 0.100 0.248 0.097 0.273 Target child proficient on math test, 2007 0.094 0.172 0.096 0.256 0.091 0.291 Community District 2 −0.01 0.927 −0.113 0.427 −0.068 0.616 Community District 3 0.031 0.756 −0.062 0.648 −0.010 0.937 Community District 4 0.007 0.94 −0.059 0.625 −0.052 0.674 Community District 5 0.014 0.897 −0.027 0.848 0.023 0.863 Community District 6 −0.019 0.867 0.065 0.612 −0.096 0.491 Number of children in household −0.015 0.525 −0.009 0.763 −0.019 0.521 Primary language spoken at home is English 0.011 0.913 0.001 0.993 −0.017 0.896
Two-parent family 0.088 0.259 0.179 0.071 0.159 0.114
High school diploma, GED certificate, or above −0.148 0.021 −0.068 0.394 −0.061 0.453
Currently working 0.027 0.677 0.077 0.356 0.041 0.626
Randomly assigned after September 2008 −0.034 0.611 −0.013 0.891 0.000 0.996 Black, non-Hispanic/Latino 0.344 0.105 0.433 0.141 0.373 0.192
Hispanic/Latino 0.369 0.087 0.504 0.089 0.449 0.120
U.S. citizen by birth 0.113 0.145 0.058 0.557 0.098 0.327
Age 0.002 0.512 0.010 0.022 0.009 0.061
Family living in public housing or receiving
Section 8 −0.116 0.063 −0.169 0.031 −0.165 0.039
Family receiving TANF or Safety Net Assistance 0.098 0.197 0.100 0.297 0.120 0.215 Covered by public health insurance −0.007 0.914 0.009 0.920 −0.061 0.516
Likelihood ratio 25.3 0.657 30.4 0.444 24.2 0.719
Wald statistic 25.1 0.671 29.8 0.473 23.9 0.735
N 4749 3082 2966
Sources: Baseline survey and New York City DOE records
characteristics. As shown in Table 4, there are few differences in characteristics between the program and group groups, for the full sample and for each of the two survey re-spondent samples. In addition, thep-values for the logit models predicting program group status are above .40 for each of the three samples (see second from last row).
Table 5Effects for the full and survey respondent samples
Control mean Effect P-value
Ever employed (UI RECORDS) Year 1
Full sample 58.7 −2.4** 0.013
18-month survey respondents 58.6 −1.4 0.222
42-month survey respondents 59.0 −2.0* 0.094
Year 2
Full sample 56.3 −1.0 0.373
42-month survey respondents 56.1 −0.1 0.951
Year 3
Full sample 53.5 −1.0 0.385
42-month survey respondents 53.5 −0.4 0.782
Annual earnings (UI RECORDS) Year 1
Full sample 12177 −159 0.482
18-month survey respondents 12089 243 0.399
42-month survey respondents 11806 254 0.376
Year 2
Full sample 12486 −194 0.504
42-month survey respondents 12332 −55 0.879
Year 2
Full sample 12406 −76 0.817
42-month survey respondents 12159 231 0.564
Attempted 11+ credits, among 9th graders (DOE records) Year 1
Full sample 86.2 4.2*** 0.004
18-month survey respondents 83.6 6.3*** 0.001
42-month survey respondents 86.7 5.5*** 0.004
Year 2
Full sample 80.6 3.1* 0.095
42-month survey respondents 83.9 2.9 0.218
Year 3
Full sample 71.1 3.5 0.101
42-month survey respondents 77.4 4.2 0.127
Year 4
Full sample 50.4 −2.4 0.339
42-month survey respondents 54.0 −3.8 0.282
Sources: Baseline survey and UI and DOE records
Impacts are shown for the 18-month respondents only for Year 1. Each estimate represents the coefficient on program status from a linear regression controlling for selected baseline characteristics. Standard errors are adjusted for clustering at the household level
4 Results
4.1 Income and material hardship
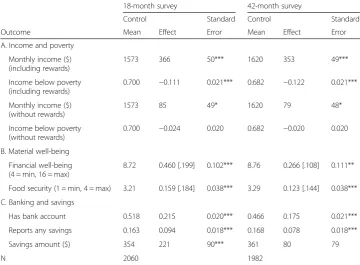
Table 6 presents the program’s effects on income and material hardship, using data from the 18- and 42-month surveys. A measure of income including rewards is based on the survey question asking respondents about total income in the month prior to the survey. We then estimate rewards earned per month by dividing rewards earned in year 2 (or year 3 for the 42-month survey) by 12.7Income including rewards at the 42-month point, therefore, is an estimate of the program’s effect during the third year of the program. In contrast, income without rewards at the 42-month point indicates fam-ilies’status after they were no longer receiving rewards.
The program increased monthly income by over 20%, or by about $360, in each period, effects that were statistically significant at the 1% level. Similarly, the program led to a reduction in poverty of 11 percentage points to 12 percentage points. Although not shown in the table, the program also led to a reduction in severe poverty (or in-come below 50% of the poverty line), indicating that its effects were fairly widespread across the income distribution.
When rewards are not included in the measure of income, the program’s effects be-come much smaller (a 5% increase) but are still positive and statistically significant at the 10% level, owing to an increase in the fraction of respondents’who reported having
Table 6Effects on poverty and material well-being
18-month survey 42-month survey
Control Standard Control Standard
Outcome Mean Effect Error Mean Effect Error
A. Income and poverty Monthly income ($) (including rewards)
1573 366 50*** 1620 353 49***
Income below poverty (including rewards)
0.700 −0.111 0.021*** 0.682 −0.122 0.021***
Monthly income ($) (without rewards)
1573 85 49* 1620 79 48*
Income below poverty (without rewards)
0.700 −0.024 0.020 0.682 −0.020 0.020
B. Material well-being Financial well-being (4 = min, 16 = max)
8.72 0.460 [.199] 0.102*** 8.76 0.266 [.108] 0.111**
Food security (1 = min, 4 = max) 3.21 0.159 [.184] 0.038*** 3.29 0.123 [.144] 0.038*** C. Banking and savings
Has bank account 0.518 0.215 0.020*** 0.466 0.175 0.021*** Reports any savings 0.163 0.094 0.018*** 0.168 0.078 0.018***
Savings amount ($) 354 221 90*** 361 80 79
N 2060 1982
Sources: Baseline survey and 18- and 42-month surveys
Each estimate represents the coefficient on program status from a linear regression, controlling for baseline characteristics. Statistical significance is indicated as follows: *** = 1 %; ** = 5 %; * = 10 %. Effects measured in standard deviations (effect sizes) are presented in [brackets]
Financial well-being is coded as the sum of responses to four questions about respondents’current financial status, such as“My financial situation is better than it’s been in a long time”and“I worry about having enough money in the future.” Responses were coded such that a lower score indicates greater financial strain
earnings. At the 42-month point, for example, the program increase the fraction of re-spondents’ reporting own earnings by 9 percentage points, significant at the 1% level. However, without the reward, the program had no effects on poverty rates.
The second panel of the table presents effects on two measures of material hardship—a scale score based on parents’ responses to four questions asking about their current financial situation and a measure of food security based on responses to a question about the adequacy of food in the household over the prior month. The program led to small reductions in these measures of hardship, with effects ranging from .10 to .19 standard deviations. Food security status at the 42-month point is the only measure in this panel that is capturing status post-program, suggesting a continued effect at least through the fourth year.8Although the table only reports two measures of material hardship, the program also reduced hardship as measured by several other measures (not reported), such as borrowing from family or friends or using a pawn shop.
The final panel presents effects on banking and savings. When they entered the study, just over 50% of parents had a bank account. By encouraging families to open bank accounts in order to receive rewards payments and offering them an attractive al-ternative to a typical bank account, the program led to a substantial increase in the number of families who were “banked.” Similarly, only about 16% of families in the control group reported having any savings at the time of the survey, and the program increased the incidence of savings by about 8 percentage points at the 42-month point. On average, families in the control group reported about $360 in savings at both survey points, including zeros for those with no savings. While the program increased average savings at the 18-month point, the effect was small and statistically insignificant by the 42-month point. We also examine the program’s effects on debt and found no signifi-cant effects on the amount or repayment of debt.
While the program did lead to substantial increases in income while families received rewards, the findings do not suggest that these effects will continue into the longer term. Post-program effects on well-being were predicated on the existence of increased work by parents or by increased savings, and effects on both of these outcomes, al-though statistically significant, are relatively small.
4.2 Education
The education rewards were designed to affect educational inputs and outputs. Stu-dents were incentivized to attend school regularly, obtain a library card, take a full course load and peform well on relevant exams. Parents were rewarded for attendance at parent-teacher conferences, in an attempt to increase parental involvement. As noted above, a family consisting of a single mother with two older children could earn more than $3,000 per year if they earned all of the offered education rewards.
Although not shown here, data from the two surveys show that the program overall had a very small effects on parental engagement. In addition, the increases in parents’ attendance at parent-teacher conferences or an increase in the rate at which parents re-ported interacting with their children around school (e.g., checking homework, help preparing for tests) were on top of very high levels of engagement among parents in the control group. The most consistent effect across all age groups was an increase in the number of students who had a library card and who visited the library (obtaining a library card was a rewarded activity).
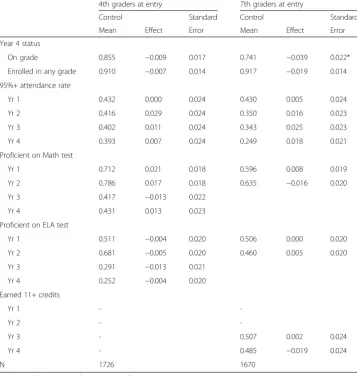
Data from the New York City DOE records indicate that the program had no effect on the school performance of entering 4th and 7th graders. The left panel of Table 7 presents results for entering 4th graders. The data show that 86% of these 4th graders were on grade in the fourth year of follow-up, or enrolled in 7th grade, as they should have been if promoted each year. The program had no effects on enrollment status or grade promotion.
Similarly, point estimates for attendance and proficiency rates on math and ELA tests are small and statistically insignificant.9Students in New York City schools take annual standardized tests in the 3rd through 8th grades and their proficiency rates are deter-mined by score cutoffs set by the New York State Department of Education. (Although the table only presents effects on proficiency rates, effects were also small and statisti-cally insignificant for average test scores).
The table shows that proficiency rates on these two tests fall dramatically for students in the control group between the second and third years of follow-up. For example, 79% of these students were proficient on Math in Year 2, while only 42% were profi-cient in Year 3. In 2010, amid concerns that these tests had become too easy and were not reflective of the proficiency needed in each grade, the New York State Department of Education raised the scores necessary to be deemed proficient. In 2009 and earlier, a score a 650 or higher was required in order to be deemed proficient. Starting in 2010, the cutoff scores were raised to 658–684, depending on the grade level and the test. As a result, proficiency rates citywide fell dramatically between 2009 and 2010, as they did for students in the Family Rewards study.10
The right hand panel presents findings for entering 7th graders. For this group, stan-dardized test scores are shown only in the first 2 years, since most of this cohort should have entered 9th grade by year 3, when the relevant tests are Regents exams. By Year 4, only 74% of the students in the control group were in the 10th grade. Most of the remaining 26% of students had been held back at some point and were enrolled in an earlier grade, and the remaining students had transferred out of the New York City public school system. The Family Rewards program had no overall effects for entering 7th graders.
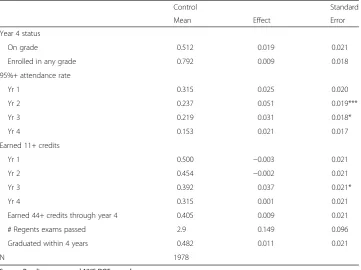
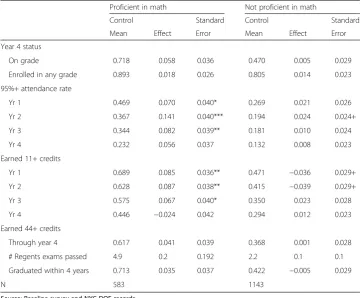
Table 8 presents effects for entering 9th graders. Overall, the program had little effect for this group, with the most consistent effects being small increases in high attendance in years one and two. In terms of completion rates, only 48% of this cohort of entering 9th graders had graduated high school by the end of Year 4, and the program had no effect on this outcome.
and the student’s own prior year academic performance (measured by whether he or she scored at the proficient level or higher on the math or ELA exams).11 For 4th graders and 7th graders, there was no significant variation in effects across these di-mensions. For 9th graders, effects did not differ by parents’ education level or school environment, but they did differ by the student’s prior year’s test performance.
The findings are presented in Tables 9 and 10. The left panel presents effects for en-tering 9th graders who scored at the proficient level on the given test, while the right panel presents effects for their non-proficient counterparts. The tables also show sig-nificance levels of tests for the differences in effects between the proficient and less proficient groups. As shown by the ‘+’symbols, nearly all of the differences in effects by ELA proficiency are statistically significant, while only a handful are significant by math proficiency. When considering how to define academic preparedness, it was not obvious which test to use—ELA or math—so we present both results in the table. While scores on the two tests are highly correlated, about 40% of students who were Table 7Effects on school progress - entering 4th and 7th graders
4th graders at entry 7th graders at entry
Control Standard Control Standard
Mean Effect Error Mean Effect Error
Year 4 status
On grade 0.855 −0.009 0.017 0.741 −0.039 0.022*
Enrolled in any grade 0.910 −0.007 0.014 0.917 −0.019 0.014 95%+ attendance rate
Yr 1 0.432 0.000 0.024 0.430 0.005 0.024
Yr 2 0.416 0.029 0.024 0.350 0.016 0.023
Yr 3 0.402 0.011 0.024 0.343 0.025 0.023
Yr 4 0.393 0.007 0.024 0.249 0.018 0.021
Proficient on Math test
Yr 1 0.712 0.021 0.018 0.596 0.008 0.019
Yr 2 0.786 0.017 0.018 0.635 −0.016 0.020
Yr 3 0.417 −0.013 0.022
Yr 4 0.431 0.013 0.023
Proficient on ELA test
Yr 1 0.511 −0.004 0.020 0.506 0.000 0.020
Yr 2 0.681 −0.005 0.020 0.460 0.005 0.020
Yr 3 0.291 −0.013 0.021
Yr 4 0.252 −0.004 0.020
Earned 11+ credits
Yr 1 -
-Yr 2 -
-Yr 3 - 0.507 0.002 0.024
Yr 4 - 0.485 −0.019 0.024
N 1726 1670
Source: Baseline survey and NYC DOE records
Each estimate represents the coefficient on program status from a linear regression, controlling for selected baseline characteristics
proficient in ELA were not proficient in math. Given the concerns raised by testing multiple hypotheses, the results should be interpreted with the appropriate caveats. However, they do show a similar pattern of larger program effects for more academic-ally prepared students.
Effects on high attendance, for example, range from 10 percentage points to 13 per-centage points for the ELA-proficient group and are somewhat smaller for the math-proficient group. For both groups, the effects on attendance and credits earned end after year 3. The program seems to have encouraged students to accumulate credits ne-cessary for graduation (44 credits) more quickly, allowing them to cut back to the typ-ical credits taken without the incentive in their final year.
The ELA-proficient group also shows a significant increase in completion. Among these students, those in the program group were more likely to have earned at least 44 credits by the end of Year 4 (by 9.6 percentage points) and more likely to have gradu-ated (by 8 percentage points). Both effects are significant at the 5% level and both ef-fects are significantly different from the corresponding differences found for their non-proficient counterparts. The effect on the graduation rate is fairly large and rivals effects found in more intensive, school-based interventions (Bloom and Unterman 2012). In contrast, the program had no effects on these outcomes for the math-profi-cient group.
While these results are consistent with other studies in finding larger effects for more prepared students, it is not clear why the effects here are larger and more consistent for students proficient in ELA. Given that reading and language skills are relevant and Table 8Effects on school progress - entering 9th graders
Control Standard
Mean Effect Error
Year 4 status
On grade 0.512 0.019 0.021
Enrolled in any grade 0.792 0.009 0.018
95%+ attendance rate
Yr 1 0.315 0.025 0.020
Yr 2 0.237 0.051 0.019***
Yr 3 0.219 0.031 0.018*
Yr 4 0.153 0.021 0.017
Earned 11+ credits
Yr 1 0.500 −0.003 0.021
Yr 2 0.454 −0.002 0.021
Yr 3 0.392 0.037 0.021*
Yr 4 0.315 0.001 0.021
Earned 44+ credits through year 4 0.405 0.009 0.021
# Regents exams passed 2.9 0.149 0.096
Graduated within 4 years 0.482 0.011 0.021
N 1978
Source: Baseline survey and NYC DOE records
Each estimate represents the coefficient on program status from a linear regression, controlling for selected baseline characteristics
necessary for all school subjects, it is easy to imagine that these students were the most prepared to respond to the incentives offered by the program. On the other hand, as the data for the control groups show, students proficient in math do as well as (or bet-ter than) than those proficient in ELA, with slightly higher graduation rates. In this case, the ELA-proficient group may simply contain more “marginal”students, or those who would do better in school if they exerted additional effort.
4.3 Health
The health rewards were designed to increase the rate of preventive care obtained by low-income families by encouraging parents to obtain and maintain health coverage and to make routine preventive doctor and dentist visits for themselves and their chil-dren. It was hoped that increased coverage and preventive care would then lead to less reliance on emergency rooms for health problems, more treatment of existing condi-tions and improved health status.
Table 11 presents effects on health coverage, use and status for parents. The high levels of health coverage and preventive care among parents in the control group was somewhat surprising. At the 18-month point, 94% of parents reported having health coverage, and 92% reported having had a check up in the past year. Data from a na-tionally representative sample of food stamp recipients, a comparable sample, show Table 9Effects on school progress for 9th graders, by 8th grade math score
Proficient in math Not proficient in math
Control Standard Control Standard
Mean Effect Error Mean Effect Error
Year 4 status
On grade 0.718 0.058 0.036 0.470 0.005 0.029
Enrolled in any grade 0.893 0.018 0.026 0.805 0.014 0.023 95%+ attendance rate
Yr 1 0.469 0.070 0.040* 0.269 0.021 0.026
Yr 2 0.367 0.141 0.040*** 0.194 0.024 0.024+
Yr 3 0.344 0.082 0.039** 0.181 0.010 0.024
Yr 4 0.232 0.056 0.037 0.132 0.008 0.023
Earned 11+ credits
Yr 1 0.689 0.085 0.036** 0.471 −0.036 0.029+
Yr 2 0.628 0.087 0.038** 0.415 −0.039 0.029+
Yr 3 0.575 0.067 0.040* 0.350 0.023 0.028
Yr 4 0.446 −0.024 0.042 0.294 0.012 0.023
Earned 44+ credits
Through year 4 0.617 0.041 0.039 0.368 0.001 0.028
# Regents exams passed 4.9 0.2 0.192 2.2 0.1 0.1
Graduated within 4 years 0.713 0.035 0.037 0.422 −0.005 0.029
N 583 1143
Source: Baseline survey and NYC DOE records
Each estimate represents the coefficient on program status from a linear regression, controlling for selected baseline characteristics
Standard errors are adjusted for clustering at the household level Statistical significance is indicated as follows: *** = 1 %; ** = 5 %; * = 10 %
coverage rates of 81% (Cole and Fox 2004). The high rate in New York City likely re-flects efforts by the City and State over the past decade to improve access to health care coverage and to improve the health delivery system for low- and moderate-income families.12 In addition, the study sample does not include undocumented immigrants or singles without children, two groups with historically low coverage rates.
At the 18-month point, the program led to small improvements in several health in-puts and outcomes. Parents in the program group were more likely than those in the control group to have health insurance, to have visited the dentist and to report treat-ing a specific health condition. They also reported better health, with an effect of .08 standard deviations on the self-reported health status scale. By the 42-month point, however, only the effects on health coverage and dental visits had persisted. There is also some suggestion that parents in the program group reported better mental health, as measured by effects on the state of hope scale. The effect on this scale at the 18-month point was significant at the 11% level.13
Effects for children are shown in Table 12. The program’s strongest and most consist-ent effect was also to increase the rate of dconsist-ental visits. Over 85% of children in the control groups had visited a dentist at least once during the year. As the table indicates, however, a much lower percent makes the recommended two visits. The importance of Table 10Effects on school progress for 9th graders, by 8th grade English Language Arts (ELA) score
Proficient in ELA Not proficient in ELA
Control Standard Control Standard
Mean Effect Error Mean Effect Error Year 4 status
On grade 0.682 0.101 0.038*** 0.503 −0.019 0.028
Enrolled in any grade 0.890 0.019 0.028 0.813 0.014 0.023++ 95%+ attendance rate
Yr 1 0.423 0.126 0.041*** 0.295 0.001 0.026++
Yr 2 0.339 0.131 0.041*** 0.215 0.028 0.024++
Yr 3 0.308 0.095 0.040** 0.203 0.01 0.023+
Yr 4 0.230 0.052 0.038 0.143 0.005 0.021
Earned 11+ credits
Yr 1 0.661 0.102 0.039*** 0.495 −0.046 0.028+++
Yr 2 0.585 0.129 0.041*** 0.445 −0.065 0.028**/+++
Yr 3 0.534 0.118 0.042*** 0.379 −0.001 0.028++
Yr 4 0.438 −0.009 0.045 0.31 0.001 0.027
Earned 44+ credits
Through year 4 0.566 0.096 0.042** 0.398 −0.028 0.028++ # Regents exams passed 4.6 0.5 0.189** 2.5 −0.01 0.124++ Graduated within 4 years 0.669 0.080 0.040** 0.459 −0.028 0.028++
N 527 1173
Source: Baseline survey and NYC DOE records
Each estimate represents the coefficient on program status from a linear regression, controlling for selected baseline characteristics
Standard errors are adjusted for clustering at the household level Statistical significance is indicated as follows: *** = 1 %; ** = 5 %; * = 10 %
oral health has been well-documented, in addition to disparities by income level in ac-cess to oral health services (Fisher-Owens et al. 2008). Poor oral health can affect chil-dren in the short run but can also lead to a number of more serious medical conditions as they age.14Medicaid covers a portion of dental visit costs, but many dentists do not accept patients covered by public insurance. Although there are a number of clinics in New York City offering free or reduced-cost dental care, getting preventive dental care nonetheless requires that low-income families search out these clinics and pay some-times a small cost for this care.
4.4 Work and training
Family Rewards encouraged work by offering participants $300 every 2 months if they worked at least 30 hours per week for six out of every 8 weeks. For a parent working 40 hours per week at $8 per hour, for example, the reward effectively increases her net wage by 11%, to $8.90 per hour. Offering incentives for work and training is not a new idea, and there is evidence from earlier programs that these incentives can increase work and, in some cases, training (Hendra et al. 2011; Martinson and Hendra 2006; Michalopoulos 2005). What is new, however, is that these incentives are part of a larger package of rewards. This structure, in which families can earn rewards through a range of activities, has two potential implications for the program’s effects on work. First, the large menu of options might encourage individuals to focus on some, easier to achieve, activities to the exclusion of other, more challenging activities. Second, the additional money families earn from the other rewards may reduce work effort through income effects.
Table 13 presents effects on employment and earnings, using data from the surveys and UI records. The program led to an increase in parents’ reported employment on the survey, at both the 18- and 42-month points. Data on the job held at the 42-month point show that the program also increased full-time employment by 5.5 percentage points, suggesting that most of the additional employment induced by the program Table 11Effects on parents’health care and status
18-month survey 42-month survey
Control Standard Control Standard Mean Effect Error Mean Effect Error A. Health coverage and use
Had health insurance in prior month 0.937 0.019 0.008** 0.929 0.027 0.009*** Had health check up in past year 0.917 0.015 0.01 0.889 0.011 0.014 Had 2+ dental visits in past year 0.579 0.095 0.018*** 0.335 0.118 0.022*** B. Health status
Self-rated health status (1 = poor; 5 = excellent) 3.1 0.093 0.037** 3.1 0.064 0.046 Being treated for medical condition 0.444 0.028 0.017* 0.478 0.023 0.021 State of hope scale (6 = min; 24 = max) 17.3 0.198 0.123 17.5 0.339 0.119***
N 3082 1961
Sources: Baseline survey and 18- and 42-month surveys
Each estimate represents the coefficient on program status from a linear regression, controlling for selected baseline characteristics
Statistical significance is indicated as follows: *** = 1 %; ** = 5 %; * = 10 %
(7.1 percentage points) was full-time work. This effect is expected, given that the work rewards were only earned if parents worked 30 or more hours per week.
The bottom panel of the table, showing UI data, tells a different story. The program appears to have reduced employment in the first year, with no effects thereafter. Family Rewards offered incentives for all types of full-time employment, so it is not clear why it would only increase employment in jobs not reported to the UI system, particularly since individuals had to present adequate documentation in order to earn rewards.15 Other research suggests that the UI data may miss relatively more employment for low-income populations than for higher-income groups (Abraham et al. 2013). In addition, smaller employers and employers with high turnover, who tend to employ rela-tively high numbers of less-skilled workers, tend to underreport earnings to the UI system more than other types of employers (Burgess et al. 1998).
To look more at the different effects given by the two data sources, we examined ef-fects on several job characteristics, as reported on the surveys. As shown in the top panel of the table, the program increased the rate of self-employment by 2.3 percentage points, suggesting that at least a third of the additional work caused by the program is not expected to appear on UI records. On the other hand, the program increased em-ployment in jobs that offer health insurance by 3 percentage points, suggesting that al-most half of the additional jobs are“formal”jobs that should appear on UI records.
We also looked in more detail at the types of jobs respondents held at the 42-month point by whether their employment status matched on both data sources. The data re-veal that more than a third of the jobs that are reported on the survey but not on UI records are in child care, which may be more likely to be paid in cash or not reported by employers. In contrast, for respondents for whom both sources indicate employ-ment, only 2.3% of the employment was in child care. The inconsistency between the Table 12Effects on children’s health care use and status
18-month survey 42-month survey
Control Standard Control Standard
Mean Effect Error Mean Effect Error
Had health check up in past year
4th graders 0.957 0.017 0.012 0.967 0.005 0.011
7th graders 0.960 0.030 0.010*** 0.936 0.038 0.014***
9th graders 0.958 0.030 0.014 0.943 −0.003 0.017
Had 2+ dental visits in past year
4th graders 0.634 0.042 0.032 0.464 0.150 0.032***
7th graders 0.596 0.104 0.032*** 0.469 0.148 0.034***
9th graders 0.572 0.131 0.033*** 0.441 0.188 0.035***
Parent-rated health status
4th graders 3.90 0.019 0.067 3.97 0.018 0.066
7th graders 3.92 0.047 0.067 3.92 0.134 0.069*
9th graders 3.81 0.068 0.069 3.86 0.039 0.073
Sources: Baseline survey and 18- and 42-month surveys
Each estimate represents the coefficient on program status from a linear regression, controlling for selected baseline characteristics
Statistical significance is indicated as follows: *** = 1 %; ** = 5 %; * = 10 %
two sources remains puzzling, although some of it can be explained by self-employment and perhaps employment in the types of jobs that are more likely to be underreported to the UI system.
To examine heterogeneity in effects, we estimated effects for parents defined by their education level and employment status at study entry. The results are shown in Table 14. For parents with higher education levels or more work experience, the em-ployment effects were more positive than for their more disadvantaged counterparts, although the differences in impacts across the groups are not statistically significant. For those with less education and experience, the program led to small increases in survey-reported employment and reductions in UI-reported work. The reduction in earnings for the less educated subgroup is concerning. It is not surprising, however, that those individuals least connected to the labor force may be most likely to reduce their work effort in response to income earned from the education and health rewards.
Finally, the program did lead to a small increase in the receipt of certificates and as-sociates degrees (Table 15). These effects are most likely due to parents’increased in-comes rather than the training incentives per se, since very few parents received the training rewards. Only 6% of parents earned at least one training reward over the three-year program period.
5 Discussion
Family Rewards represents the first test of a comprehensive CCT in the United States. The program tied cash rewards for low-income families to a variety of activities related Table 13Effects on parents’employment and earnings
Control Standard
Mean Effect Error
A. Survey data
Employed at 18-month survey 0.543 0.056 0.014***
Employed at 42-month survey 0.496 0.064 0.015***
Job at 42-month survey:
30 or more hours per week 0.395 0.049 0.015***
Self-employed 0.049 0.022 0.009**
Offers health insurance 0.269 0.025 0.014*
N = (3082 for 18-month survey; 2966 for 42-month survey) B. UI records data
Employment rate
Yr 1 0.587 −0.024 0.009***
Yr 2 0.562 −0.012 0.010
Yr 3 0.533 −0.009 0.011
Earnings
Yr 1 12376 −221 223
Yr 2 12601 −257 286
Yr 3 12529 −116 323
N 4993
Sources: Baseline survey, 18- and 42-month surveys and UI records
to children’s schooling, preventive health care and parents’work. Results to date show that the program’s most substantial effects were to reduce poverty and material hard-ship during the 3 years in which the rewards were offered. The program also led to be-havioral responses across the three domains, the key to long-term poverty reduction, although these effects were either small or limited to subgroups. For example, the pro-gram increased grade progression and graduation rates for proficient 9th graders, but had no effects for their less proficient peers or on younger students.
The findings for education are consistent with a growing literature documenting that incentives can increase student effort.16However, as noted earlier, it is not always clear that this increased effort while the incentives were offered translates into higher achievement in the long-run. Family Reward’s effects on attendance and credits earned for proficient 9th graders also diminished in Year 4, after the program had ended.
The program’s lack of effects for younger students is consistent with findings from some programs (Fryer 2011) but not with others (Bettinger 2012). One reason for the lack of effects may be that the incentives were not as salient to the younger students in Family Rewards. In other programs, the incentives were paid more frequently and were given directly to the students. In contrast, Family Rewards, like most other CCTs, gave rewards to the parents and relied on them to communicate the incentives to their chil-dren.17 Interviews with participants indicated that parents varied widely in terms of how much they told their younger children about the program.
Table 14Effects on parents employment and earnings by employment status and education level at baseline
Control Standard
Mean Effect Error
A. Employment status Not working at study entry
Employed at 42-month survey 0.231 0.044 0.023*
Quarterly employment rate yrs 1–3 (UI) 0.204 −0.023 0.015
Total earnings yrs 1–3 (UI) 9405 −457 1041
Working at study entry
Employed at 42-month survey 0.752 0.070 0.021***
Quarterly employment rate yrs 1–3 (UI) 0.754 0.005 0.014
Total earnings yrs 1–3 (UI) 61554 995 1523
B. Education level
No high school diploma/GED
Employed at 42-month survey 0.408 0.032 0.025**
Quarterly employment rate yrs 1–3 (UI) 0.379 −0.033 0.016**/++
Total earnings yrs 1–3 (UI) 20805 −2078 1191*/+
Has high school diploma/GED
Employed at 42-month survey 0.554 0.083 0.020***
Quarterly employment rate yrs 1–3 (UI) 0.558 0.012 0.013
Total earnings yrs 1–3 (UI) 46739 1424 1339
Sources: Baseline survey, 18- and 42-month surveys and UI records
The lack of effects for younger children is also a bit surprising, given the substantial reductions in poverty that these families experienced for at least the 3 years of the pro-gram. There is a growing literature documenting the effects of increased family income on children’s trajectories, particularly for very young children.18 In addition, as men-tioned earlier, studies of unconditionalversus conditional transfer tend to find positive schooling effects from both types of transfers, although the findings are from middle-income countries.
Effects for more academically prepared 9th graders are consistent with other research that finds that effects of incentives are concentrated largely on students on the margin of higher performance and, in particular, on those who were reading and language profi-cient. In some ways, it is to be expected that the effects of incentives would be concen-trated on those students at the margins, since in the absence of services students were left to their own devices to earn the rewards. In a similar vein, Fryer (2011) suggests that a more effective strategy might be to reward inputs to school progress rather than outputs, since many of the students (and parents) may not know how to improve their school performance in order to earn the incentives. An alternative, or complement to this strategy, might be to offer more guidance to families about how to help their chil-dren perform better in school.
In the health domain, there is little evidence on the effect of incentives to maintain health insurance, and recent research shows that having health insurance does increase the use of preventive care (Finkelstein et al. 2012). Family Rewards led to a small in-crease in rates of health coverage but did not inin-crease preventive doctor visits. Rates of coverage and care were already quite high for families in the control group, which raises the question of whether the program might have had larger effects in an area with lower coverage.
In the work domain, the findings show modest positive effects, albeit only for work reported on the surveys. They also illustrate the potential for income effects that dampen work effort. Although reductions in work effort seemed to occur largely for groups less connected to the labor force, it is also possible that the rewards earned by individuals in the other two domains dampened the effectiveness of the work rewards more broadly. The answer may not be to eliminate the work incentives altogether, since the reductions in work may have been bigger in their absence.
One factor to consider when interpreting the program’s effects is that the Great Recession began during program year 2. Similarly and in response, the American Recovery and Reinvestment Act was passed in early 2009. The Act included direct Table 15Effects on parents’education and training
42-month survey
Control Standard
Mean Effect Error
Participated in education or training since random assignment 0.412 0.010 0.018
Has trade license/certificate 0.503 0.042 0.018**
Has Associate’s degree 0.084 0.024 0.011**
N 2966
Sources: Baseline survey and 42-month survey
Each estimate represents the coefficient on program status from a linear regression, controlling for selected baseline characteristics
spending measures, among other policies, but it also expanded food stamp benefits for low-income families and the Earned Income Tax Credit for larger families. It is not immediately clear how the onset of the recession and the subsequent Recovery Act should affect program impacts. We did not observe large reductions in income or employment rates for the sample over the time period, for example, although high unemployment rates may certainly affect individuals’ employment response to the program.
Although the results presented here suggest that this version of a CCT is unlikely to lead to long-term reductions in poverty for most families, the findings have fed into the next iteration of the model. A modified version of Family Rewards is being replicated and tested in two cities in the U.S. (New York, New York and Memphis, Tennessee).19 The new model, launched in 2011 in both cities, builds on the lessons learned from this evaluation. For example, the new program targets families with children who were set to enter 9th or 10th grade in the upcoming school year. It is much simpler than the original program, offering only eight incentives instead of 22, across the three domains. The new program also includes a more active advisement role for the staff, in which they develop an initial plan with every family and aim to meet with them twice per year to discuss their progress toward earning the rewards. Finally, the new program at-tempts to make the rewards more timely (and thus more salient) by disbursing pay-ments monthly, rather than every 2 months. Rewarding grades, in addition to test scores, also provides a more immediate incentive for school performance.
Family Rewards was the first test of a CCT in the U.S. and attempted to encourage families to make more investments in their human capital. In some cases, the incen-tives worked and in other cases they didn’t. The findings from the evaluation of Family Rewards add to a growing body of evidence on why families may not follow through on certain behaviors and which of these behaviors can be changed by incentives.
More broadly, the Great Recession highlighted the need for a safety net in the U.S. that provides families with adequate support when they need it while also encouraging self-sufficiency. Some have suggested that a CCT such as Family Rewards could be in-corporated into or layered on top of a safety net program, such as TANF (Transitional Assistance for Needy Families). Politically, this program may be more popular and sus-tainable if it came with these types of strings attached. While it is important to keep in mind that a non-trivial fraction of families did not earn very much from Family Re-wards (the bottom fifth of earners, a relatively disadvantaged group, received on average just over $700 per year from the program), much of the current safety net is condi-tioned on only one activity—work (particularly, working in the case of the EITC and looking for work in the case of TANF). This system, the EITC in particular, worked well when jobs were plentiful but has proven inadequate in a bad labor market (Berlin 2011). Conditioning benefit receipt on a range of productive activities (work, schooling and health) may be a way to expand benefits to those in need.
to families would have led to similar effects in each of the domains, the lower cost would be one advantage of providing transfers with no strings attached. Political sup-port for an unconditional cash transfer of this size, however, may be limited.
Endnotes 1
This paper is based on results presented in Riccio et al. (2010, 2013).
2
For example, see Schultz (2004); Behrman et al. (2001), (2009).
3
For reviews, see Fiszbein and Shady (2009); IEG (Independent Evaluation Group) (2011); Saavedra and Garcia (2012).
4
Bettinger (2012) finds some evidence of reduced effort in a program that rewarded students for achievement on one reading and math test per year. Among students in the program group who had already earned the maximum incentive from the first test, the effect of the program was to reduce their performance on the second test.
5
New York City officials worked with several banks and credit unions to develop spe-cial “Opportunity NYC accounts” for participants that carried no fees and came with overdraft-impossible debit cards.
6
The results were very similar when impacts were estimated using models that did not include these additional controls.
7
In practice, families received the rewards in a somewhat lumpy fashion, since several of the largest rewards were paid out for periodic items such as test scores and Regents exams. For example, about half of all families received more than 45 percent of their total payments for the year in just one pay period.
8
Regressions of food security and financial well-being on income and other variables, estimated for the control group only, indicate that both measures are positively corre-lated with monthly income, with a $100 increase in income increasing food security by .01 scale points and financial well-being by .04 scale points. The effects presented in Table 4 are somewhat larger than these regression estimates would suggest, given that the program increased monthly income by about $350. The difference may be due to non-linearities in the relationship between income and these material well-being mea-sures, or to the fact that the program also increased savings and the number of families with bank accounts, which can also affect perceptions of well-being and food security.
9
We calculated attendance rates for all students, including those students who were no longer enrolled in NYC public schools, in order to preserve the experimental com-parison. However, test scores and proficiency rates were only calculated for students who took the tests. Few students were missing test score data (<5%), and the rate of missing scores did not differ between the program and control groups.
10
See Medina (2010).
11
To construct “school environment,” we divided schools into thirds based on the pass rates of earlier cohorts. Effects were then estimated separately for the bottom third, the middle third, and the top third schools. Separate models, interacting pass rates with treatment status, showed similar results.
12