R E S E A R C H
Open Access
Pseudonymization risk analysis in
distributed systems
Geoffrey K. Neumann, Paul Grace
*, Daniel Burns and Mike Surridge
Abstract
In an era of big data, online services are becoming increasingly data-centric; they collect, process, analyze and anonymously disclose growing amounts of personal data in the form of pseudonymized data sets. It is crucial that such systems are engineered to both protect individual user (data subject) privacy and give back control of personal data to the user. In terms of pseudonymized data this means that unwanted individuals should not be able to deduce sensitive information about the user. However, the plethora of pseudonymization algorithms and tuneable
parameters that currently exist make it difficult for a non expert developer (data controller) to understand and realise strong privacy guarantees. In this paper we propose a principled Model-Driven Engineering (MDE) framework to model data services in terms of their pseudonymization strategies and identify the risks to breaches of user privacy. A developer can explore alternative pseudonymization strategies to determine the effectiveness of their
pseudonymization strategy in terms of quantifiable metrics: i) violations of privacy requirements for every user in the current data set; ii) the trade-off between conforming to these requirements and the usefulness of the data for its intended purposes. We demonstrate through an experimental evaluation that the information provided by the framework is useful, particularly in complex situations where privacy requirements are different for different users, and can inform decisions to optimize a chosen strategy in comparison to applying an off-the-shelf algorithm.
Keywords: Privacy, Pseudonymization, Risk analysis
1 Introduction
Motivation. The creation of novel, personalized and opti-mized data-centered applications and services now typ-ically requires the collection, analysis and disclosure of increasing amounts of data. Such systems will leverage data-sets that include personal data and therefore their usage and disclosure represent a risk to a user’s (data sub-ject) privacy. This data may be disclosed to trusted parties or released into the public domain for social good (e.g. scientific and medical research); it may also be used inter-nally within systems to improve the provision of a service (e.g. to better manage resources, or optimize a service for individual users). Importantly, users have different view-points of what privacy means to them. Westin’s privacy indexes provide evidence of this [1]. For example, users may wish to disclose sensitive information to support
*Correspondence:[email protected]
IT Innovation, University of Southampton, Gamma House, Enterprise Road, SO16 7NS Southampton, UK
medical research, but not allow an environmental moni-toring service to track their movements. However, there is a concern that individuals may simply not understand the implications for their own data within a service [2]; or this may reflect the complexity of technology itself [3]. Hence, systems should be developed to ensure that: i) each indi-vidual’s privacy preferences are taken into account, and ii) risks to each and every user’s privacy are minimized.
Dataanonymizationis the process of removing directly identifying information from data. Anonymized datasets may contain both sensitive information, and information that could identify the person. Hence, concerns about pre-serving privacy has led to algorithms to pseudonymize data in such a way that personal information is not dis-closed to an unwanted party, e.g. k-anonymization [4], l-diversity [5] andt-closeness [6]. In general, developers’ understanding of external privacy threats are limited [7]. Non-experts in these algorithms will also find them diffi-cult to understand in terms of: i) the impact of the risk of re-identification, and ii) the effect of the pseudonymiza-tion on the usefulness of the data for its intended purpose.
Hence, development frameworks that guide a privacy-by-design [8] process to achieve better privacy protection are required.
Contribution. In this paper we propose a Model-Driven Engineering (MDE) framework to model and analyze the privacy risks of a system employing pseudonymization. This provides the following key features:
• Modeling user privacy. The framework takes as input models of the system in terms of the data and its flow between systems and stakeholders (via data flow diagrams) and automatically generates a formal model of user privacy in the system (in terms of a Labeled Transition System).
• Pseudonymization risk analysis. The user-centered privacy model is then analyzed to automatically identify and quantify privacy risks based upon the modeled choices of pseudonymization. This returns the number of privacy violations that a
pseudonymization strategy will or may result in, and an assessment of whether the data will still be useable for its intended purposes when the violations have been eliminated to an acceptable standard.
We argue that the framework can be used by non-pseudonymization experts at different stages of the devel-opment lifecycle to make informed decisions about: pseudonymization strategies, whether pseudonymized data is safe to release, and whether to impose restrictions on when data should be released. A system designer, using profiled user data, can understand privacy risks early in the design process, and ensure that user privacy is a foun-dational requirement to be maintained. The framework can also be used by systems developers (or data con-trollers) to make decisions about data disclosure based on the information from the users in the real dataset.
Outline. Section2first describes how the framework is used to model user-centred privacy-aware systems that leverage pseudonymization, before describing how poten-tial pseudonymization risks are identified in Section 3. Section 4 reports how the framework carries out data utility analysis. Section 5 describes how the framework is applied following privacy-by-design practice, and the framework is evaluated in Section6. Section7describes related work, and Section 8 provides a conclusion and indicates areas of future work.
2 Modelling privacy aware pseudonymization
systems
Here we describe a framework to model privacy aware systems. This follows two steps. First, the developer mod-els their system; second, a formal model of user privacy in this system is generated.
2.1 Step 1: modelling a privacy aware system
The developers of the system create a set of artifacts that model the behaviour of their system:
• A set ofData-Flow diagrams that model the flow of personal data within a system. In particular focusing on how data is exchanged between the actors and datastores. We utilize data-flow diagrams because they are an existing well-understood form of modeling that simply captures data behaviours.
• Thedata schema associated with each datastore; this highlights the individual fields and also those containing personal data, and potentially sensitive personal data.
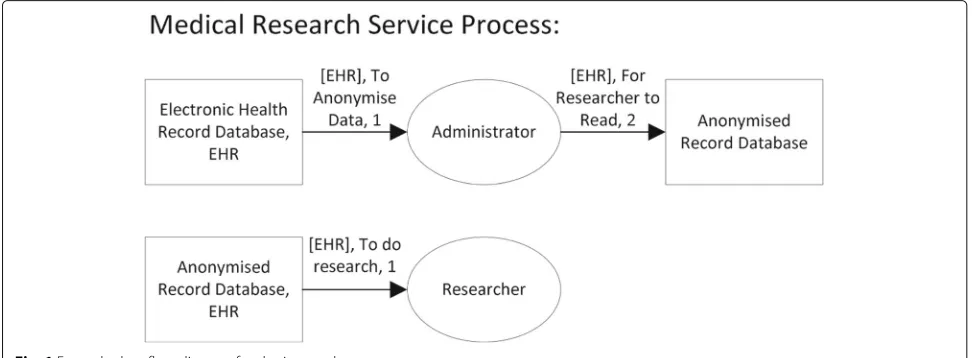
We now consider a simple example to illustrate how these elements form the input to the modelling frame-work. Two data-flow diagrams are given in Fig. 1. The
nodes represent either anactor(oval) or adatastore
(rectangle). The datastores are labelled by two objects: the first is the identifier for the datastore, and the second are the data schemas. The actual data flow is represented by directed arrows between the ovals and rectangles, henceforth referred to as flow arrows. Each flow arrow is labelled with three objects: the set of data fields which flows between the two nodes, the purpose of the flow, and a numeric value indicating the order in which the data flow is executed. We assume datastore interfaces that support querying and display of individual fields (as opposed to coarse-grained records). The example illus-trates the process where an administrator queries data from an healthcare database to produce a pseudonymized version that is stored in a data store; from which data is queried by researchers.
2.2 Step 2: automatically generating an LTS privacy model
In this section we provide a formal model of user pri-vacy that is generated based upon the input data-flow diagrams (we do not detail the transformation algorithm in this paper, see [9]). User privacy is modeled in terms of how actor actions on personal data change the user’s state of privacy. We define an actorto be an individ-ual or role type which can identify the user’s personal data. Depending on the service provided, each actor may or may not have the capability to identify personal data. Hence, a user’s privacy changes if any of their personal data has been or can be identified by an actor. Prior mod-els following this approach are: a Finite State Machine (FSM) [10, 11] or a Labelled Transition System (LTS) [12]. The common theme in both is that the user’s pri-vacy at any point in time is represented by a state, and that actions, executed by actors, taken on their per-sonal data can change this state. We build upon these approaches and extend them to label both states and
transitions in such a way that the model can be anal-ysed to understand how, and why, the user’s privacy changes. This novel contribution allows us to represent not only the sharing of a user’s personal information, but also the potential for a user’s personal information to be shared. This is the case when personal information is stored in a datastore that can be accessed by multiple individuals.
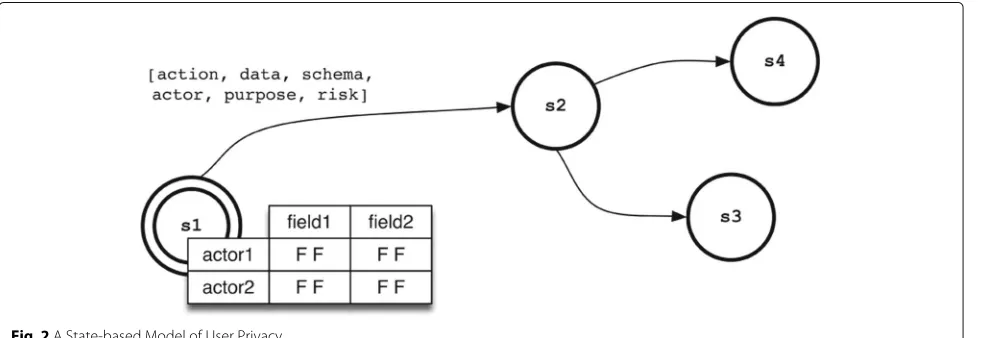
The key elements of our model (illustrated in Fig.2) are:
• States: are representations of the user’s privacy. They are labelled with variables to represent two
pre-dominant factors: whether a particular actorhas identified a particular field, or whether an actorcould identify a field. These variables, henceforth known as state variables, take the form of Booleans, and there are two for each actor-data field pair (has, could). The state label s1 is given the table values shown in Fig.2.
• Transitions: representactions(collect, create, read, disclose, anon, delete) on personal data performed byactors. They are labelled according to: i) anaction, ii) the set ofdata fields, iii) thedata schemathat the data field is a part of, iv) theactorperforming the action. There are two optional fields: i) apurposethat explains the reason a particular privacy action is being taken, and ii) a
privacy risk measureto identify risks
associated with this action (whose value is calculated and annotated during risk analysis).
• Pseudonymization: the disclosure of pseudonymized versions of each sensitive field is modelled using the
anontransition. State variables (i.e. can access, has accessed) can be declared on these fields. For example an analyst may have access permission for the fieldweightanonbut may not have permission to accessweight. This will mean that they may be allowed access to pseudonymized weight data for
statistical purposes but should be prevented from matching any value to an individual.
2.3 Step 3: considering user privacy preferences
Each user has a policy which controls all aspects of how their data is allowed to move through the system. This section will in brief outline how these policies operate. As they control more aspects of the system than just pseudonymization, for a more detailed description refer to literature describing the system overall [12]. These poli-cies, which are derived from information obtained from a questionnaire, have three main aspects:
1 Which services the user agrees to use (based upon the purpose of the service, and optionally their trust of actors in that service).
2 The sensitivities the user has about certain fields, represented by either a sensitivity category (low, medium, high for example), or a number which takes a value between 0 and 1 indicating how sensitive the user is to disclosure of that data.
3 The overallsensitivity preferences of a user. Users are categorised as having one of three preference levels:unconcerned, pragmatist and fundamentalist [1]. These three categories indicate, respectively, that the user requires a low, medium or high level of restriction on data and which actions are allowed on their data. Anunconcerned user will have few restrictions while afundamentalist user will have many restrictions.
Within the context of the LTS, user policy operates on transitions and is used to determine whether a transition should or should not be allowed. A transition that occurs despite not being permitted is referred to as a policy violation. An actor that is not permitted to access a given field will be referred to as anunauthorised actorwhile one who is allowed will be referred to as anauthorised actor.
3 Risk analysis
3.1 Identifying pseudonymization risk transitions In the context of this paperriskrefers to a danger that a single piece of information about a user is obtained by an entity or individual that is not authorised to have access to that information. In the case of pseudonymization this danger takes the form of a quantifiable probability. Some risks may be acceptable and it is impossible to eliminate all risk. In the case of pseudonymization, risks associated with a sufficiently low probability can be ignored. Which risks may be ignored is determined by a combination of system policy and the preferences of the individual user to which the data refers, theiruser policy.
Pseudonymization is incorporated into the LTS via the
anontransition. This creates pseudonymized versions of
each field. State variables (i.e. can access, has accessed) can be declared on these fields in the same way as for non anonymized fields and are also subject to the same permissions. For example, an analyst may have access permission for the field weight.anon but may not have permission to accessweight. This corresponds to an actor having access to a pseudonymized version of the database. When they are only permitted access to pseudonymized versions of sensitives fields they should be prevented from attaching any sensitive values to specific users.
There are two key types of risk which are considered:
1. Re-identification: The risk that a person whose personal data is pseudonymized within a disclosed data set can be re-identified.
2. Value Prediction: Risk of a sensitive value being matched to an individual.
Techniques such as k–anonymization [4] prevent re-identification but do not guarantee that there is not still a value prediction risk. For example, suppose that after k-anonymization ak-set about human physical attributes contains 10 records, 9 of which have a weight over 100kg. If an attacker knows their target is in that k-set they can be 90% certain that their target has a weight over 100kg. This means that a privacy disclosure risk is still present.
In this version of the model, we focus on value prediction risk. Note that although alternatives to k -anonymization, for example l-variance, may eliminate the danger of value prediction, this framework is designed to provide an assessment of any pseudonymization parame-ters that the user wishes to use. As stated, this framework does not attempt to produce a definitive pseudonymiza-tion technique.
The system will automatically discover and add to the LTS, transitions that correspond to a possibility of unauthorized value prediction due to pseudonymization, referred to as risk-transitions. A risk that a given actor (actor.A) can access a given sensitive field (field.F) is said to be present in every node in the LTS where the pseudonymized version ofF(F.anonymized) has been accessed byA. IfAonly has access rights toF.anonand notF,Risk-transitionswill be added to the LTS starting from each of these at-risk nodes. These will be marked as not allowed and it will be possible to calculate risk scores or declare policy associated with these transitions. Each risk transition is uniquely identified by the set of quasi-identifier fields which the actor has already accessed.
3.2 Scoring risk transitions - violations
transition. To consider this, first a number of terms need to be defined:
• Riskis the danger of an individual value associated with an individual user being predicted.
• Violationsarerisks within the dataset which are higher than an acceptablethreshold.
• AThresholdis a numeric limit above which a risk is judged to be unacceptable.
• AMarginspecifies how close values in a continuous field are required to be to be judged to be equal for the purpose of risk calculation.
Thresholds are associated with individual values and every single value may have a different threshold. This is because they are calculated from a combination of over-all system policy and an individual user’s policy. Initiover-ally, an individual’spreference level(unconcerned, pragmatist or fundamentalist as mentioned in the previous section) will dictate how high the default of their thresholds for each field should be set. Once these have been defined a user may specify particular sensitivities attached to cer-tain fields and this will decrease the threshold value for those fields. Overall system policy will define how these user dependent factors influence thresholds. Non expert users often state preferences about information privacy that is directly opposite to their actions [13], and it cannot be assumed that they are fully aware of the implications of revealing their data. Hence, it is the responsibility of the system designer to ensure that overall system policy does not allow thresholds outside of an acceptable range regardless of user preference.
The score used is simply the total count of violations within the data. It is calculated using the marginal prob-abilities of values within k-sets as illustrated in the pseu-docode in Algorithm 1. Note that this process is associated with a single risk transition and therefore, as risk transi-tions are associated with the danger of accessing a single sensitive field, what we are calculating is the violation count for just one sensitive field (denotedvas the sensitive field corresponds to a one dimensional array ofvalues).
Algorithm 1Calculating Violations calculateviolations(recordSet,v)
for allr∈recordSetdo violations=0 set=kF−setr
risk =|matches(kF−set,Ri)| ÷ |set| ifrisk>thresholdrvthen
violations=violations+1 end if
end for
returnviolations
The following terms are used in this pseudocode:
• recordSet. The complete set of records.
• F is the set of fields that the attacker has access to.
• kF-set. This is the set of records which appear to be identical given the information available. In k -anonymization the k -set is the set of records that appear to be identical when the quasi identifier fields are pseudonymized. ThekF-set is the set of records which appear to be identical in the pseudonymized data when all quasi identifiers except for those in set F are masked.
• kF-setiis thekF-set which record i belongs to. The size of this set is also referred to askF−set
i
• |matcheskF−set,Ri
|is the number of records withinkF-setiwhere the sensitive value in question matches the real value in recordi to within margin.
• thresholdrvis the threshold associated with valuev in recordr.
• marginvis the margin associated with sensitive field/set of valuess. This will be 0 if the field is not continuous.
4 Statistical utility
Once violations have been detected they will normally need to be removed. It may be possible to leave some vio-lations in the data depending on whether policy defines hard restrictions or soft restrictions. Removing will affect the statistical properties of the data and so will affect the results of experiments that researchers carry out on the data. The issue is compounded by the fact that it is harder to protect the privacy of outliers in the data [14]. Because of this, violations are not likely to be evenly spread across the data distribution which increases the possible impact on the data of removing them. To address this, when data-sets are applied to the model transitions autility reportfor each risk transition is produced that shows both the vio-lation count and a utility score which gives an indication of the impact that removing data has had on the dataset’s statistical utility.
4.1 Statistics in the utility report
standard set of statistics may also provide some reassur-ance. It is important to note, that differential privacy [15] is privacy-preserving method that provides such strong privacy guarantees for certain statistical operations. The approach differs from pseudonymization in that noise is added to the results of statistical queries on the data. A system designer may choose to engineer this solution, but our tool considers cases where system designer have chosen pseudonymization methods.
With these considerations in mind it was decided that the utility report should for now provide the following information:
• How many values need to be eliminated for the number violations to reach zero. Note that this number is not necessarily equal to the number of violations. This number shall be referred to asRvfor removed violations and the total number of violations shall be referred to asNvfornumber of violations.
• The complete set of statistics calculated for each dataset provided by the Apache commons statistics function1that includes the statistics shown in Table1.
The assumption of independence Currently the pro-cess of violation removal and utility reporting operates on a single sensitive field. The means that a violation is a single value at danger of prediction rather than an entire record. When a violation is removed only the rel-evant value is removed and the rest of the record is left untouched. This also means that the statistics above are calculated from the vector of values associated with the relevant field. Correlations between fields may be impor-tant for research purposes and so the intention is that this will be introduced into the utility report at a later stage.
4.2 Removing violations
Removing violations is not as simple as removing every value which is in violation. This strategy may, in certain
Table 1Statistical values used in Utility Report
Name Definition
Maximum The maximum value in the data-set
Minimum The minimum value in the data-set.
Skewness The asymmetry of a frequency-distribution curve.
Kurtosis The sharpness of the peak of a frequency-distribution curve.
Median The middle value in a data-set’s values.
Mean The average value of the data-set.
Standard deviation The measure of spread or dispersion of a data-set.
circumstances, involve the removal of an unnecessary number of values and may also not be sufficient to remove all violations. This is because, on one hand, removing only a subset of violations may push the number of values within a certain range below the violation threshold while, on the other hand, removing all violations reduces the size of the k-set and so may create a situation where previously non violating values become violations. Further complica-tions are created as two or more sensitive values do not have to be exactly equal to be considered identical from a violation point of view, due to the use ofmargins. Addi-tionally the fact that different values may have different thresholdsattached to them based on user policies makes the problem even more complex.
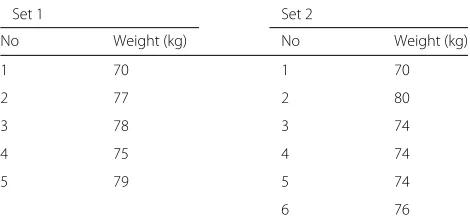
Table2provides an example of both of these situations. The sensitive field we are operating on is theweightfield, thethresholdis 0.75 for all values and themarginis 5 kilo-grams. The data has been divided into 2kF−sets as shown below. Violating values are highlighted in blue. In set 1 it is only necessary to remove one value for violations to be eliminated. If all violations are removed then not only will an unnecessary number of values be removed, but the set will only have one remaining member, item 1. This will now be classed as a violation as it is, by definition, identical to 100% of members of its set.
An intuitive response might be to removek−n+1 vio-lations at random wherekis the number of violations in the set andnis the minimum number of values for a given value to be identical to (or close to given the use of mar-gin) including itself in order to be considered a violation based on its threshold. For example, if the threshold is 0.75 for valuevand there are 10 values inv’s set thenvwould be in violation if it is close to 8 or more values (including itself ). In this casenwould be equal to 8.
There are two problems with this approach. Firstly, dif-ferent values may have difdif-ferent thresholds based on user policy and therefore there isn’t a single n value for an entire group of violations and secondly, the fact that we use margins also means that this approach would some-times produce the wrong result.
This second problem is illustrated by set 2 in Table2. This set contains 4 violations in a set of size 6. As we are
Table 2Risk values for 2-anonymization data records
Set 1 Set 2
No Weight (kg) No Weight (kg)
1 70 1 70
2 77 2 80
3 78 3 74
4 75 4 74
5 79 5 74
assuming a threshold of 0.75 for all values and 4/6<0.75 thenkis already lower thann. According to the approach described above no values should need removing at all and the set should already be free of violations. How-ever, the set clearly does contain violations and this is due to the use of margins. Values 3 to 5 are in violation as they are each close (within 5 kg) to 5 other members of their set. They are each close to the other violating values as well as to value 1 (70 kg). Value 6 is also in vio-lation as it is close to each of the other violating values and to value 2 (80 kg). Value 1 and value 2 are not in violation themselves but they must be considered in any violation removal process as their presence is responsi-ble for other values being in violation. In this situation not just the number of violating values removed but also which violating values are removed is important. If value 6 is removed then the set will be left with 4 violating val-ues, all values within the range 70 to 74. If value 3, 4 or 5 is removed then the set will be left with only 2 violat-ing values as neither a value of 70 nor 76 will lead to a violation.
As it is clearly non-trivial predicting exactly how many and which violations should be removed in all situations that may occur, the process of removing violations was made iterative. It was achieved through a modification of thek−n+1 technique described above. As thresh-olds vary based on user preferences, a default threshold defined in the system is used to approximate how many violations should be removed. As this may not succeed in removing all violations it is followed by checking each value individually for violation and repeating this process if necessary.
Algorithm 2 describes the process in detail. The terms used in this pseudocode are defined in the following list:
Algorithm 2 Removing Violations removeViolations
(recordSet,v) do
violations[recordSet]= calculateViolations(recordSet,v)
for allr∈recordSetdo set=KF−setr
ifsetnot already cleanedthen
numRemover = ((1−threshold)∗ |set|)− (|set| − |violations[set]|)
randomly select (without replacement) violating values to remove and remove them
returncleanSet(set,violations[set] , numRemover) end if
end for
whileviolations exist inrecordSet
• recordSet. The complete set of records.
• violations[data]. Records within the datasetdata containing a violation.
• F is the set of fields that the attacker has access to.
• kF-set. This is the set of records which appear to be identical given the information available.
• KF-setiis theKF-set which record i belongs to.
• threshold The default threshold value that each value has as its threshold before individual user policies are applied.
As can be seen in the pseudocode, for each set violations are removed, the set is rechecked, and this is repeated until no violations remain.
Note that, although techniques such as l-diversity [5] can eliminate the risk of value re-identification, this sys-tem is not designed to be an alternative to such tech-niques. It allows finer control in the situation where every single value has its own associated risk threshold. It allows greater transparency for a non expert user. We assume that a data controller has pseudonymized using a tech-nique that they understand and have reasons for choosing. The resulting data is modified as minimally and transpar-ently as possible in our system.
5 Pseudonymization analysis framework
We have implemented the prior described functionality in a software framework (developed in Java); this is available for download2. This section outlines the use cases for sys-tems under design that wish to analyze the pseudonymiza-tion strategies employed; and importantly the steps that a developer follows to use this tool. For this description we assume that the data-flow model has been created, and the LTS has been generated (note, this must contain at least one instance in which the data is pseudonymized for the tool to be useful). The main use cases are as follows:
1 The user, described as aData Controller, is working on a live system and wishes to check the data currently in the system to ensure that an
unacceptable level of policy violations isn’t occurring and rethink the pseudonymization approach if it is. 2 The user, described as aSystem Designer, is
designing a system and wishes to devise a
pseudonymization strategy that is unlikely to lead to an unacceptable level of policy violations.
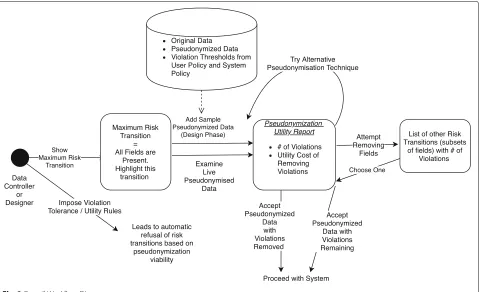
The overall workflow is shown in Fig. 3. Actions are marked with a "UC" caption to indicate which use case they are associated with.
For use case 3, which may well be performed after use cases 1 or 2, the user provides rules of the form:
IFnumberOfViolations>acceptableLimit[OR/AND]
utilityThreshold < acceptableLimit... THEN block transition action
There may be multiple utility threshold parameters and any combination may be used. These will generally take the form of differences between the key statistics described in Section4.
For use cases 1 and 2 the process is essentially the same. The user starts by viewing the risk transition in the LTS of most concern to them, this is themaximum risk transi-tioni.e. the transition that has the most violations. As has already been stated, risk transitions are uniquely identified by the quasi identifiers that have already been accessed and the maximum risk transition will always be the one in which all quasi identifiers have been accessed. The user will view the utility report associated with that transition and will then select an action based on that report. As an alternative to automatically viewing the maximum risk transition a user may also select risk transitions on the LTS manually.
This action may consist of either accepting the pseudonymization strategy as it is or exploring alternative
pseudonymization strategies. Alternative pseudonymiza-tion strategies may involve either exploring alterna-tive pseudonymization techniques, for example switching fromk-anonymization tol-diversity, or considering allow-ing access to only a subset of fields. The latter option is equivalent to choosing a different risk transition. A list of all risk transitions associated with the target sensitive field will be displayed alongside the associated number of vio-lations for each. The user selects one of these to generate the utility report associated with this new risk transition. The ability to see different subsets of fields accompanied by their violation count addresses the problem of high dimensionality in pseudonymization techniques such as k-anonymity [16]. This provides an easy to understand metric for comparing different subsets of fields and under-standing which fields have the greatest cost in terms of re-identification risk. While most solutions attempt to address the question of whether it is possible to reduce violation cost while still sending all fields to the researcher this may not be possible and the researcher may not need all fields.
If the user chooses to accept a pseudonymization strat-egy they may do so either before or after violations have been removed. Clearly this depends on the nature of these violations with regard to user policy and system policy as any hard violation or violation associated with legally required policy must be removed. In a live system,
accepting a pseudonymization strategy will lead to data being disclosed as the risk is judged to be acceptable. In a system being designed accepting a pseudonymization strategy will mean defining that, either before or after violation removal, this transition will be part of the sys-tem and will always occur unless this rule is subsequently changed. The only difference between use cases 1 and 2 is how the utility report is generated. In a live system it will be generated with live data while in a system being designed sample data will be used.
6 Evaluation
To evaluate we apply the framework to particular use cases and observe the extent to which a user of the frame-work is informed about the risks of pseudonymization. The following use cases are described in turn and show how utility and violations may be considered. For both, we prepared a health record set to undergo 2-anonymization. A researcher has access to this anonymized data but does not and should not have access to the original data. The policy violation that we wish to avoid is the researcher being able to predict an individual’s weight to within 5kg (margin = 5).
6.1 Uniform privacy use case
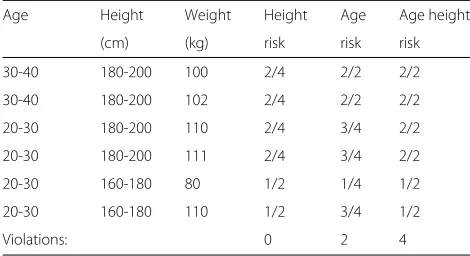
In this case we assume that the threshold is 0.9 for all users; all users are considered to have the same privacy preferences. This means that an attacker predicting any individual’s weight with a 90% or above confidence is con-sidered a violation. Age and height are quasi identifiers. Table 3provides six sample records input to the model analysis process and shows how, as more identifying fields become available to the researcher, the number of vio-lations of this policy increases. The risk columns show the proportion of records with matching quasi identifiers (considering only those that the attacker has access to) where weight is within 5kg of the weight of the current record. If this proportion is above 0.9 then it is highlighted as a violation.
Table 3Risk values for 2-anonymization data records
Age Height Weight Height Age Age height
(cm) (kg) risk risk risk
30-40 180-200 100 2/4 2/2 2/2
30-40 180-200 102 2/4 2/2 2/2
20-30 180-200 110 2/4 3/4 2/2
20-30 180-200 111 2/4 3/4 2/2
20-30 160-180 80 1/2 1/4 1/2
20-30 160-180 110 1/2 3/4 1/2
Violations: 0 2 4
The framework generated the LTS as shown in Fig.4. Dotted lines indicate potential policy violations. A system administrator has the option of loading the six records given as examples above into the LTS. They would then see the violation scores 0, 2 and 4 as shown in this figure. A utility report would be generated showing the cost to statistics of eliminating these violations. If the num-ber of violations or the utility cost is unacceptable the data controller can consider increasing their k value or reconsider their pseudonymization entirely. Alternatively, at the design phase, a system designer could declare that a number of violations above 50% is unacceptable. The system would now throw an error if the above data was used, forcing the administrator to choose another form of pseudonymization.
Note that this situation assumes a uniform threshold for all users. If this is not the case the number of vio-lations will change. Suppose, for example, that we know from a user questionnaire that the owner of row 4 is a data fundamentalist while all other users are pragmatists. The system designer may have created a rule that fundamen-talists should, by default, have their threshold level set to 0.7 rather than 0.9. In row 4 Risk w/height is at 3/4. This is not a violation in the default situation as it is below 0.9 but now that the user is a fundamentalist it becomes a vio-lation. Similarly, the owner of row 3 may be a pragmatist but may have declared that weight is an especially sensi-tive field for them. The system designer may have created a rule that especially sensitive fields when their owner is a pragmatist also have a threshold of 0.7, leading to the same outcome for row 3.
6.2 Realistic privacy distribution
This use case features a larger dataset with 1103 realistic records; we show that the framework can be utilised to make decisions about data disclosure taking into account user privacy preferences.
6.2.1 Generating sample data
Fig. 4Pseudonymization risk analysis output
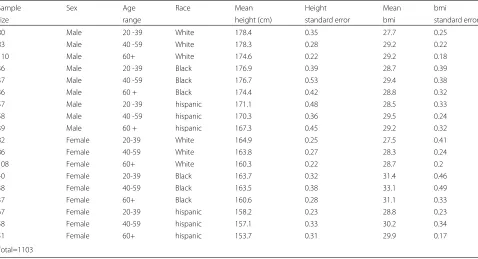
Table 4Data distribution
Sample Sex Age Race Mean Height Mean bmi
size range height (cm) standard error bmi standard error
80 Male 20 -39 White 178.4 0.35 27.7 0.25
83 Male 40 -59 White 178.3 0.28 29.2 0.22
110 Male 60+ White 174.6 0.22 29.2 0.18
36 Male 20 -39 Black 176.9 0.39 28.7 0.39
37 Male 40 -59 Black 176.7 0.53 29.4 0.38
36 Male 60 + Black 174.4 0.42 28.8 0.32
57 Male 20 -39 hispanic 171.1 0.48 28.5 0.33
58 Male 40 -59 hispanic 170.3 0.36 29.5 0.24
39 Male 60 + hispanic 167.3 0.45 29.2 0.32
82 Female 20-39 White 164.9 0.25 27.5 0.41
86 Female 40-59 White 163.8 0.27 28.3 0.24
108 Female 60+ White 160.3 0.22 28.7 0.2
40 Female 20-39 Black 163.7 0.32 31.4 0.46
38 Female 40-59 Black 163.5 0.38 33.1 0.49
37 Female 60+ Black 160.6 0.28 31.1 0.33
67 Female 20-39 hispanic 158.2 0.23 28.8 0.23
58 Female 40-59 hispanic 157.1 0.33 30.2 0.34
51 Female 60+ hispanic 153.7 0.31 29.9 0.17
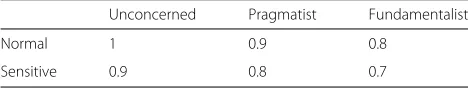
Policy Distributions Each record is associated with an imagined individual through a one to one mapping and each imagined individual has their own privacy level. Some of these hypothetical data owners also consider the weight field to be extra sensitive. The 3 by 2 matrix given in Table 5 shows how a user’s privacy level con-trols the threshold used both for fields they consider to be extra ‘’sensitive” and for ‘’normal” sensitive fields in our example. The number of users that fall into each sensi-tivity category is taken directly from our own survey of the general population3. Table6shows the proportion of users falling into each category in our data and also shows how many consider weight to be an extra sensitive field.
6.2.2 Results
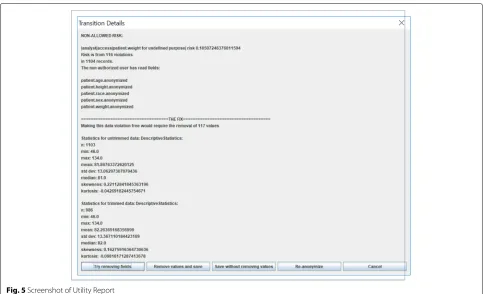
The sample dataset was pseudonymized initially usingk -anonymity (carried out using the arx software [18] and using its default settings). As expected, a utility report was first generated for the transition in which every quasi identifier had been accessed. A screenshot of this report in thek-anonymity scenario is shown in Fig.5.
In this case 116 violations were detected and 117 val-ues (about 1% of valval-ues) needed to be removed. This has had no effect on the maximum and minimums and has had a slight effect on the standard deviation, the skew and kurtosis. The data controller or system designer may decide that this is an acceptable statistical impact and improve the sending of the data with violations removed, they may approve the sending of the original data or they may opt instead to try an alternative pseudonymization algorithm.
Removing Fields Choosing the “try removing fields” option will result in a dialog box as shown in Fig.6. This dialog box allows the data controller to generate a utility report for a smaller subset of fields and clearly shows how variable the number of violations are for different subsets. Even for subsets containing three out of the four fields this varies from 29, if only age is unknown, to 107, if sex is unknown. In this case it is perhaps not surprising that sex has little impact on the effectiveness of pseudonymiza-tion as it only contains two categories while age contains a large number of unique values and so would be expected to contribute significantly to disclosures risks. It may be more significant in this case that removing height leaves 38 violations and so has somewhat less of an impact than age, possibly due to a greater correlation between height and weight. It is perhaps most interesting that removing
Table 5Overall policy
Unconcerned Pragmatist Fundamentalist
Normal 1 0.9 0.8
Sensitive 0.9 0.8 0.7
Table 6User policy distribution
Pragmatist 49%
Fundamentalist 30%
Unconcerned 21%
Regard weight as sensitive 10%
Regard weight as normal 90%
race has a much greater impact than removing sex (down to 67 violations) despite only containing 3 categories and despite sex being, one would assume, correlated to weight to a greater extent than race. This may be due to the unequal numbers of individuals in each racial group.
The usefulness of this information will of course depend on the purpose of the data and whether any fields can reasonably be removed. It could, however, also be used to inform decisions such as weight placed on different fields when tuning pseudonymization algorithms or indi-cate which fields may need their hierarchical indi-categories rethought. These results may seem relatively straightfor-ward and predictable in this example but this functionality becomes more useful as the number of fields increase and in situations where removing, partially obscuring or reconsidering multiple fields at once is a possibility. This is especially true with multiple fields as they may interact with each other in unpredictable ways.
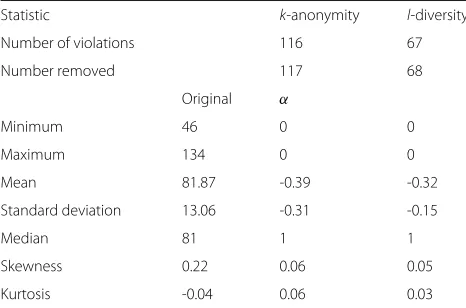
6.3 Comparing withl-diversity and other algorithms In this use case we assess the extent to which the framework can be used to make decisions about the pseudonymization algorithm chosen. An alternative pseudonymization algorithm that a data controller may consider isl-diversity. Unlikek-anonymity,l-diversity [5] protects against value prediction by guaranteeing a range of different values in every set. Entropy basedl-diversity goes one step further in ensuring that no single value dominates so as to protect against probabilistic predic-tions. Using l-diversity would therefore seem a logical strategy if the framework has revealed that using k -anonymity results in a large number of violations. For this reason we appliedl-diversity using Shannon entropy to the data, again using the arx framework and default settings.
Fig. 5Screenshot of Utility Report
Table 7Risk values for 2-anonymization data records
Statistic k-anonymity l-diversity
Number of violations 116 67
Number removed 117 68
Original α
Minimum 46 0 0
Maximum 134 0 0
Mean 81.87 -0.39 -0.32
Standard deviation 13.06 -0.31 -0.15
Median 81 1 1
Skewness 0.22 0.06 0.05
Kurtosis -0.04 0.06 0.03
As would be expected, less violations need to be removed when l-diversity is used. However, the over-all effect on utility is similar between the two algo-rithms. l-diversity also doesn’t eliminate the need to remove violations altogether and the number of viola-tions removed is still more than half the number removed when using k-anonymity. This is despite the fact that l-diversity, Shannon entropy l-diversity in particular, is designed for precisely this scenario when we are attempt-ing to eliminate value predictions. Note that probabilistic value predictions in particular are the focus of this system and entropy based l-diversity is not expected to elim-inate probabilistic value predictions and so l-diversity based on recursion, which is designed for this purpose, was also used [5]. This did not work for our data. Using the default arx settings it failed to produce any results. t-closeness was also tried and this, similarly, did not pro-duce any results [19]. Both of these techniques would presumably require fine tuning to be effective and how to do this is not always clear. In our scenario values having different probability thresholds complicates the issue of avoiding probabilistic value predictions. Eliminating value prediction to the probability threshold required by funda-mentalist users on their most sensitive fields would be so restrictive if applied to every value thatl-diversity would be unlikely to be successful. The use of a fixed margin to define equality in continuous values may further compli-cate matters. More generally, we are operating on a large dataset with a lot of values for height, weight and age, sev-eral quasi identifiers and a lot of correlation between fields and so it seems likely that more restrictive pseudonymiza-tion algorithms would tend to need tuning before being successful.
This study has shown our framework’s ability to give detailed information on which pseudonymization strategy is preferable to just choosing an individual strategy. This demonstrates that in a situation such as this one simply
choosing a more restrictive algorithm such asl-diversity ort-closeness is not sufficient for protecting user privacy.
7 Related work
The system discussed here incorporates pseudonymiza-tion into a wider framework. As we aim to provide novelty in how an easy to use but thorough pseudonymization framework is integrated into a wider privacy framework this section will discuss both comparable pseudonymiza-tion techniques and comparable privacy frameworks from the literature.
7.1 Pseudonymization and differential privacy
Many pseudonymization algorithms have been developed beginning withk-anonymity [4,20]. This method divides data into groups such that no record is uniquely identifi-able. It does not, however, address the issue that groups may contain only a single value for a sensitive field and so fails to eliminate the risk of value prediction. It also suf-fers from the curse of high dimensionality. With too many fields dividing data into sets can become impossible [16].
To address the issue of value predictionl-diversity was proposed by Machanavajjhala et al [5]. This extends k -anonymity by also ensuring that each individual sensitive value is well represented in each set.l-diversity guarantees that each q-set will contain at least l values for a sensi-tive field. This is, however, insufficient to protect against probabilistic attacks. Although multiple values are guar-anteed to exist in each q-set there is no guarantee that a single value won’t still dominate. To address this, alter-native versions ofl-diversity such as entropyl-diversity and recursivel-diversity that aim to ensure that no value dominates. This objective does, however, remain hard to achieve in practice and may be overly limiting.t-closeness ensures that the distribution of an attribute is each sensi-tive attribute in each set is close to its distribution in the overall table [19]. A limitation oft-closeness is that it does not protect against identity disclosure.
Alternatively, pseudonymization may be achieved through perturbation. Perturbation involves creating new values from the same distribution as the original values [21]. This suffers from the drawback that it assumes independence between variables and so potentially very useful correlation information is lost to researchers [22]. Perturbation methods also do not guarantee that a record is indistinguishable from a quantifiable number of other records in the way thatk-anonymity does [22].
which sensitive fields are most important and giving these fields higher priority for protection. This goes some way towards what we are proposing but it defines sensitive fields in terms of their sensitivity relative to other fields. It does not allow the integration of a system of numeric sensitivity levels or allow for users to have a low or high sensitivity preference overall.
An alternative method for incorporating user prefer-ence is the condensation based approach proposed by Aggarwal et al [24]. In this approach the data is divided into groups of records which are guaranteed not to be dis-tinguishable from each other as with k-anonymity. The difference is that the size of each group is determined by the sensitivity level of the most sensitive value within it. That is to say, a value that a data subject specifies as highly sensitive will be allocated to a large group to minimise the probability of value prediction. This solution faces poten-tial efficiency issues as less sensitive values may be placed into groups with more sensitive values and therefore may receive a higher level of pseudonymization than necessary. This method also uses perturbation and so involves mod-ifying sensitive values, possibly to a greater extent than is required.
In terms of the presentation of pseudonymization for users there are a number of tools available to anonymize data, which also provide some risk analysis feedback. The ARX Tool [18] provides methods for analyzing re-identification risks following the prosecutor, journalist and marketer attacker models on a number of anonymiza-tion algorithms. The Cornell Anonymizaanonymiza-tion Toolkit (CAT) [25] performs Risk Analysis by evaluating the dis-closure of risks of each value in pseudonymized data based on user specified assumptions about the adversary’s back-ground knowledge. These tools offer important insights to identify privacy risks; and in our approach we seek to integrate similar capabilities (alongside fine-grained user privacy consideration) into our privacy-by-design methodology for developing distributed data services.
Differential privacy [15] is a technique that provides strong formal guarantees of the privacy of users where personal data is released from statistical databases. Rather than changing the dataset itself (as with pseudonymiza-tion methods), differential privacy adds noise to the out-put of queries performed on the data. This guarantees that for any query, or sequence of queries, a subject and their personal data cannot be identified. Hence, it is an alternative method to achieving the same results as using the pseudonymization framework of this paper. However, there are downsides in the face of such strong privacy guarantees; i.e. the difficulty in developing the correct noise functions, the cases where the need to add too much noise reduces the statistical utility of the data, and also the situations where data is released without knowing what functions will be performed on it. Hence, developers will
continue to consider pseudonymization methods, which this tool supports. There are tools and frameworks to help non-experts carry out differential privacy e.g. PSI [26] and Adaptive Fuzz [27], therefore an interesting avenue of future research is to consider privacy requirements and risk across the differing methods.
7.2 Privacy frameworks
Both Fischer [11] and Kosa [10] define formal models of privacy in terms of state machine representations. Their purpose to demonstrate that a system complies with pri-vacy regulations and requirements. Such models offer strong building blocks that our formal privacy model builds upon; in particular moving from hand-crafted spec-ifications to auto-generated models that underpin the privacy engineering process and privacy risk analysis. MAPaS [28], is a model-based framework for the spec-ification and analysis of privacy-aware systems. Centred upon a UML Profile, purpose-based access control sys-tems are modelled and the framework allows queries to be executed to identify errors in the design.
LINDDUN [29] is a framework for performing pri-vacy threat analysis on the design of a system in order to select privacy enforcing mechanisms that mitigate the threats. This combines a data flow model of the system with a privacy threat catalogue to provide a design-time methodology to assess privacy risks. We similarly employ a data-flow oriented methodology but explore the extent risk can be analysed automatically via the generation of an underpinning formal model. Further, we consider the use of MDE methods beyond the design phase (and in particular analysis of running systems with real users).
A system’s behaviour should be matched against it’s own privacy policy. [30] models a system’s behaviour in terms of a Business Processing Model Notation (BPMN) diagram and then the goal is to check whether this is compliant with the system’s P3P privacy policy. [31] inte-grate links to the privacy policy in the system’s workflow (e.g. the BPEL specification), these are then checked by an analysis tool at design time to determine if the workflow agrees with the policy. [6] provide a similar method; rather than having a designer merge the workflow and policy, the approach converts both models (a BPEL specification and P3P policy) into a graph representation before for-mally analyzing the correctness of the graph. However, all of these solutions only check if a system behaves accord-ing to its stated privacy policy (our LTS can be similarly analysed); there has been limited research into the eval-uation of a system in terms of privacy risk considering fine-grained user preferences.
8 Conclusion
actor system. It identifies pseudonymization risk and pro-vides easily understandable information to help a user without expert knowledge choose a pseudonymization strategy. The concept of individual policy is central to this system to ensure that the preferences of individual data subjects are taken into account. Risk is quantified based on policy violation and also based on what impact removing these violations will make from a statistical point of view. Transparency is also key. By integrating these concerns into pseudonymization and integrating pseudonymization into a larger privacy framework the system developed goes beyond existing pseudonymization techniques. We have demonstrated through an exper-imental evaluation) that, in variable policy scenarios, simply choosing a more thorough pseudonymizing tech-niques is not sufficient to eliminate violations and so more information is needed to help the user choose a pseudonymization strategy. This system may be useful either for a system designer designing a system or for a data controller supervising a system.
Future Work. A set of standard pseudonymization techniques could be provided so that the user doesn’t have to manually input pseudonymized data although with the existence of more complete tools such as arx this may not be necessary. Challenges here concern the huge number of tunable parameters involved in the pseudonymization process. Utility metrics will also ultimately be improved. In particular correlations will be incorporated as corre-lations between fields is often more important in data analysis than the statistical properties of individual fields. Risk (and consequently violation) calculations can be improved by incorporating more situations, such as when an attacker does not know the value of a quasi identifier exactly for their target but access to this quasi identifier, pseudonymized or not, may still provide clues for value prediction.
We are also investigating the integration of the rule-based decision system (predicated on the util-ity reports) into distributed systems software; such as privacy-oriented middleware and cloud protection systems. Enabling fine-grained user privacy enforce-ment where the system automatically makes decisions as to whether a disclosure of pseudonymized data will be allowed for any occurring distributed system action.
Endnotes
1org.apache.commons.math3.stat.descriptive.
DescriptiveStatistics
2
https://github.com/OPERANDOH2020/op-privacy-modelling
3details of this user privacy study is currently under
submission
Abbreviations
BMI: Body mass index; BPMN: Business processing model notation; BPEL: Business process execution language; CAT: Cornell anonymization toolkit; LTS: Labelled transition system; MDE: Model drive engineering
Acknowledgements
This work was supported by the European Commission under the Horizon 2020 Programme (H2020), as part of the OPERANDO project (Grant Agreements no. 653704).
Availability of data and materials
The software and data supporting the conclusions of this article are available fromhttps://github.com/OPERANDOH2020/op-privacy-modelling.
Authors’ contributions
GN conceived the pseudonymization risk analysis algorithms, and designed and performed the experiments. PG, DB, MS and GN conceived and developed the underlying user privacy model theory and framework design. GN and PG implemented the software framework used in the paper. MS supervised the research project. All authors discussed the results, contributed to, and approved the final manuscript.
Ethics approval and consent to participate Not applicable.
Consent for publication Not applicable.
Competing interests
The authors declare that they have no competing interests.
Publisher’s Note
Springer Nature remains neutral with regard to jurisdictional claims in published maps and institutional affiliations.
Received: 2 May 2018 Accepted: 24 October 2018
References
1. Kumaraguru P, Cranor LF. Privacy indexes: a survey of westin’s studies. 2005.
2. Acquisti A, Brandimarte L, Loewenstein G. Privacy and human behavior in the age of information. Science. 2015;347(6221):509–14.
3. Hildebrandt M. Profile transparency by design? re-enabling double contingency; 2013.
4. Sweeney L. k-anonymity: A model for protecting privacy. Int J Uncertain Fuzziness Knowl-Based Syst. 2002;10(05):557–70.
5. Machanavajjhala A, Gehrke J, Kifer D, Venkitasubramaniam M. L-diversity: privacy beyond k-anonymity. In: 22nd International Conference on Data Engineering (ICDE’06); 2006. p. 24.
6. Li YH, Paik H-Y, Benatallah B. Formal consistency verification between bpel process and privacy policy. In: Proceedings of the 2006 International Conference on Privacy, Security and Trust. ACM; 2006. p. 26.
7. Hadar I, Hasson T, Ayalon O, Toch E, Birnhack M, Sherman S, Balissa A. Privacy by designers: software developers’ privacy mindset. Empir Softw Eng. 2018;23(1):259–89.
8. Cavoukian A. Privacy by design. Take the challenge. Information and privacy commissioner of Ontario, Canada. 2009.
9. Grace P, Burns D, Neumann G, Pickering B, Melas P, Surridge M. Identifying privacy risks in distributed data services: A model-driven approach. In: Proceedings of the 2018 IEEE International Conference on Distributed Computing Systems. ICDCS ’18; 2018.
10. Kosa TA. Towards measuring privacy. PhD thesis, University of Ontario Institute of Technology. 2015.
11. Fischer-Hübner S, Ott A. From a formal privacy model to its implementation. In: Proceedings of the 21st National Information Systems; 1998.
Availability, Reliability and Security. ARES ’17. New York: ACM; 2017. p. 91–1918.
13. Norberg PA, Horne DR, Horne DA. The privacy paradox: Personal information disclosure intentions versus behaviors. J Consum Aff. 41(1): 100–126.
14. Hay M, Miklau G, Jensen D, Towsley D, Weis P. Resisting structural re-identification in anonymized social networks. Proc VLDB Endowment. 2008;1(1):102–14.
15. Dwork C. Differential privacy: A survey of results. In: Agrawal M, Du D, Duan Z, Li A, editors. Theory and Applications of Models of Computation. Berlin: Springer; 2008. p. 1–19.
16. Aggarwal CC. On k-anonymity and the curse of dimensionality. In: Proceedings of the 31st International Conference on Very Large Data Bases; 2005. p. 901–9. VLDB Endowment.
17. Fryar CD, Gu Q, Ogden CL. Anthropometric reference data for children and adults: United states, 2007-2010. Vital health statistics. Series 11, Data from the national health survey. 2012;252:1–48.
18. Prasser F, Kohlmayer F, Gkoulalas-Divanis A, Loukides G. Putting Statistical Disclosure Control into Practice: The ARX Data Anonymization Tool. Cham: Springer; 2015, pp. 111–48.
19. Li N, Li T, Venkatasubramanian S. t-closeness: Privacy beyond k-anonymity and l-diversity. In: 2007 IEEE 23rd International Conference on Data Engineering; 2007. p. 106–15.
20. Samarati P, Sweeney L. Protecting privacy when disclosing information: k-anonymity and its enforcement through generalization and suppression. Technical report, Technical report, SRI International. 1998. 21. Agrawal R, Srikant R. Privacy-preserving data mining. In: ACM Sigmod
Record, vol. 29. ACM; 2000. p. 439–50.
22. Aggarwal CC, Philip SY. A condensation approach to privacy preserving data mining. In: International Conference on Extending Database Technology. Springer; 2004. p. 183–99.
23. Xiao X, Tao Y. Personalized privacy preservation. In: Proceedings of the 2006 ACM SIGMOD International Conference on Management of Data, SIGMOD ’06. New York: ACM; 2006. p. 229–40.
24. Aggarwal CC, Yu PS. On variable constraints in privacy preserving data mining. In: Proceedings of the 2005 SIAM International Conference on Data Mining. SIAM; 2005. p. 115–25.
25. Xiao X, Wang G, Gehrke J. Interactive anonymization of sensitive data. In: Proceedings of the 2009 ACM SIGMOD International Conference on Management of Data. SIGMOD ’09. New York: ACM; 2009. p. 1051–4. 26. Murtagh J, Taylor K, Kellaris G, Vadhan S. Usable Differential Privacy: A
Case Study with PSI. ArXiv e-prints. 2018.
27. Winograd-Cort D, Haeberlen A, Roth A, Pierce BC. A framework for adaptive differential privacy. Proc ACM Program Lang. 2017;1(ICFP): 10–11029.
28. Colombo P, Ferrari E. Towards a modeling and analysis framework for privacy-aware systems. In: 2012 International Conference on Privacy, Security, Risk and Trust and 2012 International Confernece on Social Computing; 2012. p. 81–90.
29. Deng M, Wuyts K, Scandariato R, Preneel B, Joosen W. A privacy threat analysis framework: supporting the elicitation and fulfillment of privacy requirements. J Requir Eng. 2011;16(1):3–32.
30. Chinosi M, Trombetta A, et al. Integrating privacy policies into business processes. J Res Pract Inf Technol. 2009;41(2):155.