R E S E A R C H
Open Access
Alcohol consumption and its interaction
with adiposity-associated genetic variants
in relation to subsequent changes in waist
circumference and body weight
Jeanett F Rohde
1,2*†, Lars Ängquist
2†, Sofus C. Larsen
1,2†, Janne S. Tolstrup
3, Lise Lotte N. Husemoen
4,
Allan Linneberg
4,5,6, Ulla Toft
4, Kim Overvad
7,8, Jytte Halkjær
9, Anne Tjønneland
9, Torben Hansen
10,
Oluf Pedersen
10, Thorkild I. A. Sørensen
2,10,11and Berit L Heitmann
1,2,3,12,13Abstract
Background:Studies have suggested a link between alcohol intake and adiposity. However, results from longitudinal studies have been inconsistent, and a possible interaction with genetic predisposition to adiposity measures has often not been taken into account.
Objective:To examine the association between alcohol intake recorded at baseline and subsequent annual changes in body weight (ΔBW), waist circumference (ΔWC) and WC adjusted for BMI (ΔWCBMI), and to test for interaction with genetic predisposition scores based on single nucleotide polymorphisms (SNPs) associated with various forms of adiposity.
Method:This study included a total of 7028 adult men and women fromMONICA, the Diet, Cancer and Health cohort (DCH), and the Inter99 studies. We combined 50 adiposity-associated SNPs into four scores indicating genetic predisposition to BMI, WC, WHRBMI and all three traits combined. Linear regression was used to examine the association of alcohol intake (drinks of 12 g (g) alcohol/day) with ΔBW, ΔWC, and ΔWCBMI, and to examine possible interactions with SNP-scores. Results from the analyses of the individual cohorts were combined in meta-analyses.
Results: Each additional drink/day was associated with a ΔBW/year of −18.0 g (95% confidence interval (CI):
−33.4, −2.6, P = 0.02) and a ΔWC of −0.3 mm/year (−0.5, −0.0, P = 0.03). In analyses of women only, alcohol intake was associated with a higherΔWCBMI of 0.5 mm/year (0.2, 0.9, P = 0.002) per drink/day. Overall, we found no statistically significant interactions between the four SNP-scores and alcohol intake in relation to changes in adiposity measures. However in analyses of women separately, we found interaction between the complete score of all 50 SNPs and alcohol intake in relation to ΔBW (P for interaction = 0.03). No significant interaction was observed among the men.
(Continued on next page)
* Correspondence:jeanett.friis.rohde@regionh.dk
†Equal contributors
1Research Unit for Dietary Studies at the Parker Institute, Bispebjerg and Frederiksberg Hospital, the Capital Region, Copenhagen, Nordre Fasanvej 57, entrance 5, ground floor, 2000 Frederiksberg, Denmark
2Department of Clinical Epidemiology (Formerly‘Institute of Preventive Medicine’), Bispebjerg and Frederiksberg Hospital, the Capital Region, Nordre Fasanvej 57, Hovedvejen, entrance 5, first floor, 2000 Frederiksberg, Denmark Full list of author information is available at the end of the article
(Continued from previous page)
Conclusion: Alcohol intake was associated with a decrease in BW and WC among men and women, and an
increase in WCBMI among women only. We found no strong indication that these associations depend on a genetic predisposition to adiposity.
Trial registration: Registry: ClinicalTrials.gov Trial number: CT00289237, Registered: 19 September 2005 retrospectively registered.
Keywords: Alcohol, Weight change, Waist change, Genetic predisposition, SNP score, Gene-diet interaction,
Background
Alcoholic beverages are energy dense and often an addition to the total daily energy intake from other macronutrients. These extra calories from alcohol may contribute to weight gain. A cross-sectional study by Tolstrup et al. 2005 [1] showed that total al-cohol intake among men and women was directly as-sociated with high body mass index (BMI) (≥30 kg/ m2) and large waist circumference (WC) (≥102 cm for men and ≥88 cm for women) [1]. The same study also showed that among both men and women, fre-quent drinking was associated with the lowest odds of being overweight and having an increased WC for given level of total alcohol intake [1]. Another study, using follow-up data from the same cohort, found that drinking frequency was inversely associated with subsequent major waist gain, and not associated with major waist loss [2]. Alcohol consumption has also shown to be a contributing factor to an increase in body weight, body fat and BMI among Korean women [3]. However, the majority of cross-sectional studies published since 2005 indicates no association between light to moderate alcohol intake and obesity [4]. Adding to the complexity, studies have found that type of alcohol may affect weight differently; thus, intake of wine may protect against weight gain, whereas intake of spirits and beer may be directly associated with weight gain, but this still needs confirmation [4–6].
The inconsistent evidence relating alcohol intake to the development of obesity may be the product of not taking potential confounding factors or effect modifiers into account, such as gender, frequency and amount of alcohol, sleeping habits, physical activity, disease and history of alcohol use [4, 5]. Smoking is also strongly associated with alcohol intake [7] and may have a confounding effect on the relationship between alcohol intake and body weight changes. However, also genetic influences may be involved in these associations. Indeed, Corella et al. 2012 examin-ing the interaction of variants of the MC4R and FTO genes with various dietary factors including alcohol consumption on obesity did not find evidence for in-teractions with alcohol, but they found lower alcohol consumption in people carrying the variant alleles [8].
Furthermore, Greenfield et al. 2003 [9] in a co-twin case-control study including 334 female twins, showed an inverse relationship between alcohol consumption and total and abdominal fat, independently of known environmental confounders. However, they also found that the association between moderate alcohol consumption and abdominal, but not total fat was dependent on genetic risk; those genetically predis-posed appeared protected against abdominal fat accu-mulation. In these individuals, a daily intake of 1–1.5 alcoholic drinks was associated with approximately 20% less abdominal fat than among individuals of a similar genetic risk with alcohol intakes of less than one drink per week [9].
On this background, we aimed to investigate the as-sociation between alcohol intake and changes in body weight (BW) (ΔBW; g/year), in WC (ΔWC; mm/year), and in WC adjusted for given BMI (ΔWCBMI; mm/
year), over a period of 5 years, while taking relevant confounding factors and possible interaction with gender into account. We further aimed to investigate the possible interaction between alcohol intake and molecular genetic predisposition, assessed by scores based on single nucleotide polymorphisms (SNPs), as-sociated to various forms of adiposity, in relation to
ΔBW, ΔWC or ΔWCBMI.
Methods
Information for this study was obtained from three different Danish cohorts of adults; The MONICA, the
Inter99 and the Diet, Cancer and Health (DCH)
studies, with no possibility of overlapping participants. Furthermore, all participants had information on alco-hol intake and subsequent changes in anthropometric measurements. Also information on SNPs associated with different measures of adiposity, as well as infor-mation on potential confounders was available. In total, 7028 participants were included in the present study.
The cohorts
Monica
TheMONICA(MONItoring trends and determinants of
and women born in 1922,1932,1942 and 1952 from 11 municipalities around the former Copenhagen County. Of these, 3608 participated in a baseline health examination during 1982–1983 and 5 years later during 1987–1988. In total, 2987 men and women chose to participate in the second health examination [10]. Between 1982 and 1983, a total of 1852 participants completed a 7-day dietary record [11]. Moreover, 1578 participants had information on relevant covariates and repeated measurements on body weight, and 1426 participants had information on genetic variants. Participants with prevalent cancer (n = 16), cardiovascular disease (n = 61) or diabetes (n = 20) at baseline were excluded from this study. Furthermore, participants with incident cancer (n = 13), cardiovascular disease (n = 57) or self-reported diabetes (n = 2) during follow-up were also excluded. The final cohort-population consisted of 1257 participants.
Inter99
Inter99 was a randomised multifactorial lifestyle inter-vention study (CT00289237, ClinicalTrials.gov), focusing on prevention of ischemic heart disease through repeated lifestyle counselling. Short-term outcomes in-cluded changes in lifestyle factors, plasma cholesterol, blood pressure and body mass index. The study was con-ducted in 11 municipalities around the former Copenhagen County. The study group was a randomly se-lected age- and gender-stratified sample of 13,016 people born between 1939 and 1940, 1944–1945, 1949–1950, 1954–1955, 1959–1960, 1964–1965 and 1969–1970 and were all invited to a baseline health examination during 1999–2001. A total of 6784 accepted to participate in the baseline examination, where blood samples and physical tests were taken. Moreover, self-administered question-naires regarding health status and validated 198-item food frequency questionnaires (FFQ) [12] were filled out. Participants were invited to participate in a follow-up examination during 2004–2006 [13]. In total, 4544 partici-pants had information from baseline and follow-up exam-ination on diet, genes, anthropometric measures and information on potential confounders. The study, and each intervention component, has been described in detail elsewhere [14, 15].
For this study, participants with prevalent cancer (n = 87), cardiovascular disease (n = 318) or self-reported diabetes (n = 93) at baseline, and participants with incident cancer (n = 68), cardiovascular disease (n = 254) or self-reported diabetes (n = 118) were excluded. The final cohort population consisted of 3606 participants.
Diet, cancer and health study
The DCH study was based on a total of 160,725 men and women, with no diagnosis of cancer in the Danish
Cancer Register, from the Aarhus and Copenhagen area that were invited to participate in a baseline examination during 1993–1997 and a follow-up examination during 1999–2000 [16]. In total 57,053 accepted the invitation. All participants filled in a lifestyle questionnaire and a 192 item semi-quantitative FFQ and had their anthropo-metric measurements taken. For the DiOGenes study, a sub-cohort was selected from the DCHStudy, including only the individuals who were younger than 60 yrs. at baseline and younger than 65 yrs. at follow-up in order to avoid the aging-related sarcopenia. Moreover, partici-pants diagnosed with cancer, cardiovascular disease or diabetes at baseline and those who developed these diseases during follow-up were excluded. Participants were only included if they had stable smoking habits and had an average BW gain of no more than 5 kg/year dur-ing baseline and follow-up. A subsample of 2409 partici-pants was selected, and it comprised 1200 (600 men and 600 women) body weight gainers, and 1209 randomly selected participants as controls. Body weight gainers were defined as those in the sub-cohort selected for DiOGenes who experienced the greatest annual weight gain during the follow-up period, and they were identi-fied by using the residuals from a gender-specific regres-sion model of annual BW change on baseline values of age, BW, height, smoking status and follow-up time. The randomly selected participants included 79 partici-pants who were also defined as weight gainers, and they were excluded from the analyses (n = 1130) [17]. In total, 2165 had information on genes, alcohol intake co-variates andΔBW (2128 in analyses ofΔWC). However, 278 of these only had genetic information on FTO (rs9939609). The final cohort population therefore con-sisted of up to 2165 participants.
Anthropometric measurements
In all three cohorts, baseline height and BW were mea-sured to the nearest 0.5 cm for height and 0.1 kg for weight. Due to missing information on WC at baseline in the MONICA study, this study was not included in the analyses on changes in WC. In both theInter99and the DCH cohort, baseline WC was measured to the nearest 1 cm, horizontally midway between the lower rib margin and iliac crest. The same procedures were used at follow-up. However, in theDCHthe measurements of BW and WC (measured at the level of the umbilicus) were self-reported, but instructions were given on how to carry out the measurements combined with a paper measuring tape. A validation study was conducted in the
WC regressed on BMI (gender- and study-specific re-gressions; separately for baseline and follow-up values).
This measure was used instead of waist-hip ratio ad-justed for BMI because no information on hip circum-ference was available at follow-up. The baseline correlation between waist-hip ratio adjusted for BMI and WCBMIwas 0.77 inDCHand 0.68 inInter99. Due to
dif-ferent follow-up time in the three cohorts, and between the individuals in each cohort, average changes per year in BW, WC and WCBMI was calculated as the difference
between baseline and follow-up divided by the follow-up time in years for each individual.
Assessment of alcohol intake
In all the cohorts, alcohol intake was recorded at baseline. In the MONICA study, intake of food and beverages was obtained by a 7-day dietary record and was completed within a 3 week period. Participants were given verbal and written instructions on how to record their diet. The individual average daily intake of macronutrients and total energy intake was calcu-lated using the software Dankost (http://dankost.dk/). For the Inter99 and DCH cohorts, FFQs were used to obtain information on diet and beverage intakes; very similar FFQs were used in both cohorts. The FFQs consisted of 198 and 192 items, respectively, and re-ferred to the average intake of different foods and beverages within the last year. The individual average daily intake of macronutrients and total energy intake were calculated using the software FoodCalc (http:// www.ibt.ku.dk/jesper/foodcalc/). Both Dankost and FoodCalc are based on the official Danish food-composition tables (http://frida.fooddata.dk/). The development and validation of the dietary records and FFQs used in the three cohorts has been described in detail elsewhere [12, 19, 20]. Alcohol intake was recorded as the average daily intake of beer, wine, dessert wine, and spirits within the last 12 months [21, 22]. From this information, we calculated daily intake of alcohol, reported as number of standard drinks (which in Denmark is defined as 12 g alcohol) per day, and total daily energy intake. Both alcohol consumption and total energy intake were included in the analysis as continuous variables.
Possible confounders
Information on physical activity (PA) was self-reported in all three cohorts. In the MONICAstudy, participants were asked to classify themselves into one out of four categories: 1) Almost completely inactive, 2) Some physical activity, 3) Regular to hard activity, and 4) Hard activity. The validated Cambridge Physical Activity Index was used to assess PA in theDCHcohort [23] and was also categorised into four groups: 1) Inactive, 2)
Moderately inactive, 3) Moderately active and 4) Active. In the Inter99 study, information on time spent commuting and leisure time PA was used to categorize participants into four groups as: 1) 0- < 2 h/week, 2) 2- < 4 h/week, 3) 4- < 7 h/week and 4) ≥7 h/week. All participants had reported smoking habits and informa-tion was categorised into five groups: 1) Never smoked, 2) Former smokers, 3) tobacco 0- < 15 g/day, 4) tobacco 15- < 25 g/day and 5) tobacco ≥25 g/day. All participants gave information on years of regular schooling and this information was categorized as having school education above or below the primary level. Finally, information on age, gender, baseline height, menopausal status in women and total energy intake was available in all cohorts.
SNP selection and genotyping
Based on a review of genome-wide association studies (GWAS) until 2010, 58 SNPs were identified to be as-sociated with BMI, WC or WHRBMI [24–36] and 50
of these SNPs were available in all 3 cohorts (Additional file 1). SNPs have not been investigated for their associations with WCBMI, but the SNPs
asso-ciated with WHRBMI were considered pertinent to the
WCBMI, phenotype. Both in the MONICA and DCH
cohort the SNPs were genotyped using the KASPar SNP genotyping method (KBioscience, Hoddesdo-n,UK) and the average genotyping success rates were respectively 98.3% in the MONICA cohort and 97.8% in the DCH cohort; 185 replicate samples in the DCH
cohort had a success rate above 98% and an error rate below 0.5%. The SNPs were also successfully ge-notyped in the Inter99 study using either the KASPar SNP genotyping method, or through Human Cardio-metabo bead chip array [37] with an average success rate of 96.7%.
Genetic predisposition score
For every individual, the 50 SNPs were recoded into 0/1/ 2 according to number of obesity-associated risk alleles. Furthermore, genetic predisposition for each individual was defined through four SNP-scores and, in addition to the total score consisting all 50 SNPs, three phenotype-specific scores were created [38]. These SNP-scores have been shown to be associated with their concurrent phenotypes in our cohorts [38]. Scores were based on summing up the number of risk alleles with respect to contributing SNPs, a BMI score was based on 33 SNPs, a WC score on 6 SNPs, and the WHRBMI score on 14
Statistical analyses
Multiple linear regression models were used to examine the association between alcohol intake and changes in BW, WC and WCBMI with adjustments for baseline
measure of outcome, age, gender, height, smoking status, education, PA, and menopausal status. WCBMI was
additionally adjusted for baseline BMI. Males were coded as a separate menopausal group and the software took care of this inherited dependence (between gender and menopausal status) in the analysis while all men still remained in the analyzed sample.
We performed analyses both with and without adjustment for total energy intake. Inclusion of total energy in the model introduces a substitution model, implying conditioning on total energy, where a higher alcohol intake must be followed by a lower intake of energy from other non-specified sources. In the ana-lyses without total energy intake, alcohol intake may in this sense vary without concomitant differences in the diet. Since no substantial difference was seen in the results from the two models, only the energy-adjusted results are presented.
Moreover, to examine whether genetic predisposition modifies the association between alcohol intake and changes in BW, WC and WCBMI, statistical interaction
was investigated by adding SNP-score and SNP-score × alcohol variables to the model. Additionally, similar interaction analyses based on single SNPs and alcohol intake with adjustment for the same set of confounders as mentioned earlier were also performed.
Finally, we tested for gender interactions by adding product terms to the models (2-way interactions: alcohol × gender; and 3-way interactions: SNP-score × alcohol × gender). Significant interactions were further evaluated through stratified analyses.
After performing the analyses in each cohort, a fixed-effects meta-analysis, based on inverse variance-weighting, was performed in order to combine results from the three cohorts.
All analyses were performed using Stata 12.1 (StataCorp LP, College Station, Texas; www.stata.com) and p-values of ≤0.05 were considered as statistically significant. However, adjustment for multiple testing using the Bonferroni method was performed for the interaction ana-lyses based on single SNPs and in the interaction anaana-lyses based on gender.
Sensitivity analyses
To check the robustness of the results, a number of sen-sitivity analyses were performed. We included baseline levels of the anthropometric measures in the primary models to avoid confounding or regression towards the mean. However, it has been suggested that adjustment for baseline values in analyses of changes can cause bias
[39]. Thus, supplementary analyses were conducted without any adjustments for baseline measures of outcome variables. Finally, analyses were performed de-manding stable smoking habits, i.e. by excluding individ-uals with non-stable smoking habits. Smoking stability was here indicated through belonging to the same smok-ing category both at baseline and at follow-up, where three categories were defined: 1) Never smokers, 2) Ex-smokers/occasional smokers and 3) Current smokers.
Results
In total, 7028 participants were included in the present study, with 1257, 2165 and 3606 individuals from the
MONICA,DCHandInter99studies, respectively.
Charac-teristics of the participants, together with information on alcohol intake, total energy intake, anthropometric mea-surements, SNP scores and covariates are given in Table 1. The table shows that subjects from the MONICA and DCH cohorts had the highest median alcohol intake (1.0 drink/day [5th–95th range: 0.0, 5.0] and 1.0 drink/day [0.0, 5.4] respectively). The lowest intake of alcohol was seen in the Inter99 cohort with a median intake of 0.8 (0.0, 4.3). Participants in the DCH cohort showed the highestΔBW with a median of 1.0 kg/year (1.1, 2.4) and
ΔWC with a median of 1.4 cm (−0.8, 4.4). The genetic predisposition scores were nearly identical in the three co-horts in term of median and 5th/95th percentiles.
Information on the included SNPs, together with in-formation on which obesity traits they have been found to be associated with are presented in Additional file 1.
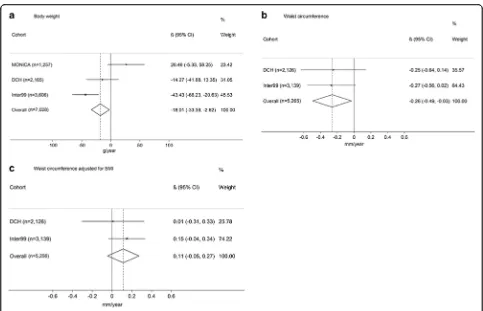
The associations between alcohol intake and ΔBW,
ΔWC andΔWCBMI are presented in Fig. 1. Results from
the meta-analyses showed an inverse relationship be-tween alcohol intake and ΔBW (−18.0 g per drink/day, [−33.4,-2.6],P= 0.02) (Fig. 1a). We also found an inverse association between alcohol intake andΔWC (−0.26 mm per drink/day, [−0.5, −0.0], P = 0.03) (Fig. 1b). No sig-nificant association was seen for ΔWCBMI (0.1 mm per
drink/day, [−0.1, 0.3],P= 0.17) (Fig. 1c).
Interactions between the four SNP-scores and alcohol intake in relation toΔBW, ΔWC and ΔWCBMI are
pre-sented in Fig. 2. Overall, the meta-analyses showed no interactions for any of the SNP-scores in relation to
ΔBW,ΔWC orΔWCBMI.
Furthermore, after multiple testing, no significant re-sults were seen in any of the interaction analyses based on individual SNPs in relation to ΔBW, ΔWC or
ΔWCBMI(Additional files 2, 3 and 4).
We found no significant interactions between gender and alcohol intake in relation to ΔBW or ΔWC. However, we did find an interaction between gender and alcohol in relation to ΔWCBMI (P = 0.01). In stratified
[0.2, 0.9],P= 0.002), but not among men (−0.03 mm per drink/day, [−0.2, 0.1],P = 0.75). In addition, we found a significant 3-way interaction between the complete score of all 50 SNPs, alcohol and gender in relation to ΔBW (P= 0.006). For women, each additional risk allele from the complete score was associated with a ΔBW of
−10.2 g (−19.3, −1.1, P= 0.03) per drink of alcohol/day, while no significant interaction was observed among the men. When evaluating interaction effects from the indi-vidual SNPs included in the complete score, we found nominal significant interactions between alcohol and
SFRS10 (rs7647305), DNM3-PIGC (rs1011731) and TNNI3K (rs1514175) among women, suggesting that each additional risk allele from these variants was associ-ated with a lower ΔBW. For rs7647305, each additional risk allele was associated with a ΔBW of −86 g per drink/day (95% CI: -143, −29, P = 0.003), while each additional rs1011731 risk allele was associated with a
ΔBW of −62 g per drink/day (95% CI: -108, −16,
P = 0.008) and each additional rs1514175 risk allele was associated with aΔBW of−52 g per drink/day (95% CI: -98, −5, P = 0.03). None of these variants showed Table 1Information on alcohol intake, anthropometric measurements, genetic predisposition scores and covariates1
MONICA1 DCH Inter99
N 1257 2165 3606
Follow-up time (years) 5.0 (4.9; 5.3) 5.3 (5.0; 5.8) 5.4 (5.1; 5.7)
Dietary variables
Alcohol intake (drinks/day) 1.0 (0.0; 5.0) 1.0 (0.0; 5.4) 0.8 (0.0; 4.3)
Energy (MJ/d) 9.0 (5.1; 14.9) 8.8 (5.3; 14.3) 9.4 (5.2; 15.8)
BW (kg)
Baseline (kg) 69.0 (52.0; 93.0) 77.1 (56.8; 104.4) 75.2 (54.9; 102.4)
Follow-up (kg) 69.9 (51.4; 94.7) 82.0 (58.0; 110.0) 76.0 (55.5; 103.5)
ΔBW (kg/year) 0.2 (−1.0; 1.6) 1.0 (−1.1; 2.4) 0.2 (−1.4; 1.7)
WC (cm)
Baseline (cm) - 90.0 (70.0; 112.0) 84.0 (67.0; 105.0)
Follow-up (cm) - 98.0 (76.0; 121.0) 87.0 (69.0; 109.0)
ΔWC (cm/year) - 1.4 (−0.8; 4.4) 0.5 (−1.3; 2.5)
WCBMI(cm)
Baseline (cm) - −0.3 (−7.9; 9.1) −0.2 (−7.7; 8.5)
Follow-up (cm) - −0.2 (−11.5; 12.6) −0.2 (−8.2; 9.1)
ΔWCBMI(cm/year) - −0.0 (−2.0; 2.2) 0.0 (−1.4; 1.2)
SNP-based variables2
BMI score 29 (23;35) 28 (23; 35) 29 (23; 34)
WC score 3 (1; 6) 3 (1; 6) 3 (1; 6)
WHRBMIscore 14 (10; 18) 14 (10; 18) 14 (10; 18)
Complete score 44 (37; 52) 44 (37; 51) 44 (36; 51)
Covariates
Age, baseline (years) 41.4 (30.6; 61.1) 53.0 (50.0; 58.0) 45.0 (34.7; 59.8)
Height (cm) 169.0 (156.0; 184.0) 171.0 (157.5; 186.0) 172.0 (158.0; 187.5)
Gender, female (%) 52.1 49.4 51.4
Smoking, never smokers (%) 30.1 41.4 40.8
Education,≤primary school (%) 34.5 30.2 24.9
Physical activity, most sedentary group (%) 21.6 9.5 11.2
Menopausal status, post-menopausal (%) 41.7 55.6 25.9
Abbreviation: Body Mass Index (BMI), Body Weight (BW), Waist Circumference (WC), Waist-Hip-Ratio (WHR)
1
Results presented as median (5–95 percentiles) unless otherwise stated
1
Information on WC was not available in the MONICA cohort
2
significant interaction with alcohol among the men. Finally, we observed a significant 3-way interaction between the WHRBMI score, alcohol and gender in
relation to ΔBW (P = 0.04). However, in stratified ana-lyses we found no significant WHRBMI-score × alcohol
interaction for men or women. Moreover, using multiple testing correction, based on the Bonferroni-adjustment in the analysis on gender interaction, lead to that no re-sults remained significant after such corrections.
Sensitivity analyses conducted without adjustment for baseline measure of outcome, and with respect to exclusions of individuals with non-stable smoking habits, did not notably change the observed associa-tions (Additional files 5, 6, 7 and 8).
Discussion
The present study was designed in order to investigate the association between alcohol intake and ΔBW,ΔWC and ΔWCBMI and to examine possible interaction with
genetic predisposition to different measures of adiposity. In the meta-analyses of the three cohorts, we found a statistically significant inverse association between alcohol intake and ΔBW and ΔWC. Furthermore, alco-hol intake was associated with a higher ΔWCBMI, but
only among women. No statistically significant interac-tions were seen between alcohol and SNP-scores or with any individual SNPs. However, in analyses of women separately, we found interaction between the complete score of all 50 SNPs and alcohol intake in relation to
ΔBW. The confidence intervals were narrow, making it unlikely that notable interactions were overlooked.
The majority of previous cross-sectional studies indi-cated no association between light to moderate alcohol intake and obesity [4]. In addition, evidence from longi-tudinal studies are inconsistent, and several studies have found no association or inverse associations between al-cohol intake and BW change [4]. Similarly, our study showed inverse associations between alcohol intake and both ΔBW and ΔWC. This study further revealed that alcohol intake was associated with a higher ΔWCBMI
among women, which is in line with the findings re-ported by Hee-Ju et al. showing that alcohol consump-tion was associated with an increase in body weight, body fat and BMI among Korean women [3].
These findings were seen both with and without ad-justment for total energy, suggesting no mediation from total energy on the relationship between alcohol intake and weight development.
The number of previous studies on gene × alcohol interaction and adiposity is limited. In the study by Greenfield et al. 2003 [9], an interaction analysis sug-gested that women with a predisposition to abdominal obesity were protected by a moderate alcohol intake [9]. In line with this, results from our interaction analyses suggested that an interaction between the complete score of all 50 SNPs and alcohol may be present among women, only. Our results are to some extent also in line with previously reported results suggesting sexually dimorphic associations between a number of known var-iants and anthropometric traits [40], but whether or not the interaction with alcohol intake truly is gender-specific needs further investigation. Furthermore, as we found some evidence that SFRS10 (rs7647305), DNM3-PIGC (rs1011731) and TNNI3K (rs1514175) may inter-act with alcohol in relation toΔBW among women only, these specific variants may be worth investigating fur-ther in ofur-ther cohorts. However, we did not adjust our main analyses for multiple testing, and we cannot exclude that this is a false positive result. Indeed, with
an unadjustedp-value of 0.03, this interaction would not remain statistically significant when adjusting for the number of included SNP scores (i.e. unadjusted p-value of 0.03 × 4 SNP scores = 0.12).
The strengths of this study include the use of data from three large cohorts with detailed questionnaire in-formation on alcohol consumption and energy intake, repeated measures of anthropometry, as well as informa-tion on several potential confounders including detailed information on participants’ smoking habits. Also, we had information on 50 genetic variants found previously to be consistently associated with BMI, WC or WHRBMI,
at genome-wide significance levels, making it possible to calculate genetic risk scores. Furthermore, we conducted prospective analyses, thereby limiting the influence of reverse causality.
Our study also has some limitations. Although the genetic risk scores were based on information from many established BMI, WC and WHRBMI associated
SNPs, these variants only explain a limited proportion of the total variation in obesity (<2%). Also, the SNPs
included in this paper were identified through review of GWAS published until 2010 [24–36]. Since then, several additional variants have been identified. However, the newly identified SNPs generally explain an even smaller proportion of the variation in BMI, than those identified in the first rounds of GWAS [41, 42], Thus, if interac-tions between the genetic risk scores and alcohol intake in relation to change in weight and waist circumference depends on how much of the total genetic predisposition to obesity these explain, we would not expect additional SNPs to add much to the current results.
It may be considered to investigate other genetic vari-ants than those known to be associated with BMI and WC, such as variants affecting insulin sensitivity or fatty liver disease, which, may be bi-directionally implicated in the changes over time in BW and WC. However, such data was available only for some of the cohorts in the present study and hence analyses would be performed with sub-optimal power.
Moreover, while the included SNPs associate with the level of adiposity or fat distribution, they do not specifically associate with changes in the adiposity measures, and it is possible that another so far unidentified set of SNPs, specifically related to gain in general and abdominal obesity, may show different re-sults. Indeed, we showed previously that although these genetic risk scores were strongly associated with BW and WC in cross sectional designs, they were not generally associated with changes over time in BW or WC [38]. Also, although we included information on up to 7028 participants, it is possible true associations were still missed due to a lack of statistical power. Yet, the generally quite small effect-estimates and narrow CIs suggest that it is unlikely we have over-looked associations with any public health relevance. The dietary information on alcohol intake could be subject to misclassification. Non-differential misclassi-fication could have weakened the associations ob-served, but if some kind of selective under-reporting occurred, it could have led to spurious findings. Nevertheless, self-reported measures of alcohol intake show reasonable levels of reliability and validity [43]. In view of the small size of Denmark, and the homo-geneity of its population, it is very unlikely that there were any geographic differences, which potentially could have affected our outcomes, since all partici-pants came from either the greater Copenhagen area (the capital of Denmark) or Aarhus city (Second lar-gest city in Denmark). However, study heterogeneity could be a problem if studies outside Denmark were included.
Missing information on which type of alcohol that may have been responsible for the observed inverse as-sociation and the observed gender interaction is a
potential limitation of the present study. However, inves-tigating the interaction between type of alcohol intake and molecular genetic predisposition to adiposity in rela-tion to subsequent changes in waist circumference and body weight is beyond the scope of the present paper, but could be a relevant aim for future studies, if add-itional cohorts including the pertinent information could be identified. Although we adjusted for many potential confounders, we cannot exclude the possibility of un-measured or residual confounding potentially affecting our results. In this context, smoking habits are closely linked to both BW regulation and alcohol intake and in addition to baseline adjustment for smoking habits, we performed sensitivity analyses while excluding individ-uals with non-stable smoking habits and this did not change the observed associations. Furthermore, we did not exclude participants that were undergoing thyroid hormone therapy and hormone replacement therapy, however, we adjusted for menopausal status and since we expect this group to be a very small proportion of the entire study population of otherwise healthy individ-uals in general we do not think this would change the observed associations.
We cannot rule out whether underlying disease has affected our results, although through information from Danish health registers it was possible for us to exclude participants who had a chronic disease at baseline. In order to ensure that the results were not affected by diseases not yet diagnosed at baseline, we also excluded participants who developed a chronic disease during the follow-up period. Again results were essentially similar before and after this exclu-sion. Another limitation in the current study may be that the included cohorts and the study design were different. In general, no major differences were seen between the cohorts in relation to the main results, i.e. the associations between exposure and outcome, indicating that the other differences had little impact on the results. It may be argued that, given the diver-sity of study designs, combining the results of the three studies in a meta-analysis may be mislead-ing. However, our analyses did not indicate between-study heterogeneity of effects. Moreover, given the re-stricted sample sizes, a discussion of the reasons for differences in results based on study design would be too speculative.
The participants in this study were not necessarily rep-resentative of the general Danish population. This par-ticularly applies to the participants from the DCH
Conclusion
In conclusion, our longitudinal study suggests an inverse association between alcohol intake at baseline and ΔBW andΔWC over a period of approximately 5 years. However, this study could not demonstrate that the association be-tween alcohol consumption andΔBW,ΔWC orΔWCBMI
depends on genetic predisposition to obesity.
Additional files
Additional file 1:Information on the 50 SNPs included in this study. The individual SNPs are grouped according to their associated trait. (DOCX 19 kb)
Additional file 2:Interaction between each risk allele and alcohol intake (1 unit increase) in relation toΔBW (kg/year). Model adjusted for baseline measure of the anthropometrical variables of interest, age, gender, height, smoking status, education, PA, menopausal status and total energy intake. (DOCX 33 kb)
Additional file 3:Interaction between each risk allele and alcohol intake (1 unit increase) in relation toΔWC (cm/year). Model adjusted for baseline measure of the anthropometrical variables of interest, age, gender, height, smoking status, education, PA, menopausal status and total energy intake. (DOCX 28 kb)
Additional file 4:Interaction between each risk allele and alcohol intake (1 unit increase) in relation toΔWCBMI(cm/year). Model adjusted for baseline measure of the anthropometrical variables of interest, age, BMI, gender, height, smoking status, education, PA, menopausal status and total energy intake. (DOCX 28 kb)
Additional file 5:Annual change in BW, WC and WCBMIper 1 alcohol unit/day increase in alcohol intake. (DOCX 14 kb)
Additional file 6:SNP score × alcohol interactions in relation to annual change in BW, WC and WCBMI. (DOCX 16 kb)
Additional file 7:Annual change in BW, WC and WCBMIper 1 alcohol unit/day increase in alcohol intake. (DOCX 14 kb)
Additional file 8:SNP score × alcohol interactions in relation to annual change in BW, WC and WCBMI. (DOCX 15 kb)
Abbreviations
BMI:Body mass index; BW: Body weight; CI: Confidence interval; DCH: Diet, Cancer and Health cohort; FFQ: Food frequency questionnaires; g: Gram; GWAS: Genome-wide association studies; PA: Physical activity; SNP: Single nucleotide polymorphisms; WC: Waist circumference; WCBMI: Waist circumference adjusted for Body Mass Index; WHR: Waist-Hip-Ratio; Yrs: Years
Acknowledgements
We would like to thank the participants in the three studies and all members of theInter99staff at Research Centre for Prevention and Health. TheInter99 study was initiated by Torben Jørgensen, DMSci (principal investigator); Knut Borch-Johnsen, DMSci, (co-principal investigator); Troels Thomsen, PhD; and Hans Ibsen, DMSci. The Steering Committee comprises Torben Jørgensen and Charlotta Pisinger, PhD, MPH.
Funding
This work was carried out as part of Gene-Diet Interactions in Obesity (GENDINOB) research program. GENDINOB was supported by the Danish Council for Strategic Research (Grant 09–067111). The Diet, Cancer and Health cohort was supported by the Danish Cancer Society. Data collection in the Inter99 study was supported economically by The Danish Medical Research Council, The Danish Centre for Evaluation and Health Technology Assessment, Novo Nordisk, Copenhagen County, The Danish Heart Foundation, The Danish Pharmaceutical Association, Agustinus foundation, Ib Henriksen foundation and Becket foundation. The source of funding had no influence on the manuscript.
Availability of data and materials
Data cannot be made publicly available for ethical and legal reasons. Public availability may compromise participant privacy, and this would not comply with Danish legislation.
Requests for data should be addressed to Professor Berit L Heitmann (Berit.Lilienthal.Heitmann@regionh.dk), Kim Overvad (ko@ph.au.dk) and Allan Linneberg (allan.linneberg@regionh.dk) who will provide the data access in accordance with the Danish Data Protection Agency.
Authors’contributions
JFR, BLH, TIAS conceived the study. LÄ, JFR, BLH, TIAS, SCL, JST planned the analyses. LÄ conducted the analyses. JFR and SCL drafted the manuscript. LÄ, BLH, TIAS, LLNH, AL, UT, KO, JH, AT, TH, OP helped interpret the results of the analyses and revised the manuscript. All authors read and approved the final manuscript.
Ethics approval and consent to participate
All procedures in the three cohorts were performed in accordance with the Helsinki Declaration and all participants provided written informed consent. TheMONICAstudy was approved by the Local Ethics Committee of Copenhagen County. TheDCHstudy was approved by the local ethical committees of Copenhagen and Frederiksberg municipalities and the Danish Data Protection Agency. TheInter99study was approved by The
Copenhagen County Ethical Committee and the National Board of Health. Inter99was also registered in the Clinical Trials.gov (NCT00289237).
Consent for publication Not applicable.
Competing interests
The authors declare that they have no competing interests.
Publisher’s Note
Springer Nature remains neutral with regard to jurisdictional claims in published maps and institutional affiliations.
Author details
1Research Unit for Dietary Studies at the Parker Institute, Bispebjerg and Frederiksberg Hospital, the Capital Region, Copenhagen, Nordre Fasanvej 57, entrance 5, ground floor, 2000 Frederiksberg, Denmark.2Department of Clinical Epidemiology (Formerly‘Institute of Preventive Medicine’), Bispebjerg and Frederiksberg Hospital, the Capital Region, Nordre Fasanvej 57, Hovedvejen, entrance 5, first floor, 2000 Frederiksberg, Denmark.3National Institute of Public Health, University of Southern Denmark, Øster Farimagsgade 5 A, 1353 Copenhagen K, Denmark.4Research Centre for Prevention and Health, Capital Region of Denmark, Nordre Ringvej 57, building 84-85, 2600 Glostrup, Denmark.5Department of Clinical Experimental Research, Rigshospitalet, Nordre Ringvej 57, 2600 Glostrup, Denmark.6Department of Clinical Medicine, Faculty of Health and Medical Sciences, University of Copenhagen, Blegdamsvej 3B, 2200 København N, Denmark.7Section for Epidemiology, Department of Public Health, Aarhus University, Nordre Ringgade 1, 8000 Aarhus C, Denmark.8Department of Cardiology, Aalborg University Hospital, Fredrik Bajers Vej 7-D3, 9220 Aalborg, Denmark.9Danish Cancer Society Research Center, Strandboulevarden 49, 2100 Copenhagen Ø, Denmark.10The Novo Nordisk Foundation Center for Basic Metabolic Research (Section of Metabolic Genetics), and Department of Public Health, Faculty of Health and Medical Sciences, University of Copenhagen, Nørre Alle 20, 2200 Copenhagen N, Denmark.11MRC Integrative Epidemiology Unit, Bristol University, Senate House, Tyndall Avenue, Bristol BS8 1TH, UK.12The Boden Institute of Obesity, Nutrition, Exercise & Eating Disorders, The University of Sydney, Sydney, NSW 2006, Australia.13Section for General Practice, Department of Public Health, University of Copenhagen, Øster Farimagsgade 5, entrance Q, 1014 Copenhagen K, Denmark.
Received: 12 October 2016 Accepted: 21 August 2017
References
2. Tolstrup JS, Halkjaer J, Heitmann BL, Tjonneland AM, Overvad K, Sorensen TI, et al. Alcohol drinking frequency in relation to subsequent changes in waist circumference. Am J Clin Nutr. 2008;87(4):957–63.
3. Kwon HJ, Cho IR, Park HJ, Kim TY. Effects of alcohol consumption frequency on health index in Korean women. Iran J Public Health. 2016 Aug;45(8):997–1003. 4. Traversy G, Chaput JP. Alcohol consumption and obesity: an update. Curr
Obes Rep. 2015;4(1):122–30.
5. Sayon-Orea C, Martinez-Gonzalez MA, Bes-Rastrollo M. Alcohol consumption and body weight: a systematic review. Nutr Rev. 2011;69(8):419–31. 6. Bendsen NT, Christensen R, Bartels EM, Kok FJ, Sierksma A, Raben A, et al. Is
beer consumption related to measures of abdominal and general obesity? A systematic review and meta-analysis. Nutr Rev. 2013;71(2):67–87. 7. Jensen MK, Sorensen TI, Andersen AT, Thorsen T, Tolstrup JS, Godtfredsen NS, et al.
A prospective study of the association between smoking and later alcohol drinking in the Danish population. Ugeskr Laeger. 2004;166(42):3718–22. 8. Corella D, Ortega-Azorin C, Sorli JV, Covas MI, Carrasco P, Salas-Salvado J, et
al. Statistical and biological gene-lifestyle interactions of MC4R and FTO with diet and physical activity on obesity: new effects on alcohol consumption. PLoS One. 2012;7(12):e52344.
9. Greenfield JR, Samaras K, Jenkins AB, Kelly PJ, Spector TD, Campbell LV. Moderate alcohol consumption, dietary fat composition, and abdominal obesity in women: evidence for gene-environment interaction. J Clin Endocrinol Metab. 2003;88(11):5381–6.
10. Heitmann BL, Hills AP, Frederiksen P, Ward LC. Obesity, leanness, and mortality: effect modification by physical activity in men and women. Obesity (Silver Spring). 2009;17(1):136–42.
11. Adegboye AR, Fiehn NE, Twetman S, Christensen LB, Heitmann BL. Low calcium intake is related to increased risk of tooth loss in men. J Nutr. 2010; 140(10):1864–8.
12. Toft U, Kristoffersen L, Ladelund S, Bysted A, Jakobsen J, Lau C, et al. Relative validity of a food frequency questionnaire used in the Inter99 study. Eur J Clin Nutr. 2008;62(8):1038–46.
13. Aadahl M, von Huth SL, Pisinger C, Toft UN, Glumer C, Borch-Johnsen K, et al. Five-year change in physical activity is associated with changes in cardiovascular disease risk factors: the Inter99 study. Prev Med. 2009;48(4):326–31.
14. Jorgensen T, Borch-Johnsen K, Thomsen TF, Ibsen H, Glumer C, Pisinger C. A randomized non-pharmacological intervention study for prevention of ischaemic heart disease: baseline results Inter99. Eur J Cardiovasc Prev Rehabil. 2003;10(5):377–86.
15. Bender AM, Jorgensen T, Helbech B, Linneberg A, Pisinger C.
Socioeconomic position and participation in baseline and follow-up visits: the Inter99 study. Eur J Prev Cardiol. 2014;21(7):899–905.
16. Tjonneland A, Olsen A, Boll K, Stripp C, Christensen J, Engholm G, et al. Study design, exposure variables, and socioeconomic determinants of participation in diet, cancer and health: a population-based prospective cohort study of 57,053 men and women in Denmark. Scand J Public Health. 2007;35(4):432–41.
17. Du H, Vimaleswaran KS, Angquist L, Hansen RD, van der AD, Holst C, et al. Genetic polymorphisms in the hypothalamic pathway in relation to subsequent weight change–the DiOGenes study. PLoS One. 2011;6(2):e17436.
18. Bigaard J, Spanggaard I, Thomsen BL, Overvad K, Tjonneland A. Self-reported and technician-measured waist circumferences differ in middle-aged men and women. J Nutr. 2005;135(9):2263–70.
19. Tjonneland A, Overvad K, Haraldsdottir J, Bang S, Ewertz M, Jensen OM. Validation of a semiquantitative food frequency questionnaire developed in Denmark. Int J Epidemiol. 1991;20(4):906–12.
20. Overvad K, Tjonneland A, Haraldsdottir J, Ewertz M, Jensen OM. Development of a semiquantitative food frequency questionnaire to assess food, energy and nutrient intake in Denmark. Int J Epidemiol. 1991;20(4):900–5. 21. Benzon LS, Vogel U, Christensen J, Hansen RD, Wallin H, Overvad K, et al.
Interaction between ADH1C Arg(272)Gln and alcohol intake in relation to breast cancer risk suggests that ethanol is the causal factor in alcohol related breast cancer. Cancer Lett. 2010;295(2):191–7.
22. Baumann S, Toft U, Aadahl M, Jorgensen T, Pisinger C. The long-term effect of a population-based life-style intervention on smoking and alcohol consumption. The Inter99 study-a randomized controlled trial. Addiction. 2015;110(11):1853–60.
23. Wareham NJ, Jakes RW, Rennie KL, Schuit J, Mitchell J, Hennings S, et al. Validity and repeatability of a simple index derived from the short physical
activity questionnaire used in the European prospective investigation into cancer and nutrition (EPIC) study. Public Health Nutr. 2003;6(4):407–13. 24. Heid IM, Jackson AU, Randall JC, Winkler TW, Qi L, Steinthorsdottir V, et al.
Meta-analysis identifies 13 new loci associated with waist-hip ratio and reveals sexual dimorphism in the genetic basis of fat distribution. Nat Genet. 2010;42(11):949–60.
25. Benzinou M, Creemers JW, Choquet H, Lobbens S, Dina C, Durand E, et al. Common nonsynonymous variants in PCSK1 confer risk of obesity. Nat Genet. 2008;40(8):943–5.
26. Cotsapas C, Speliotes EK, Hatoum IJ, Greenawalt DM, Dobrin R, Lum PY, et al. Common body mass index-associated variants confer risk of extreme obesity. Hum Mol Genet. 2009;18(18):3502–7.
27. Heard-Costa NL, Zillikens MC, Monda KL, Johansson A, Harris TB, Fu M, et al. NRXN3 is a novel locus for waist circumference: a genome-wide association study from the CHARGE consortium. PLoS Genet. 2009;5(6):e1000539.
28. Lindgren CM, Heid IM, Randall JC, Lamina C, Steinthorsdottir V, Qi L, et al. Genome-wide association scan meta-analysis identifies three loci influencing adiposity and fat distribution. PLoS Genet. 2009;5(6):e1000508.
29. Liu YJ, Liu XG, Wang L, Dina C, Yan H, Liu JF, et al. Genome-wide association scans identified CTNNBL1 as a novel gene for obesity. Hum Mol Genet. 2008;17(12):1803–13.
30. Loos RJ, Lindgren CM, Li S, Wheeler E, Zhao JH, Prokopenko I, et al. Common variants near MC4R are associated with fat mass, weight and risk of obesity. Nat Genet. 2008;40(6):768–75.
31. Meyre D, Delplanque J, Chevre JC, Lecoeur C, Lobbens S, Gallina S, et al. Genome-wide association study for early-onset and morbid adult obesity identifies three new risk loci in European populations. Nat Genet. 2009;41(2):157–9.
32. Scuteri A, Sanna S, Chen WM, Uda M, Albai G, Strait J, et al. Genome-wide association scan shows genetic variants in the FTO gene are associated with obesity-related traits. PLoS Genet. 2007;3(7):e115.
33. Thorleifsson G, Walters GB, Gudbjartsson DF, Steinthorsdottir V, Sulem P, Helgadottir A, et al. Genome-wide association yields new sequence variants at seven loci that associate with measures of obesity. Nat Genet. 2009;41(1):18–24.
34. Willer CJ, Speliotes EK, Loos RJ, Li S, Lindgren CM, Heid IM, et al. Six new loci associated with body mass index highlight a neuronal influence on body weight regulation. Nat Genet. 2009;41(1):25–34.
35. Frayling TM, Timpson NJ, Weedon MN, Zeggini E, Freathy RM, Lindgren CM, et al. A common variant in the FTO gene is associated with body mass index and predisposes to childhood and adult obesity. Science. 2007;316(5826):889–94.
36. Speliotes EK, Willer CJ, Berndt SI, Monda KL, Thorleifsson G, Jackson AU, et al. Association analyses of 249,796 individuals reveal 18 new loci associated with body mass index. Nat Genet. 2010;42(11):937–48.
37. Sandholt CH, Allin KH, Toft U, Borglykke A, Ribel-Madsen R, Sparso T, et al. The effect of GWAS identified BMI loci on changes in body weight among middle-aged Danes during a five-year period. Obesity (Silver Spring). 2014; 22(3):901–8.
38. Larsen SC, Angquist L, Ahluwalia TS, Skaaby T, Roswall N, Tjonneland A, et al. Interaction between genetic predisposition to obesity and dietary calcium in relation to subsequent change in body weight and waist circumference. Am J Clin Nutr. 2014;99(4):957–65.
39. Glymour MM, Weuve J, Berkman LF, Kawachi I, Robins JM. When is baseline adjustment useful in analyses of change? An example with education and cognitive change. Am J Epidemiol. 2005;162(3):267–78.
40. Randall JC, Winkler TW, Kutalik Z, Berndt SI, Jackson AU, Monda KL, et al. Sex-stratified genome-wide association studies including 270,000 individuals show sexual dimorphism in genetic loci for anthropometric traits. PLoS Genet. 2013;9(6):e1003500.
41. Locke AE, Kahali B, Berndt SI, Justice AE, Pers TH, Day FR, et al. Genetic studies of body mass index yield new insights for obesity biology. Nature. 2015;518(7538):197–206.
42. Shungin D, Winkler TW, Croteau-Chonka DC, Ferreira T, Locke AE, Magi R, et al. New genetic loci link adipose and insulin biology to body fat distribution. Nature. 2015;518(7538):187–96.