R E S E A R C H
Open Access
Designing an integrated socio-technical
behaviour change system for energy saving
Ksenia Koroleva
1*, Mark Melenhorst
1,5, Jasminko Novak
1,2, Sergio Luis Herrera Gonzalez
3, Piero Fraternali
3and Andrea E. Rizzoli
4FromThe 8th DACH+ Conference on Energy Informatics Salzburg, Austria. 26–27 September 2019
*Correspondence:
1European Institute for Participatory Media, Pariser Platz 6, 10117 Berlin, Germany
Full list of author information is available at the end of the article
Abstract
Stimulating households to save energy with behaviour change support systems is a challenge and an opportunity to support efforts towards more sustainable energy consumption. The approaches developed so far, often either; do not consider the underlying behaviour change process in a systematic way, or do not provide a
systematic linking of design elements to findings from behaviour change literature and the design of persuasive systems. This paper discusses the design and evaluation of a holistic socio-technical behaviour change system for energy saving that combines insights from behavioural theories and the persuasive system design in a systematic way. The findings from these two streams of research are combined into an integrated socio-technical model for informing the design of a behaviour change system for energy saving, which is then implemented in a concrete system design. The developed system combines smart meter data with interactive visualisations of energy
consumption and energy saving impact, gamified incentive mechanisms, energy saving recommendations and attention triggers. The system design distinguishes between a version with non-personalized energy saving tips and a version with personalized recommendations that are deployed and evaluated separately. In this paper, we present the design and evaluation results of the non-personalized system in a real-world pilot. Obtained results indicate reduced energy consumption compared to a control group and a positive change in energy knowledge in the treatment group using the system, as well as positive user feedback about the suitability of the designed system to encourage energy saving.
Keywords: Behaviour change, Energy saving, Visualization, Gamification
Introduction
Meeting the European targets for a reduction of CO2 emissions by 2030 (40% compared to 1990) and energy savings (27% compared to “business-as-usual”) (2030 Energy Strat-egy2014) requires extensive changes in consumption behaviour of European citizens. Previous studies on the effect of behaviour change interventions on energy consumption report energy savings of 4%-12% on average (Nachreiner et al.2015), but also point out a number of limitations and issues related to the persistence of behaviour change over time. Overall, the current body of knowledge on determinants and processes of behaviour change for environmentally conscious behaviour (Steg and Vlek2009) and research from
the design of persuasive systems (Oinas-Kukkonen2013), provide good groundwork for designing systems to support behaviour change. However, thecombinedconsideration of these findings in the development of technological solutions for stimulating energy sav-ing has been rather limited and few approaches have systematically based their design on a theoretically-grounded model. In particular, none of the existing approaches and stud-ies have been able tovalidate in a real world pilota theoretically grounded design of a holistic behaviour change system for energy saving or provide specific recommendations for the design of such systems for various types of users.
While many approaches explore the use of consumption feedback or the use of game-like motivational elements, recent research both in energy and related fields (e.g. water saving) suggest that such individual elements alone are not suitable for inducing a durable change in behaviour (see (Nachreiner et al. 2015; Novak et al. 2018) for an overview). Recently, several European projects have started systematically investigating models where different types of elements are combined in an integrated behaviour change system (Tisov et al. 2018), although few results regarding their theoretical approach and empirically validated findings are currently published. In our view, energy con-sumption should be considered beyond an individual decision framework, as a complex socio-technical process that takes into account social norms, technologies and infras-tructures. The demand for energy is therefore indirect, created by services such as comfort, which are in turn provided by devices and infrastructures (Shove 2003a, b), and is “systematically configured” over the long term (Van Vliet et al.2012). When it comes to energy savings we propose that effective and sustainable behaviour change can-not be achieved by a single intervention impacting a specific attitudinal or behavioural variable, but requires a holistic socio-technical approach that uses a combination of individual enablers, mechanisms and techniques, and aligns technological enablers with suitable models of behaviour change. While such integrated socio-technical systems for behaviour change in energy saving are available in theory, they have not been validated in real-world pilots.
In this paper, we propose a theoretically-grounded design of a holistic socio-technical system supporting behaviour change for energy saving, which combines smart meter data with interactive consumption visualizations, gamified incentives, energy saving recom-mendations and attention triggers. We present the theoretical background, derive the socio-technical integrated behaviour change model for energy saving and then describe the design and technical implementation of the model in a concrete system that provides different types of incentives (virtual, physical) and is adaptive to the various types of user motivations. Finally, we discuss the results of its evaluation in a real-world pilot includ-ing impact on energy consumption, analysis of user activity and evaluation with the end users.
Behavioural change systems for household energy saving
factors determining individual household energy consumption behaviour, most fre-quently subdivided into socio-economic variables, psychological factors and external contextual and situational factors (see Frederiks et al. (2015) for a review). Although some factors have been found to be better predictors of energy savings than others, these find-ings are not consistent across time, context, and sample type of participants and studies (Frederiks et al.2015). Additionally, very few studies have found the interventions to be effective or achieve substantial behavioural changes, mainly due to the fact that they have not appropriately tested causal relationships (Frederiks et al.2015).
Another research stream deals with the actual design of behaviour change support systems that can aid in inducing users to change behaviour, drawing on generic design frameworks (Fogg 2009; Oinas-Kukkonen 2013). These systems have emerged in dif-ferent domains (for a review, see Hamari et al. (2014)), including various kinds of pro-environmental behaviour, such as energy saving (Shih and Jheng2017). Most authors agree that effective designs of behaviour change systems in the energy domain should incorporate different types of feedback and analysis options (e.g. allowing users to access historical series of consumption data or provide them with social comparisons). Feedback as a consequential intervention tool helps individuals associate their actions with outcomes (Fischer 2008) and shapes behaviour by breaking consumption habits (Abrahamse et al. 2005). Such feedback can be data-oriented (e.g. bar or pie charts (Monigatti et al. 2010)), connected to the real consumption context (e.g. floor plans (Monigatti et al. 2010)), metaphorical (Monigatti et al.2010), playful and ambient (Be aware project 2008; Wemyss et al. 2016), or connected to nature or animal habitats (eco-visualization (Gustafsson et al.2009a,b). Energy consumption feedback holds the promise of reducing energy consumption by 4%-12% on average, with peak savings going beyond 20% (Nachreiner et al.2015; Tiefenbeck et al.2019). However, feedback is regarded as a double-edged sword: some authors find that behaviour change is likely to be reversed once feedback is no longer provided (Allcott and Rogers2014). Others found that feedback should be coupled with motivational techniques and energy saving advice (Nachreiner et al.2015).
To be effective, incentives must consider different consumer types and needs, be pre-sented at the right moment and provide actionable suggestions tailored to a given user and context (Novak et al.2018). A new direction is the use of personalized recommen-dations employing machine learning techniques to identify different consumer classes, create user models and map appropriate actionable suggestions in a personalized manner (Novak et al.2018). While the combination of consumption visualization and feedback with recommendations is promising, little evidence is available regarding the most effec-tive combinations of feedback, or how these behavioural changes can be sustained over time.
2017) have also been explored. However, in most of these approaches, actual impact on energy use was not measured or unreported.
The majority of the described research has focused on influencing behavioural deter-minants (e.g. attitudes, behavioural intentions) to stimulate energy saving without con-sidering the stages of behaviour change and how intervention strategies must be tailored to accommodate individuals as they fluctuate between these stages (van der Werff and Steg2015). But there is growing awareness that interventions and incentives need to be provided based on an individual’s stage in the behaviour change process (He et al.2010). While early attempts have been made to adopt this approach to feedback systems for natural resource consumption (He et al.2010; Geelen et al.2013; Novak et al.2018), its systematic implementation into a real-world system and related empirical evaluation has yet to be done. The approach and model that we propose in the next section is an attempt to design a holistic behaviour change model for energy saving that integrates the insights from the trans-theoretical model of behaviour change (Prochaska and Velicer1997), its adaptation to pro-environmental behaviour by (Bamberg2013) and water saving (Novak et al.2018), and the mapping of various incentive mechanisms (such as feedback and recommendations) to appropriate stages of the behaviour change process.
Socio-technical behaviour change model for energy saving
The underlying assumption of behaviour change systems (Oinas-Kukkonen 2013) is that behaviour change can be initiated by stimulating psychological factors that influ-ence specific behaviours (Hamari et al. 2014). Accordingly, a change in energy con-sumption behaviour can be stimulated through a combination of specific incentive and persuasion strategies that address underlying psychological determinants. However, impacting the attitudes and the intention to change behaviour may not lead to actual change in behaviour (intention-behaviour gap). Individuals also have to develop skills and strategies needed to implement new behaviors (Bamberg 2013). Thus, behavioural change can be seen as a transition through a time-ordered sequence of several stages, such as in the trans-theoretical model of behaviour change (Prochaska and Velicer 1997) or the model of action phases (Heckhausen and Gollwitzer 1987). The trans-theoretical model of behaviour change, originally from the health domain, explains behaviour change through five consecutive phases spanning from raising awareness (’pre-contemplation’) to creating new habits. Each of the stages follows distinct goals, and as a result, requires different motivational drivers. The trans-theoretical model has been applied to water saving (Novak et al.2018) and a similar model of action phases, the MAP model, has been applied to studying environmentally harmful behaviours (Bamberg2013).
goals that need to be achieved in each stage, it does not specify in detail the social, cog-nitive, and affective factors and processes that impact the formation of attitudes and intentions in each of the stages (Bamberg2013). But the knowledge about these factors is critical for developing the incentive mechanisms to impact the formation of attitudes and intentions in each stage. Therefore, building on Novak et al. (2018) we first specify what motivates an individual in each stage to invest cognitive effort into thinking about the behaviour and potentially changing it by using theories from environmental and cog-nitive psychology. We then use the input from the design of persuasive systems research to identify which incentives need to be provided to the users to increase their motivation to save energy in each stage. The resulting behaviour change model for energy saving is given in Table1.
Integrated incentive model for household energy saving
Based on the presented socio-technical behaviour change model, we develop more detailed incentive elements for designing a concrete behaviour change system for stim-ulating household energy saving that addresses all stages of the behaviour change process. The designed elements include interactive energy consumption visualizations, energy saving tips, goal setting and gamified incentives (virtual, social, tangible) and are implemented in a concrete system.
Interactive feedback visualizations with goal-setting for energy saving
Multiple studies show that feedback has the potential of influencing underlying beliefs regarding energy consumption and attitudes towards energy saving (Steg et al. 2014; Tiefenbeck et al. 2016; Novak et al.2018) at different stages of the behaviour change process. But the design of effective feedback visualizations for energy saving is not trivial. Energy consumption behaviour is abstract, non-sensory and of low personal rel-evance to most individuals (Karlin et al.2015). The abstract units of W and kWH are difficult for household consumers to understand (Karjalainen 2011). Consumers have different environmental goals and values (Lindenberg and Steg2007), as well as differ-ent needs regarding energy consumption feedback (Gölz and Hahnel2016), at different stages of the behaviour change process (Bamberg 2013). To address these challenges, an adaptive metaphor-based visualization approach can be used, helping users interpret complex numerical, and abstract information (Monigatti et al.2010; Froehlich et al.2009; Hackenfort et al.2018).
To set and monitor the achievement of an energy saving goal for a current month, a
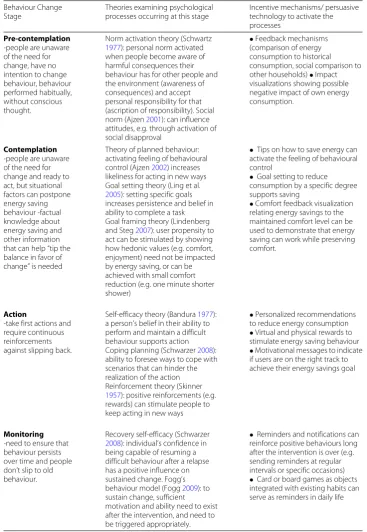
Table 1Socio-technical behaviour change process model for energy saving Behaviour Change
Stage
Theories examining psychological processes occurring at this stage
Incentive mechanisms/ persuasive technology to activate the processes
Pre-contemplation -people are unaware of the need for change, have no intention to change behaviour, behaviour performed habitually, without conscious thought.
Norm activation theory (Schwartz 1977): personal norm activated when people become aware of harmful consequences their behaviour has for other people and the environment (awareness of consequences) and accept personal responsibility for that (ascription of responsibility). Social norm (Ajzen2001): can influence attitudes, e.g. through activation of social disapproval
•Feedback mechanisms (comparison of energy consumption to historical consumption, social comparison to other households)•Impact visualizations showing possible negative impact of own energy consumption.
Contemplation -people are unaware of the need for change and ready to act, but situational factors can postpone energy saving behaviour -factual knowledge about energy saving and other information that can help “tip the balance in favor of change” is needed
Theory of planned behaviour: activating feeling of behavioural control (Ajzen2002) increases likeliness for acting in new ways Goal setting theory (Ling et al. 2005): setting specific goals increases persistence and belief in ability to complete a task Goal framing theory (Lindenberg and Steg2007): user propensity to act can be stimulated by showing how hedonic values (e.g. comfort, enjoyment) need not be impacted by energy saving, or can be achieved with small comfort reduction (e.g. one minute shorter shower)
•Tips on how to save energy can activate the feeling of behavioural control
•Goal setting to reduce consumption by a specific degree supports saving
•Comfort feedback visualization relating energy savings to the maintained comfort level can be used to demonstrate that energy saving can work while preserving comfort.
Action
-take first actions and require continuous reinforcements against slipping back.
Self-efficacy theory (Bandura1977): a person’s belief in their ability to perform and maintain a difficult behaviour supports action Coping planning (Schwarzer2008): ability to foresee ways to cope with scenarios that can hinder the realization of the action Reinforcement theory (Skinner 1957): positive reinforcements (e.g. rewards) can stimulate people to keep acting in new ways
•Personalized recommendations to reduce energy consumption •Virtual and physical rewards to stimulate energy saving behaviour •Motivational messages to indicate if users are on the right track to achieve their energy savings goal
Monitoring -need to ensure that behaviour persists over time and people don’t slip to old behaviour.
Recovery self-efficacy (Schwarzer 2008): individual’s confidence in being capable of resuming a difficult behaviour after a relapse has a positive influence on sustained change. Fogg’s behaviour model (Fogg2009): to sustain change, sufficient motivation and ability need to exist after the intervention, and need to be triggered appropriately.
•Reminders and notifications can reinforce positive behaviours long after the intervention is over (e.g. sending reminders at regular intervals or specific occasions) •Card or board games as objects integrated with existing habits can serve as reminders in daily life
and users in the contemplation phase, to stimulate action through goal-setting and monitoring.
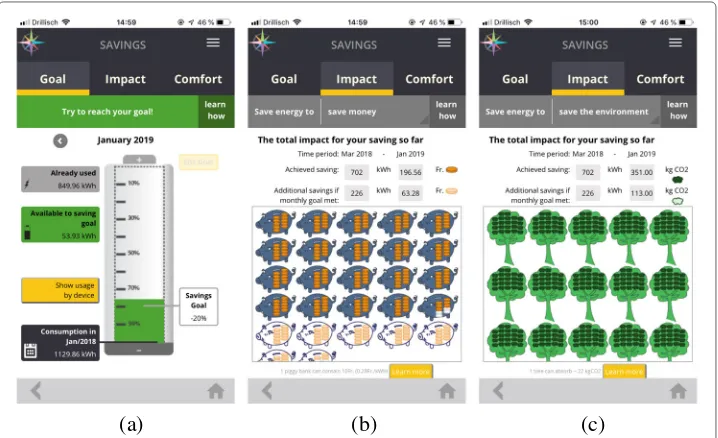
(a)
(b)
(c)
Fig. 1 Metaphorical feedback visualizations.abattery metaphor to set and monitor an energy saving goal.b monetary impact visualization.cenvironmental impact visualization
(CO2emissions) and hedonic value. The monetary impact metaphor (Fig.1b) is depicted as a piggy bank, the environmental impact metaphor (Fig.1c) is represented by trees cor-responding to saved CO2emissions, and the hedonic value metaphor displays jars filled with balls and badges which are earned after a user saves energy (user’s gamified achieve-ments). As users have different goals for using energy feedback systems (Gölz and Hahnel 2016), they may be more motivated by a specific impact view. Therefore, the impact view is personalized based on people’s main motivation for saving energy (solicited from a questionnaire). However, according to Goal Framing theory, individuals may have several competing motivations, therefore users are able switch between these three different visu-alizations. These visual metaphors are intended to target users in the pre-contemplation stage to illustrate the impact of energy saving, as well as users in the action stage to create a sense of achievement that motivates users to continue saving energy.
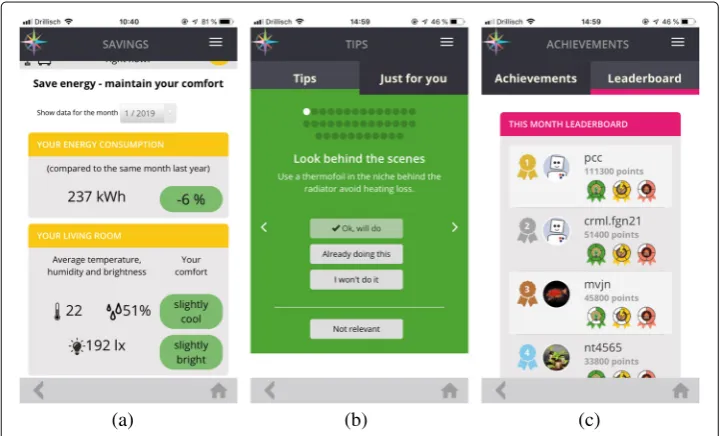
(a) (b) (c)
Fig. 2Feedback visualizations and gamification.acomfort vs. energy savings visualization.benergy saving tips.cleaderboard element
comfort level alongside energy savings can induce the users in the contemplation phase towards energy savings (cf. Table1). Finally, the detailed consumption view provides data-affine users (Micheel et al. 2015) with a bar chart consumption visualization, allowing users to check their energy consumption at different time scales (e.g. weekly, monthly) and compare it against their historical average.
Energy saving tips and recommendations
Educating users on how to perform the desired behaviour is a well-known behavioural change strategy (Oinas-Kukkonen2013; Michie et al.2011). Providing concrete action-able suggestions strengthens the sense of responsibility (Schwartz 1977), promotes self-efficacy and the perception of behavioural control (Ajzen1985), and can also directly strengthen the intention to implement the desired behaviour (Bamberg2013). Offering recommendations for energy saving actions allows users to learn how to save energy (Gölz and Hahnel2016). Our system design foresees two types of recommendations (see Fig.2b): a list of generic energy savings tips and personalized recommendations (derived from energy behaviour data, user-generated data, and sensors). In each case, users are asked to commit to execute the recommended action (’Ok, will do’), state that they are already doing it, or indicate that it is irrelevant to them. Please note that the system design presented and evaluated in this paper considers only the non-personalized version.
Gamified incentives and rewards
with playful interaction can motivate user engagement beyond external rewards. In our approach, users are motivated to perform recommended actions via two types of gamified rewards: symbolic (points, badges) and tangible (external prizes). These are reinforced by game-mechanics such as goal setting (meeting personal savings goals are rewarded with bonus points), competition (vouchers are awarded monthly to the best performing households) and social comparison (e.g. collecting points for performing energy saving actions improves a user’s leaderboard rank). An example of the leaderboard is displayed in Fig.2c. These features are intended to support user engagement in the action phase and reduce the risk of relapse by stimulating the need for competition and/or the need to demonstrate one’s achievements to others (Reiss2014).
Notifications and attention triggering
Given the generally low involvement of users with energy consumption (Karlin et al. 2015), and the competition with other applications, there is a risk that users lose interest over time (Hargreaves et al.2013). Therefore, push notifications are sent to users’ smart-phones comprising tips for energy saving, warnings when they are close to missing their energy savings goal, announcing gamified achievements (e.g. earning a new badge), and reactivation messages when activity becomes low. Such notifications are especially helpful in the monitoring stage to re-activate users’ attention (e.g. after relapse to old behaviour). Repeatedly triggering user’s attention to an energy saving application is a difficult chal-lenge, since a balance must be struck between keeping users engaged without irritating them. Consequently, users can limit the number of notifications per week by choosing a low (maximum of 2 per week) or high frequency setting (maximum of 5 per week), or completely disable them.The timing and type of notifications to be sent to the user in this non-personalized system is determined in a fixed manner based on input obtained from user requirements workshops (without considering different user types, actual user presence at home, or their current activity).
System implementation
The technical implementation of the system is based on a layered architecture, in which each layer is designed to address a specific task. The system architecture comprises three layers: the data layer, the business process layer, and the consumer layer. The data layer is responsible for the data acquisition, pre-process and storage of the smart meters and indoor climate sensor readings; it also exposes services for the upper-level layer to access the consolidated data. The business process layer is responsible for the execu-tion of the business logic; it exposes business services for the Consumer layer. In the non-personalized system version it comprises:
• The Gamification Engine: a configurable gamification rule engine, designed to provide services to the Consumer layer, specifically to the end-user mobile
application through a service API. The exposed services allow the user application to record user activity on the platform and assign points for completed tasks, assess energy saving goals, track user achievements, manage rewards, and notify users about relevant platform events.
• Notification Engine: a component that provides notification services to other Platform components. It schedules notifications pushed by other components and delivers them based on user-defined preferences; it exploits the Google Firebase Cloud Messaging service, for the delivery of mobile alerts.
• Service Integration and Orchestration Component : this component synchronizes the execution of the processes that the different components require, and provides services for the communication between components.
Finally, the consumer layer comprises the client-side application for publishing the services exposed by the Business Process Layer, and the mobile App for displaying the consumption and sensor data and for integrating the gamification services.
The end-user application is divided into two components: a web application with responsive web design, which handles the communication with the business layer and the rendering of the visualizations, as well as client applications for mobile devices (Android and iOS), which wraps the web application and enables access to the native features of the devices. The responsive web application was developed following a Model-Driven Engi-neering approach: models representing the organization of the interface, its content and the user interaction events were specified using the OMG Interaction Flow Modeling language (IFML) and WebRatio (WebRatio2019), a model-driven development environ-ment based on IFML, which automatically transforms these models into executable code using industry standard frameworks, such as Struts, JSP, CSS and jQuery. The client wrap-per applications are developed using the native tools for each mobile platform, Java for Android and Swift for iOS; they consist mainly of a WebView, i.e., a simple web browser whose behaviour can be customized, that enables access to the end-user web applica-tion, enriched with native functions such as notifications, safe storage of user data and passwords etc.
Evaluation in a real-world pilot Research Methodology
The system was designed with a user-centered design process, starting from eliciting the requirements of the users in a series of workshops, developing mock-ups, testing them in online crowd tests, as well as prototyping before final system development. To assess the proposed model and system design we evaluated behaviour change for a set of residential households in a real-world pilot in Switzerland1. To this end, we applied an experimental
design with a treatment and a control group. The treatment group used the developed sys-tem, whereas the control group wasn’t exposed to this intervention. People signed up on a self-interested basis to the control and the treatment groups. We then assessed changes in energy consumption between the treatment and the control group and the interaction of the treatment group with the system. Additionally, a survey-based approach has been applied to capture behaviour and awareness change due to the intervention. Specifically, we measure changes in attitudinal and behavioural measurements before and after expo-sure to the system. This includes changes in behaviour, knowledge and attitudes, as well as the user evaluation of the usefulness and motivational effect of the system.
1Here we report findings from evaluation of the non-personalized system in the Swiss pilot. TheenCOMPASSproject
Energy savings as a result of system usage
Sample characteristics
The experiment in this pilot has been organized by selecting a treatment group and a control group. The treatment group has been composed of 66 self-selected households from the district of Contone in the municipality of Gambarogno located in the Ticino Canton (southern Switzerland). A focused control group has been composed of 34 house-holds in the districts of Gerra, Magadino, Piazzogna, Quartino and Vira, all of them in the same municipality of Gambarogno. The members of this focused control group agreed to take part in a series of questionnaires during the whole project. For the purpose of the consumption evaluation, we also have access to consumption data of a much larger con-trol group of users (558 households) located in the same district, who are neither taking part in the project nor answering the questionnaires. This larger group is used only for a statistical assessment of the energy saving results.
The structure of the treatment group comprises 50% families with kids, 31% couples, and 9% reporting themselves as single. The control group comprises 28% families, 47% couples, and 25% reporting as single. The treatment group lives in apartments (21%), ter-raced houses (18%) and single homes (62%), while the control group distribution is as follows: 6% live in apartments, 35% live in terraced houses, and 59% live in single homes. The average monthly consumption for the treatment group over the baseline period spanning May 2017 until April 2018 was 574.5 kWh per month. The average monthly con-sumption for the focused control group in the same period was 625.6 kWh per month, and 450 kWh per month for the larger control group.
Results on energy saving
The results in this section cover the treatment period for the non-personalized system spanning June 2018 until February 2019. Therefore, we compare the consumption of the treatment period (June 2018 – February 2019) against the same sub-period during the baseline period (June 2017 – February 2018). The following formula is used to compute the consumption percentage change:
savings=
N
i=1 xbase
i −xi xbasei
N (1)
Where N is the total number of users, xi is the consumption of the ith user during the treatment period so far, while xibaseis the consumption of the same user during the baseline period.
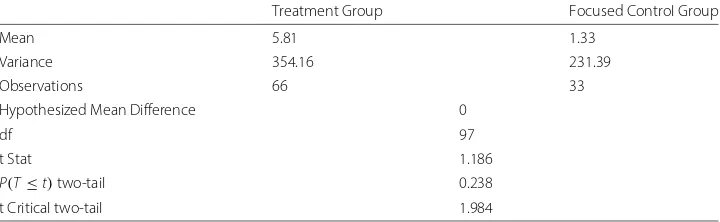
We find that for the treatment group, the average consumption has decreased on aver-age by 5.81% (standard deviation 18.81%). The same analysis for the focused control group shows that the average consumption has increased by 1.33% (standard deviation 15.22%) after removing an outlier that increased the consumption by 168%. The percentage vari-ation in consumption of the treatment group users can be seen in Fig.3. Apart from two users who, respectively greatly increased and greatly decreased their consumption (users 86 and 87), the other users in general managed to reduce their consumption (positive increments mean savings).
Fig. 3Percentage variation in consumption of treatment group users
reported in Table2. We thus accept the hypothesis that the average savings in the focused control group and in the treatment group are similar.
Given the limited size of the focused control group, we also compared the average per-centage savings of the treatment group against the average perper-centage savings of the larger control group from the Contone population. In this case, the variances of the two samples do not pass the F-test, therefore we employ a Welch t-Test to compare the average sav-ings in the two samples. The average percentage savsav-ings in the larger control group are equal to 0.2% with a variance equal to 6.4%, which confirms the stability of the consump-tion of this group of households as expected, given that no major exogenous factors have affected the energy consumption in Contone over the study period. The results presented in Table3show that we can reject the hypothesis that average savings between the larger control group in Contone and the treatment group are similar.
We have then analyzed possible relationships between the usage of the system (user activity in the app) and the obtained energy savings. For this, we have gathered the aver-age number of actions performed in the app per week. Actions can be diverse types of interactions within the app, such as checking current energy consumption, review-ing a tip, updatreview-ing the monthly goal and so on. Figure4shows the average number of weekly actions on the y-axis with consumption variation on the x-axis. We have then per-formed a K-means clustering on the data, setting the number of clusters to 4. The result is depicted in Fig.4, where a group of users (coloured green) who display a rather intense
Table 2Two sample t-Test between treatment and focused control group
Treatment Group Focused Control Group
Mean 5.81 1.33
Variance 354.16 231.39
Observations 66 33
Hypothesized Mean Difference 0
df 97
t Stat 1.186
P(T≤t)two-tail 0.238
Table 3Welch t-Test between treatment and larger control group
Treatment Group Larger Control Group
Mean 5.81 0.20
Variance 354.16 6.40
Observations 66 558
Hypothesized Mean Difference 0
df 65
t Stat 2.419
P(T≤t)two-tail 0.018
t Critical two-tail 1.99
weekly activity on the app can be noticed. These users do not necessarily show higher savings compared to other clusters, but their savings are consistently positive, which is not the case for the other clusters (e.g. the larger purple cluster has a positive energy sav-ing on average, but contains a subset of members who actually increased their energy consumption).
Evaluation of system usage
In the treatment group, 66 users downloaded and registered to the mobile app during the first two months of the pilot. Among these users, 52 logged in more than once and were therefore considered to be active users. This subgroup’s application usage data was the subject of further analysis. Figure5shows the frequency of new sign-ups per month, the number of active users each month (those who logged in more than once over the course of the pilot) and the number of users who logged in each month. From Fig.5we see that a majority of active users (in a range of 54%-100% depending on the month) are logging in to the application at least once every month. This is a healthy level of user engagement.
To estimate how frequently the users interacted with the main visualizations and pages of the application, we calculated the monthly average frequency of interaction per user
Fig. 5Usage statistics: user growth and engagement by month
per month of pilot membership2. The results are shown in Fig.6. The results show that the users interacted the most with the Savings and Goal page which they accessed on average over 14 times a month. The second most frequently used page was the Comfort page, with an average of 10.7 accesses per month. Similarly, the Tips page (10 accesses per month)3and Achievements page (9.6 monthly accesses), were also frequently used. The Consumption page with the detailed time-based overview of the consumption and the Leaderboard were used less frequently, though still more than once a week on average. In contrast, the Impact and Comfort Feedback pages were accessed less, about once a week on average (3.9 monthly accesses).
To shed more light on the interaction with the three types of impact visualizations, we analyze how many users accessed the default impact visualizations in the application (determined from their stated motivation to save energy) and how many of them changed the default impact visualization to another metaphor. Among the users who indicated their preference to save energy, 88% were motivated by environmental considerations and 6% each by monetary or hedonic goals. Results show that most users accessed the impact visualization reflecting their stated preference at least once; for example, 95% of users who cited the environment as their preferred motivation for saving energy accessed the environmental visualization. Among users who had the environmental visualization set as the default, 50% changed to the monetary and 55% changed to the hedonic visualization at least once.
Evaluation of the change in antecedents of behaviour change and user acceptance
Measurement instruments and sample
In order to assess differences in the antecedents of behaviour change, we measured three constructs with validated measurement instruments, adapted to the context of energy saving. This was done using 3 items measuring intention to save energy (7pt Likert) in line with Ajzen (2002), 4 items measuring perceived behavioural control (7pt Likert) in line
2The frequency was computed by dividing for each user the total frequency by the number of days between sign-up and
the 28.2.19, multiplied by the average number of days in the months in the pilot.
Fig. 6 Average monthly app interactions per user and app page
with Thøgersen & Grønhøj (2010), and 5 items measuring environmental knowledge (5pt Likert), with an adapted scale from Kaiser and Frick (2002)4. These items were measured both for the treatment and the control group, with the main hypothesis that due to the intervention with the developed system, these behavioural determinants would improve in the treatment group more than in the control group.
To evaluate user acceptance of the system, we used the items from the UTAUT model (Venkatesh et al.2012). Specifically, we used 2 items measuring performance expectancy, 4 items measuring effort expectancy, 3 items measuring hedonic motivation, and 3 items measuring behavioural intention, all on a 5pt Likert scale (see Table5). We also measured the motivation of users by the system in general and by specific elements (such as the battery, and the environmental and monetary impact views) in particular (these items were self-developed).
For the analysis of the changes in behavioural variables, we can only include users who filled out both the baseline questionnaire (given at the beginning of the pilot), and the assessment questionnaire after the pilot had been active for 4 months. Therefore, the results presented below come from 40 users in the treatment group, of whom 66% are male and 34% are female; 25% are between 31-40 years of age; 28% between 41-50, 25% between 51-60, 15% between 61-70, and 5% are over 70. In the control group, there are 26 users, of whom 72% are male and 28% are female, 18% are between 31-40 years old, 23% between 41-50%, 23% between 51-60, 14% between 61-70 and 23% are over 70.
Results of impact on antecedents of behaviour change
We measured three antecedents of behaviour change: energy knowledge, perceived behavioural control and behavioural intention. For behavioural control and behavioural intention, we computed averages for the items mentioned in the previous section, whereas for the energy knowledge we computed the sum, as the construct is formative. These constructs were measured at the beginning of the trial and after four months5in order
4The limit in the number of constructs measured is due to the need to cover different evaluation aspects and a limit in
the number of questions that users would be willing to answer
5The evaluation of the presented non-personalized system was performed as planned after four months of usage. Due to
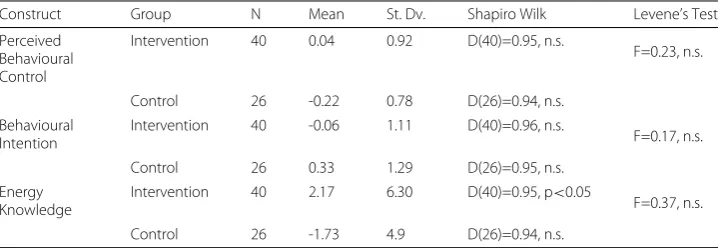
to assess any change resulting from the intervention. In Table4we show the means and standard deviations of the change in the behavioural determinants computed by subtract-ing the score after four months of trial from the score measured prior to the beginnsubtract-ing of the trial. In this table the Shapiro-Wilk test, used for small sample used for small sam-ple sizes (Shapiro and Wilk1965) reveals that all of the scores are normally distributed, except for the scores of energy knowledge in the intervention group.
Scores measuring energy knowledge, show a change from 14.2 to 16.8 in the treatment, and from 18.30 to 16.81 in the control group. The scores provided by participants in the treatment group have increased, whereas the scores of the control group have decreased. As the scores of the treatment group are non-normally distributed, a Mann-Whitney test shows that people in the treatment group (Mdn=1) managed to increase their knowledge compared to the control group (Mdn=-0.5); U=735, p<0.01, r=0.35, which is considered a medium size effect (Cohen1992).
As evident from Table4, other behavioural determinants measured were not substan-tial; the independent samples t-test revealed that there are no significant differences in the mean changes in perceived behavioural control between the treatment and the control group (t (64)=1.18, n.s.) as well as no differences in behavioural intention (t (64)= -1.33, n.s).
Results regarding user acceptance and motivation
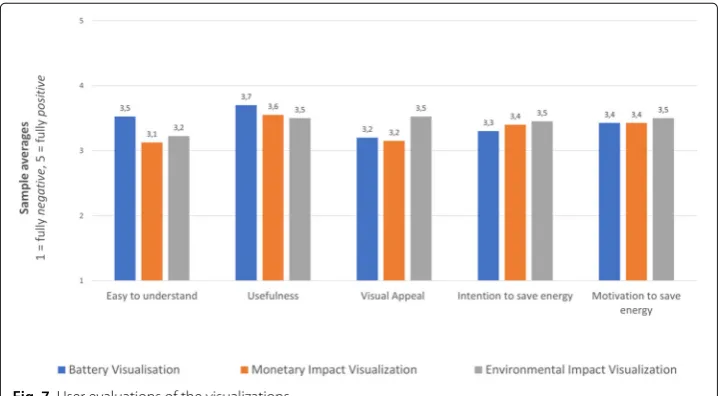
The results in Table5 reveal that the application shows above average user acceptance for all measured constructs of UTAUT model: the application was considered moderately useful in daily life (average performance expectancy score of 3.6/5) and easy to use (aver-age effort expectancy score of 3.75/5). Users also reported that the application is fairly fun to use (average score of 3.4/5 for hedonic quality) and that they intend to use it in the future (average score of 3.7/5). The average scores of user responses for the evaluation of the developed visualizations are presented in Fig.7. They show that users evaluated positively all aspects of the developed visualizations.
Discussion and conclusions
We have presented a socio-technical model and system for behaviour change for energy saving and evaluated it in a real-world pilot. The results suggest that the designed behav-ior change system is suitable to stimulate energy savings among consumers. The observed positive effects on energy consumption of the treatment compared to the larger control
Table 4Means, deviations and statistical test results for the change in attitudes, intention and knowledge due to the intervention
Construct Group N Mean St. Dv. Shapiro Wilk Levene’s Test
Perceived Behavioural Control
Intervention 40 0.04 0.92 D(40)=0.95, n.s.
F=0.23, n.s.
Control 26 -0.22 0.78 D(26)=0.94, n.s.
Behavioural Intention
Intervention 40 -0.06 1.11 D(40)=0.96, n.s.
F=0.17, n.s.
Control 26 0.33 1.29 D(26)=0.95, n.s.
Energy Knowledge
Intervention 40 2.17 6.30 D(40)=0.95, p<0.05
F=0.37, n.s.
Table 5Descriptive statistics of the main measurement constructs evaluating user acceptance of theenCOMPASSapp (all measured on a scale from 1 to 5)
Construct Items Mean St. Dv.
Performance Expectancy
I find theenCOMPASSapp useful in my daily life. 3.63 0.88 Using the enCOMPASS app increases my chances of achieving
things that are important to me.
3.65 1.06
Effort Expectancy
Learning how to use theenCOMPASSapp is easy for me. 3.80 1.00 My interaction with theenCOMPASSapp is clear and
understand-able.
3.65 0.92
I find theenCOMPASSapp easy to use. 3.89 0.92
It is easy for me to become skillful at using theenCOMPASSapp. 3.65 1.08
Hedonic Using theenCOMPASSapp is fun. 3.37 1.06
Quality Using theenCOMPASSapp is enjoyable 3.61 1.00
Using theenCOMPASSapp is very entertaining. 3.30 1.05
Intention to Use
I intend to continue using theenCOMPASSapp. 3.89 1.06
I will always try to use theenCOMPASSapp in my daily life. 3.57 1.03 I plan to continue to use theenCOMPASSapp frequently. 3.63 0.97
group and a change in user’s energy related knowledge suggest that such systems can be successfully applied to motivate users to save energy. Our results show that users who used the application frequently, achieved positive energy savings, compared to users who used the application less regularly. Moreover, the positive user evaluation of the system, the high motivation of users by the developed visualizations to save energy, and the actual active usage of the application suggest that the integrated incentive model motivated users to adopt the proposed system to start changing their behaviour. These results provide both theoretical and practical contributions.
On the theoretical side, we find that the underlying socio-technical model can be applied to study behavior change in the energy saving domain. Research suggests energy knowledge is one of the first antecedents of behaviour change towards energy saving and our results show energy knowledge improving in the treatment group after users participated for four months in the pilot. Proceeding behavioural determinants such as perceived behavioural control or behavioural intention, have yet to show significant
change. This suggests that four months is not enough time for the behavioural deter-minants to change and a post-hoc analysis must be performed to assess whether these determinants show any change in the long-term.
Additionally, our results suggest that the developed interactive visualizations are well suited to motivate users to save energy. Specifically, the battery visualization allowing the user to set and monitor the achievement of the energy saving goal was reported by the users as easiest to understand and most useful. The environmental impact visualization had the most visual appeal and was perceived as the most motivating metaphorical visual-ization for saving energy. While most users were interested in the visualvisual-izations matching their primary motivation, some were also interested in the visualizations matching the other motivational drivers. This confirms that users might have different motivations for energy saving, as suggested by the goal framing theory (Lindenberg and Steg2007).
Additionally, during the four month trial users were increasingly using the application, motivated by the incentive mechanisms proposed in our model. Specifically, users have been most frequently accessing such pages of the application as: the savings and goal, the comfort, the tips, and achievements (ordered by frequency). The interest in the savings and goal page is justified as this page allows users to monitor their consumption with respect to the energy saving goal - the main aim of the application. The lower frequency of access for Impact visualization pages is surprising, although one needs to consider that accessing these pages also requires more clicks since they follow after the higher-level visualization pages.
On the practical side, the developed incentive model can guide the designers of behaviour change systems in energy use and other sustainable domains to design their systems in such a way that they are easy to use, helpful and engaging for the users. For example, we show that the energy consumption and savings visualizations help users save energy, by e.g. allowing them to set and monitor their energy saving goals. Additionally, providing users with energy saving tips and competition-based achievements can help keep users engaged in the behaviour change process. An overall recommendation for designers is to use different incentive mechanisms (those for different behavior change stages or various motivation types) that can potentially motivate various types of users.
Acknowledgements
We thank SES Società Elettrica Sopracenerina for the support in the implementation of the Swiss pilot, NABU for contributing to the collection of energy saving tips and setMobile Srl for the technical system integration.
Limitations
Limited duration of the trial of 4 months bears the risk that after the intervention the users may relapse. Verifying if such short period is sufficient to change behaviour in the long-term is the subject of a follow-up study. Overall, quite small sample sizes in the intervention and control group impact the significance of behaviour change determinants. Self-selection bias of participants to participate in the trial might have impacted the results. To show causality, a longitudinal study is necessary.
About this supplement
This article has been published as part ofEnergy InformaticsVolume 2 Supplement 1, 2019: Proceedings of the 8th DACH+ Conference on Energy Informatics. The full contents of the supplement are available online at?https:// energyinformatics.springeropen.com/articles/supplements/volume-2-supplement-1.
Authors’ contributions
All authors contributed to the publication and have read and approved the final manuscript.
Funding
Availability of data and materials
The supplementary materials are available upon request.
Competing interests
The authors declare that they have no competing interests.
Author details
1European Institute for Participatory Media, Pariser Platz 6, 10117 Berlin, Germany.2University of Applied Sciences
Stralsund, IACS-Institute for Applied Computer Science, Zur Schwedenschanze 15, 18435 Stralsund, Germany.
3Dipartimento di Elettronica, Informazione e Bioingegneria, Politecnico di Milano, Piazza Leonardo da Vinci, 32, 20133
Milano, Italy.4IDSIA USI-SUPSI, Galleria 2, 6928 Manno, Switzerland.5Saxion University of Applied Sciences, M.H. Tromplaan 28, 7513 AB Enschede, Netherlands.
References
2030 Energy Strategy (2014).https://ec.europa.eu/energy/en/topics/energy-strategy/2030-energy-strategy. Accessed 25 Feb 2017
Abrahamse W, Steg L, Vlek C, Rothengatter T (2005) A review of intervention studies aimed at household energy conservation. J Environ Psychol 25(3):273–291
Ajzen I (1985) From intentions to actions: A theory of planned behavior. In: Action Control. Springer, Berlin, Heidelberg, Heidelberg. pp 11–39
Ajzen I (2001) Nature and operation of attitudes. Annu Rev Psychol 52(1):27–58
Ajzen I (2002) Perceived behavioral control, self-efficacy, locus of control, and the theory of planned behavior 1. J Appl Soc Psychol 32(4):665–683
Allcott H, Rogers T (2014) The short-run and long-run effects of behavioral interventions: Experimental evidence from energy conservation. Am Econ Rev 104(10):3003–37
Bamberg S (2013) Changing environmentally harmful behaviors: A stage model of self-regulated behavioral change. J Environ Psychol 34:151–159
Bandura A (1977) Self-efficacy: toward a unifying theory of behavioral change. Psychol Rev 84(2):191 Be aware project (2008) Boosting energy awareness with adaptive real-time enviornments.http://www.
energyawareness.eu/. Accessed 25 Feb 2017 Cohen J (1992) A power primer. Psychol Bull 112(1):155
Fischer C (2008) Feedback on household electricity consumption: a tool for saving energy? Energy Efficiency 1(1):79–104 Fogg B (2009) A behavior model for persuasive design,[w:] 4th international conference on persuasive technology ’09.
ACM, New York
Frederiks E, Stenner K, Hobman E (2015) The socio-demographic and psychological predictors of residential energy consumption: A comprehensive review. Energies 8(1):573–609
Froehlich J, Dillahunt T, Klasnja P, Mankoff J, Consolvo S, Harrison B, Landay JA (2009) Ubigreen: investigating a mobile tool for tracking and supporting green transportation habits. In: Proceedings of the Sigchi Conference on Human Factors in Computing Systems. ACM, New York. pp 1043–1052
Geelen D, Reinders A, Keyson D (2013) Empowering the end-user in smart grids: Recommendations for the design of products and services. Energy Policy 61:151–161
Gölz S, Hahnel UJ (2016) What motivates people to use energy feedback systems? a multiple goal approach to predict long-term usage behaviour in daily life. Energy Res Soc Sci 21:155–166
Gustafsson A, Bång M, Svahn M (2009a) Power explorer: a casual game style for encouraging long term behavior change among teenagers. In: Proceedings of the International Conference on Advances in Computer Enterntainment Technology. ACM, New York. pp 182–189
Gustafsson A, Katzeff C, Bang M (2009b) Evaluation of a pervasive game for domestic energy engagement among teenagers. Comput Entertain (CIE) 7(4):54
Hackenfort M, Carabias-Hütter V, Hartmann C, Janser M, Schwarz N, Stücheli-Herlach P (2018) Behave 2018: Book of abstracts. In: BEHAVE 2018-5th European Conference on Behaviour and Energy Efficiency, Zurich, 5-7 September 2018. ZHAW Zürcher Hochschule für Angewandte Wissenschaften, Winterthur
Hamari J, Koivisto J, Pakkanen T (2014) Do persuasive technologies persuade?-a review of empirical studies. In: Spagnolli A. (ed). PERSUASIVE 2014, LNCS 8462. Springer International Publishing, Switzerland 2014. pp 118–136
Hargreaves T, Nye M, Burgess J (2013) Keeping energy visible? exploring how householders interact with feedback from smart energy monitors in the longer term. Energy Policy 52:126–134
He HA, Greenberg S, Huang EM (2010) One size does not fit all: applying the transtheoretical model to energy feedback technology design. In: Proceedings of the SIGCHI Conference on Human Factors in Computing Systems. ACM, New York. pp 927–936
Heckhausen H, Gollwitzer PM (1987) Thought contents and cognitive functioning in motivational versus volitional states of mind. Motiv Emot 11(2):101–120
Johnson D, Horton E, Mulcahy R, Foth M (2017) Gamification and serious games within the domain of domestic energy consumption: A systematic review. Renew Sust Energ Rev 73:249–264
Karjalainen S (2011) Consumer preferences for feedback on household electricity consumption. Energy Build 43(2-3):458–467
Karlin B, Zinger JF, Ford R (2015) The effects of feedback on energy conservation: A meta-analysis. Psychol Bull 141(6):1205 Lindenberg S, Steg L (2007) Normative, gain and hedonic goal frames guiding environmental behavior. J Soc Issues
63(1):117–137
Micheel I, Novak J, Fraternali P, Baroffio G, Castelletti AF, Rizzoli A (2015) Visualizing and gamifying water & energy consumption for behavior change. In: Fostering Smart Energy Applications Workshop (FSEA) 2015 at Interact 2015. University of Bamberg Press, Bamberg. pp 1–4
Michie S, Van Stralen MM, West R (2011) The behaviour change wheel: a new method for characterising and designing behaviour change interventions. Implement Sci 6(1):42
Monigatti P, Apperley M, Rogers B (2010) Power and energy visualization for the micro-management of household electricity consumption. In: Proceedings of the International Conference on Advanced Visual Interfaces. ACM, New York. pp 325–328
Nachreiner M, Mack B, Matthies E, Tampe-Mai K (2015) An analysis of smart metering information systems: a psychological model of self-regulated behavioural change. Energy Res Soc Sci 9:85–97
Novak J, Melenhorst M, Micheel I, Pasini C, Fraternali P, Rizzoli AE (2018) Integrating behavioural change and gamified incentive modelling for stimulating water saving. Environ Model Softw 102:120–137
Oinas-Kukkonen H (2013) A foundation for the study of behavior change support systems. Pers Ubiquit Comput 17(6):1223–1235
Prochaska JO, Velicer WF (1997) The transtheoretical model of health behavior change. Am J Health Promot 12(1):38–48 Reiss J (2014) Energy retrofitting of school buildings to achieve plus energy and 3-litre building standards. Energy
Procedia 48:1503–1511
Richter G, Raban DR, Rafaeli S (2015) Studying gamification: the effect of rewards and incentives on motivation. In: Gamification in Education and Business. Springer International Publishing. pp 21–46
Schiavon S, Altomonte S (2014) Influence of factors unrelated to environmental quality on occupant satisfaction in leed and non-leed certified buildings. Build Environ 77:148–159
Schwartz SH (1977) Normative influences on altruism. In: Advances in Experimental Social Psychology, vol 10. Academic Press Inc. Published by Elsevier Inc. pp 221–279
Schwarzer R (2008) Modeling health behavior change: How to predict and modify the adoption and maintenance of health behaviors. Appl Psychol 57(1):1–29
Shapiro SS, Wilk MB (1965) An analysis of variance test for normality (complete samples). Biometrika 52(3/4):591–611 Shih L-H, Jheng Y-C (2017) Selecting persuasive strategies and game design elements for encouraging energy saving
behavior. Sustainability 9(7):1281
Shove E (2003) Comfort, Cleanliness and Convenience: The Social Organization of Normality, Berg. Lancaster University, UK, Bailrigg
Shove E (2003) Users, technologies and expectations of comfort, cleanliness and convenience. Innov Eur J Soc Sci Res 16(2):193–206
Skinner BF (1957) Verbal Behavior. Appleton-Century-Crofts, New York
Steg L, Bolderdijk JW, Keizer K, Perlaviciute G (2014) An integrated framework for encouraging pro-environmental behaviour: The role of values, situational factors and goals. J Environ Psychol 38:104–115
Steg L, Perlaviciute G, Van der Werff E, Lurvink J (2014) The significance of hedonic values for environmentally relevant attitudes, preferences, and actions. Environ Behav 46(2):163–192
Steg L, Vlek C (2009) Encouraging pro-environmental behaviour: An integrative review and research agenda. J Environ Psychol 29(3):309–317
Tiefenbeck V, et al. (2019) Real-time feedback promotes energy conservation in the absence of volunteer selection bias and monetary incentives. Nat Energy 4.1:35
Tiefenbeck V, Goette L, Degen K, Tasic V, Fleisch E, Lalive R, Staake T (2016) Overcoming salience bias: how real-time feedback fosters resource conservation. Manag Sci 64(3):1458–1476
Tisov A, Podjed D, D’Oca S, Vetršek J, Willems E, Veld PO (2018) People-centred approach for ict tools supporting energy efficient and healthy behaviour in buildings. Multidiscip Digit Publ Inst Proc 1:675
van der Werff E, Steg L (2015) One model to predict them all: predicting energy behaviours with the norm activation model. Energy Res Soc Sci 6:8–14
Van Vliet B, Shove E, Chappells H (2012) Infrastructures of Consumption: Environmental Innovation in the Utility Industries. Earthscan
Venkatesh V, Thong JY, Xu X (2012) Consumer acceptance and use of information technology: extending the unified theory of acceptance and use of technology. MIS Q 36(1):157–178
WebRatio (2019) Leading the Digital Transformation.https://www.webratio.com/site/content/en/home. Accessed 25 Apr 2019
Wemyss D, Castri R, De Luca V, Cellina F, Frick V, Lobsiger-Kägi E, Bianchi PG, Hertach C, Kuehn T, Carabias V (2016) Keeping up with the joneses: examining community-level collaborative and competitive game mechanics to enhance household electricity-saving behaviour. In: Proceedings of the 4th European Conference on Behaviour and Energy Efficiency Behave 2016. University of Coimbra, Portugal, Coimbra
Publisher’s Note