R E S E A R C H
Open Access
Supply chain uncertainty and
environmental management
Stephan Vachon
1*and Sara Hajmohammad
2* Correspondence:
svachon@ivey.ca
1Western University, Ivey Business
School, London, Canada Full list of author information is available at the end of the article
Abstract
This manuscript examines the impact of supply chain uncertainty on environmental management spending in manufacturing plants. Building on the attention-based view of the firm (ABV), the basic premise is that with increased uncertainty in the supply chain, managers’attention to environmental management lessens which in turn leads to (i) fewer resources devoted to green issues within the plant and (ii) a bias to use resources toward less disruptive pollution control approaches rather than pollution prevention approaches. Data from a survey of 251 Canadian manufacturing plants was used to test the link between the level of uncertainty in the supply chain and environmental management decisions. The results indicate that supply chain uncertainty does not have a substantial impact on the level of environmental spending in a plant but has a substantial and significant impact on the allocation of the spending between pollution prevention and pollution control. More particularly, as supply chain uncertainty increases, organizations shift their resources away from pollution prevention to favor pollution control approaches.
Keywords:Supply chain management, Environmental management
Introduction
One of the fundamental questions related to corporate environmental management remains “does it pay to be green?”(Ambec and Lanoie, 2008). While the results in the literature mainly support the premise that it does pay to be green (Albertini, 2013), the literature also suggests that the business and industrial contexts (Lucas and Noordewier, 2016) as well as the type of environmental initiatives (Vachon and Klassen, 2008; Klassen and Whybark, 1999) matter in driving organizational performance.
For instance, significant value can be created by adopting pollution prevention technologies and practices rather than pollution control (King and Lenox, 2002; Lee and Vachon, 2016). Pollution prevention usually take the form fundamental changes to a product or a process that eliminate pollution at the source. Several waste reduction and energy efficiency programs aligned with that kind reduction at the source mindset. In contrast, pollution control involves proper management of pollution after it is generated. End-of-pipe technologies and remediation projects are often associated with pollution control. Interestingly, the most recent Canadian data on environmental expenditures indicate that manufacturers spent more in pollution control in a ratio of 2.2:1 when compared to pollution prevention (Statistics Canada, 2015). Why is that
the case? Is there an operating context more conducive to adopt preventive approaches as opposed to control approaches?
Building on the attention-based view of the firm (ABV) (Ocasio, 1997), this paper proposes that supply chain uncertainty (Vilko et al., 2014; van der Vorst and Beulens, 2002) is an important factor in (i) allocating organizations’resources to environmental management, and (ii) the type of environmental initiatives adopted (i.e., prevention vs. control). Because environmental management can be perceived as a non-core or ‘peripheral’activity (Vachon and Klassen, 2006), higher level of supply chain uncertainty increases the likelihood that limited managerial attention will be diverted away from environmental management and more towards core activities. Put another way, with less predictability in the supply chain, managers’ attention span is less likely to fully cover green issues within their operations, hence, spending less time and resources on environmental management. Furthermore, a less predictable supply chain is more complex to manage, which results in favoring environmental technologies and methods that are less disruptive such as end-of-pipe technologies or abatement systems.
By developing the linkage between supply chain uncertainty and environmental management, this paper provides a better understanding of the contextual elements that can be driving environmental management decisions. By gaining a better appreci-ation of supply chain uncertainty as a contextual variable, this paper contributes theoretically and conceptually to the literature. The empirical development and subse-quent analysis also can have managerial implications as supply chain uncertainty can be mitigated by addressing variability at the source (e.g., six sigma projects) or by building buffers—hence affecting environmental management decisions.
This paper first provides a definition of supply chain uncertainty in Supply Chain Uncertainty section. This definition is then linked to environmental management in Linking Supply Chain Uncertainty to Environmental Management section where two hypotheses are proposed using ABV. Methodology section describes the research methodology and the variables measurement used for the empirical analysis presented in Empirical Analysis sec-tion. The empirical results are discussed in Discussion and Concluding Remarks section where the paper’s limitations and future research avenues are also discussed.
Supply Chain Uncertainty
The linkage of uncertainty to supply chain management is not new in the literature (Mason-Jones and Towill, 1998; Davis, 1993) and the concept of supply chain uncertainty has been widely defined and operationalized throughout the years (Vilko et al., 2014). Several studies in the operations management and green supply chain literature have developed models incorporating business or demand uncertainty as a key contextual variable (Kocabasoglu et al., 2007; Ketokivi and Jokinen, 2006). For example, demand uncertainty was found to attenuate the positive effect of supply chain integration on delivery performance (Boon-itt and Wong, 2010). Lo (2013) uncovered a relationship between demand uncertainty, the firm’s position in the supply chain, and the environmen-tal practices. Business uncertainty taking the form of industry munificence was also found to be contributing to an increase of the risk propensity to invest in reverse supply chain activities (Kocabasoglu et al., 2007).
chain risk (Sodhi and Tang, 2012). Conceptualizing uncertainty as the‘dynamic’ dimen-sion of supply chain complexity, Bozarth et al. (2009) found a negatively and significant link between uncertainty and manufacturing performance.
In this paper, uncertainty is defined as the degree of unreliability (Davis, 1993) and unpredictability (Ketokivi and Jokinen, 2006) associated with different activ-ities along the supply chain. Supply chain uncertainty then becomes the unreli-ability and unpredictunreli-ability pertaining to suppliers’ activities, internal operations, and customers’ requirements. For example, upstream uncertainty captures issues related to suppliers’ poor delivery reliability (Holweg et al., 2011) or defective rates of incoming lots (Gray et al., 2011). The equipment reliability (or lack of ) and the extent of production scheduling changes are elements of internal uncer-tainty (Vachon and Klassen, 2002). The customer’s order changes and demand variability (e.g., quantity demanded) are associated with downstream uncertainty (Tokar et al. 2014; Bozarth et al. 2009).
Linking Supply Chain Uncertainty to Environmental Management
Building on the ABV (Ocasio, 1997), this section establishes the link between supply chain uncertainty and two aspects of environmental management: (i) the extent of the resources spent on environmental improvement (size of the environmental spending ‘pie’) and (ii) the allocation of environmental spending between pollution control and pollution preven-tion (how the environmental spending ‘pie’is shared). One of the main characteristics of supply chain uncertainty is the additional managerial pressure it imposes to achieve oper-ational objectives. Among other things, it can be argued that it diverts limited managerial and organizational attention away from environmental issues. The ABV becomes an inter-esting theoretical lens in that particular context.
The ABV suggests that managerial attention allocated to different issues is determined by three principles (Ocasio, 2011). First, the managers have limited cogni-tive capacity to give all of the managerial issues the adequate level of attention. Often referred to as bounded rationality (Simon, 1991), this principle leads to manager’s selective attention. The notion of bounded rationality in the environmental manage-ment literature starts to make inroads particularly in studies pertaining to the intersec-tion of environmental policy and‘corporate’response (Reise et al., 2012; Gazheli et al., 2015)―its direct application to environmental decisions within business organizations remains, however, quite sparse (Pinske and Gasbarro, 2016).
The ABV has recently been used as a theoretical lens in the business sustainability literature—for example, the ABV was leveraged to explain corporate social responsibil-ity and performance (Zhao et al., 2016), climate change adaptation (Pinske and Gasbarro, 2016; Galbreath, 2011), and green information system practices adoption (Hedman and Henningsson, 2016). Pinske and Gasbarro (2016) study on the oil and gas industry indicates that different attention channels (selective, situated, and struc-tural) lead to different climate change adaptation strategies.
Environmental spending is defined here as all of the resources that can be directed toward environmental improvement projects. The resources can be money, time, or people—the notion of time and people is directly and positively linked to the attention available to address environmental issues. The basic premise of this paper is that as supply chain uncertainty increases the managerial attention devoted to peripheral or noncore activities is reduced. In other words, bounded rationality compound by an operating context plagued by supply chain uncertainty limits the managers’attention to adequately attend to green issues. With an increasing level of supply chain uncertainty more organizational resources including managerial attention are channeled to core supply chain activities. For instance, several organizations facing uncertainty would build flexibility in the supply chain taking the form of buffer inventory, a larger supply base, or excess capacity (Sawhney, 2006) all of which requires more resources to implement or manage—by the same token less resources are available for environmen-tal management.
H1: As supply chain uncertainty increases, the resources allocated to environmental management decreases.
The environmental management literature has emphasized the difference between eliminating pollution at the source and abating the pollution after it is created (Klassen and Whybark, 1999; Vachon, 2007). Building on the operations strategy (structural vs. infrastructural elements), Klassen and Whybark (1999) introduced a classification of environmental technologies into three mutually exclusive groups. First, pollution prevention is defined as structural changes aiming to reduce pollution at the source. Structural changes are physical and ‘tangible’changes made to products and/or process. The second group of technologies is pollution control which includes the structural changes that assure a proper treatment of the pollution after it is created. End-of-pipe technologies are a good example of pollution control. Finally, all other investments that are infrastructural by definition such as training, audits, documentation, or procedures constitute the third group named management systems. The nature of management systems can be either for preventive activities (e.g., procedures to reduce energy consumption) or control purposes (e.g., audit, training regarding response to a spill). Hence, the focus here is on the contrast between pollution prevention and pollution control as structural-related spending.
(March, 1991). In essence, supply chain uncertainty fosters the adoption of an exploitation approach to operations rather than an exploration approach. Pollution prevention with technical changes to products and/or significant equipment modifications affects the core of organization activities, and as such, it is more aligned with an exploration approach. In other words, supply chain uncertainty is not conducive for pollution prevention. In contrast, pollution control devices allow to address an environmental issue without tampering with the existing technical systems (product or process)—facing high level of supply chain uncertainty, a manager would lean on keeping the existing technologies and the related capabilities intact, privilege the exploitation of the existing operational competences, and opt for less disruptive pollution control technologies.
H2: As supply chain uncertainty increases, the allocation of resources to
environmental management is shifted from pollution prevention to pollution control.
Methodology
A survey of Canadian manufacturing plants was conducted in spring of 2011. A sample of 1001 Canadian plants, located in the provinces of Quebec and Ontario, with more than 100 employees was randomly selected from the Canadian Scott’s Directory.1The Canadian Scott’s Directory is a systematic and comprehensive dataset of Canadian manufacturing plant’s executives contact information with data that are verified continuously to assure accuracy. The target respondent was the plant manager and a total of 251 responses were collected from which a total of 215 to 237 were usable for the different models tested. The effective response rate was 21.5%.
More specifically, the industries selected included those from the North American Industrial Classification Systems (NAICS) codes 315 to 337, mainly including discrete goods industries excluding process-based sectors such as paper, petroleum, and chemical products which are heavily controlled by command-and-control regulations. Also, the discrete good industries have more opportunities to perform product modifications than commodity-based industries leading to wider possibilities in terms of pollution prevention technologies.
Several nonresponse bias tests were conducted (Armstrong & Overton, 1977; Lambert & Harrington, 1990) and revealed no indication of such a bias. To minimize key-informant bias, we contacted each plant by phone prior to sending the survey to identify the manager most knowledgeable about the environmental management at the plant (Kumar et al., 1993).
Measurements
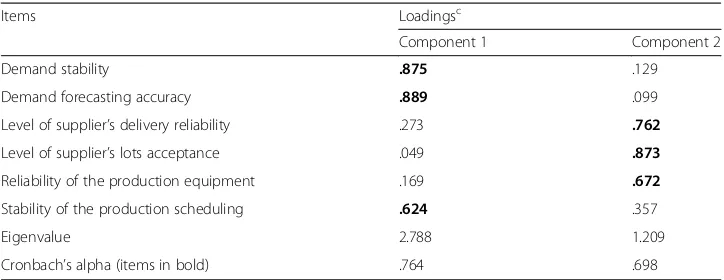
capture uncertainty in the supply chain (Vachon and Klassen, 2002). The different items were reverse coded to reflect supply chain uncertainty. Two items reflected the level of uncertainty from the supply base by determining the level of lots acceptance and the delivery reliability. The internal production system uncertainty was measured through the level of equipment reliability and the stability of the production schedule. Finally, two items aimed at capturing the uncertainty from the demand.
An exploratory factor analysis was performed on these six items leading to a solution with two dimensions: (i) demand uncertainty (Cronbach’s alpha = 0.764) and (ii) supply uncertainty (Cronbach’s alpha = 0.698) (Table 1). The factor analysis indicated that the items considered as internal systems uncertainty were split between demand and supply uncertainty. The item pertaining to scheduling changes (arguably triggered by demand fluctuations) loaded on the demand uncer-tainty dimension. The item reflecting equipment reliability together with the two supply base related items can be viewed as uncertainty associated with the task of supplying goods to customers, hence, the label supply uncertainty.
A four-item scale was used to capture the degree of environmental practices im-plemented in a plant. This scale is a proxy for the level of resources for environ-mental management that are spent in a plant. These items asked the respondents to express the degree of resources invested in different environmental initiatives such as pollution prevention, recycling of materials, life cycle analysis, and waste reduction. This set of items was also used in previous studies linking lean manage-ment to environmanage-mental managemanage-ment (Hajmohammad et al., 2013). The factor analysis indicated that the four items were loading on the same component (Table 2) with a Cronbach’s alpha of 0.794.
A second variable capturing the level of resources devoted to environment man-agement in a plant was the proportion of the capital budget that was allocated to the environmental projects. The respondents were asked to indicate the percentage of the capital budget by selecting one of the seven choices ranging from less than 1 to 12%—the answers were coded on a scale from 1 to 7, accordingly.
The selection of different environmental technologies by plant managers (i.e., pollution prevention, pollution control, and management systems) was measured by a ‘forced’allocation question in the survey. The respondents were asked to allocate 100 Table 1Factor Analysis: Supply Chain Uncertaintya,b
Items Loadingsc
Component 1 Component 2
Demand stability .875 .129
Demand forecasting accuracy .889 .099
Level of supplier’s delivery reliability .273 .762
Level of supplier’s lots acceptance .049 .873
Reliability of the production equipment .169 .672
Stability of the production scheduling .624 .357
Eigenvalue 2.788 1.209
Cronbach’s alpha (items in bold) .764 .698
a
The leading question was:“Rate the following plant’s characteristic against the industry average”. The items were reverse coded to capture uncertainty
b
Exploratory factor analysis using principle components with varimax rotation c
points to five different types of environmental expenditures: two were associated with pollution prevention, two were related to pollution control, and the fifth type was about management systems (see Appendix 1 and Vachon, 2007).
Plant and company size measured by taking the natural logarithmic transform-ation of the number of employees were both introduced as control variables: this is consistent with recent research in environmental management that has included organizational size in the analysis (Hofer et al., 2012). The respondents were from the two largest provinces in Canada (Ontario and Quebec) with different regulatory context: a dummy was introduced (“province”) in the analysis to capture such a difference. Finally, because a certified environmental management system such as ISO 14001 could have an impact on both the level and the type of environmental spending (Oliveira et al., 2016), a dummy variable was also introduce to capture plant’s certification.
Empirical Analysis
Bivariate correlations are presented in Table 3. There is a significant correlation between the environmental practices scale and the percentage of the capital budget devoted to environmental projects. This correlation suggests that somehow these two variables are representing a similar concept. The two scales measuring supply chain Table 2Factor Analysis: Environmental Practicesa,b
Items Loadings
Pollution prevention .788
Recycling of materials .800
Life cycle analysis .717
Waste reduction .842
Eigenvalue 2.483
Cronbach’s alpha .794
a
The leading question was:“Over the last 2 years, to what extent has your plant invested resources (money, time, and/or people) in programs in the following areas?”
b
Exploratory factor analysis using principle components with varimax rotation
Table 3Correlationsa,b
Mean s.d. 1 2 3 4 5 6 7 8 9 10
1. Environmental practices 4.0 1.3
2. % of capital budget 2.3 1.5 .339*
3. Pollution prevention 51.5 28.5 −.016 .120
4. Pollution control 26.1 24.0 −.063 .147† −.596*
5. Management systems 22.4 24.0 .082 −.005 −.593* −.293*
6. Demand uncertainty 2.8 1.1 −.181* .041 −.083 .186* −.086
7. Supply uncertainty 2.4 0.8 −.092 .011 −.149† .157† .020 .420*
8. ISO 14001 certification 0.2 0.4 .196* .204* −.321* −.040 .438* −.081 −.101
9. Plant size 4.8 1.0 .155† .103 −.145 −.008 .181* −.166* −.075 .314*
10. Company size 6.0 1.8 .018 .102 −.231* .003 .277* −.051 −.007 .380* .536*
11. Province 0.7 0.4 −.142† −.198* .157† −.016 −.132† .173* .105 −.174* −.039 −.101
a
Pearson correlation except for“ISO 14001 certification”and“Province”for which a Spearman correlation was computed (because of the binary nature of these two variables)
b
uncertainty correlated at 42% indicating potential for collinearity if they are both introduced in the regression model. The data was analyzed using hierarchical regressions with demand and supply uncertainty entered separately in the models.
Environmental Spending
The results of the regressions pertaining to environmental spending are presented in Table 4. Weak support for hypothesis H1 was found as demand uncertainty was negatively linked to the level of environmental practices (Model 1; p-value < .05). However, supply uncertainty was not impacting the level of environmental practices (Model 1;p-value > .10). The proportion of the capital budget devoted to environmental projects was neither affected by demand uncertainty nor by supply uncertainty. Not surprising, the plants that were ISO 14001 certified had higher level of environmental practices (Model 1; p-value < .01); however, it was not linked to the proportion of capital budget related to environmental projects.
Pollution Prevention and Pollution Control
Because the level of resources devoted to environmental management can have an influence on sustainable product innovation (Severo et al., 2016) and that kind of innovation is associated with pollution prevention, three blocks of variables were used in each of the hierarchical regression model. First, the control variables were entered followed by three environmental management variables: ISO 14001 certification, percent of the capital budget devoted to environmental projects, and the proportion of infrastructural resources devoted to environmental management (i.e., management systems). Finally, either demand or supply uncertainty was entered in the model. This approach allowed to assess the additional variance explained in the dependent variable from supply chain uncertainty.
Strong support for hypothesis H2 was found (Table 5). Supply chain uncertainty was negatively linked to pollution prevention (Model 3.3, p-value < .01 and Model
Table 4Regressions: Environmental Managementa,b
Environmental practices % of capital budget to environment
Model 1.1 Model 1.2 Model 1.3 Model 2.1 Model 2.2 Model 2.3
Plant sizec .134† .118 .133† .047 .059 .049
Company sizec
−.133† −.141† −.131† .037 .041 .036
Provinced
−.083 −.058 −.081 −.170* −.188** −.172*
ISO 14001e .180* .181* .177* .086 .085 .088
Demand uncertainty −.148* .098
Supply uncertainty −.037 .031
R-square .056** .077** .057* .056* .065* .057*
F-statistics 3.433 3.835 2.805 3.337 3.116** 2.706
ΔR-square .021* .001 .009 .008
a
Standardized betas reported. Number of observations: 237 for environmental practices and 231 for capital budget b
** =p-value < .01; * =p-value < .05;†=p-value < .10 c
The company and plant size were computed by taking the natural logarithmic transformation of the number of employees
d
This is a dummy variable where 0 is Ontario and 1 is Quebec e
3.4,p-value < .01) and positively linked to pollution control (Model 4.3,p-value < .01 and Model 4.4, p-value < .01). In fact, when put together in the regression (not reported in Table 5), demand uncertainty and supply uncertainty contributed significantly to the variance explained (i.e., the change in R-square from the introduction of the two variables). The increase in the R-square when both uncertainty variables were included was 2.9% (p-value < .01) for pollution prevention and 4.1% (p-value < .01) for pollution control. Therefore, an increasing level of supply chain uncertainty is associated with a shift of environmental spending from pollution prevention to pollution control.
Discussion and Concluding Remarks
The empirical analysis provides support for the hypotheses developed in Linking Supply Chain Uncertainty to Environmental Management section. While supply chain uncertainty has a limited impact on the level of resources devoted to envir-onmental management (“the size of the pie”), it has an important role in the allo-cation of these resources (“how the pie is shared”). In particular, organizations with higher supply chain uncertainty taking the form of unreliable supplier performance (i.e., lots quality and delivery) or unpredictable demand, are likely to favor struc-tural investment that are more peripheral in nature such as remediation projects, end-of-pipe technologies, or proper discharging mechanisms. Supply chain uncer-tainty as a contextual variable might explain the observed bias for pollution control investments and expenditures found in Canadian macro data presented in the introduction.
The fact that uncertainty diverts away structural pollution prevention solutions has cer-tainly important managerial implications. The environmental literature has determined that pollution prevention is the segment of enviromemntal management (as opposed to Table 5Regressions: Pollution Prevention and Pollution Controla,b
Pollution Prevention Pollution Control
Model 3.1
Model 3.2
Model 3.3
Model 3.4
Model 4.1
Model 4.2
Model 4.3
Model 4.4
Plant sizec .022 .025 .011 .021 −.020 −.029 −.013 −.024
Company sizec −.233** −.055 −.060 −.054 .016 .066 .071 .065
Provinced .143* .037 .067 .046 −.036 −.044 −.079 −.054
ISO 14001e −.076 −.078 −.089 .091 .092 .106
% capital budget −.087 −.071 −.082 .103 .084 .097
Management systems −.541** −.543** −.527** −.346** −.345** −.364**
Demand uncertainty −.148** .176**
Supply uncertainty −.142** .169**
R-square .075** .372** .392** .173** .002 .114** .143** .142**
F- Statistics 5.678 20.502 19.084 19.032 0.112 4.467 4.942 4.905
ΔR-square .297** .021** .020** .113** .029** .028**
a
Standardized betas reported. Number of observations: 215 b
** =p-value < .01; * =p-value < .05;†=p-value < .10 c
The company and plant size were computed by taking the natural logarithmic transformation of the number of employees
d
This is a dummy variable where 0 is Ontario and 1 is Quebec e
control) that creates value for organizations (King and Lenox, 2002; Klassen and Whybark, 1999). Therefore, higher level of supply chain uncertainty has a crowding-out effect on possible green value-added solutions. If an organization wants its managers to privilege value-added environmental solutions, it needs to reduce supply chian uncer-tainty. A reduction of supply chain uncertainty not only reduces the need for resilience mechanisms (Brandon-Jones et al., 2014) such as building buffers in the sytem, but also creates a more suitable context for adopting performance enhancing environmental solu-tions. Furthermore, the results also imply that the addressing downsream uncertainty is more impactful on both the level and the allocation of resources pertaining to environ-mental management.
This paper confirms supply chain uncertainty as an important operating context variable as it further constrains managerial attention. It forces the managers to focus increasingly on the organization core operations and objectives, which gener-ally do not related to green issues. The resulting lower level of attention to envir-onmental management in the organization encourages managers to privilege less disruptive and less intrusive technologies to address environmental issues—in other words, pollution control devices. As such, the empirical analysis supports the ABV and recent related environmental management research (Pinske and Gasbarro, 2016; Kim, et al. 2016). Another theoretical contribution resides in the fact that most studies does not fully account for the business context when studying the adoption of environmental technologies. In addition, it is conceivable that even when pollution prevention is adopted that the level of attention to implement effectively the value-added technology is not adequate lessening, in turn, the technological performance. Therefore, studies examining the link between envir-onmental management efforts and organizational performance should consider controlling for supply chain uncertainty. The newly developed scale to measure such uncertainty can be used for future research and constitutes an empirical contribution to the literature.
This study comes with limitations. The first aspect of limitation is the reliance on a single-respondent in the survey—this is particularly true when perceptual scales are used in the analysis. Multiple respondents with interrater reliability assessment would be preferred. However, other recent environmental management studies have argued that if this potential bias exists, it should not be a major concern (Hajmohammad et al., 2013; Sarkis et al., 2010; Jiang, 2009). A second issue related to the study is its emphasis on discrete goods manufacturing sector. While focusing on such a targeted sector provides insightful results, it leaves aside the resource industries along with the chemical and paper industries, i.e. the most polluting industries. Considering other industries can lead to another path for future research—building on the work from Lo (2013), the relative impact of demand and supply uncertainty might shift depending on the position of the organization in the supply chain. As we move upstream in the supply chain, demand uncertainty might have a relatively lower impact than supply uncertainty.
energy can be considered as peripheral to the core operations and their adoption might not be as affected by supply chain uncertainty.
This paper started with the premise that supply chain uncertainty might explain the propensity of organizations to adopt pollution control instead of value creating technologies that reduce pollution at the source (i.e., pollution prevention). It developed hypotheses ground in the ABV and tested them with Canadian manufacturing data. The results suggest that while supply chain uncertainty does not overly impact the level of resources devoted to environmen-tal management, it does influence how these resources are allocated to different technologies.
Endnotes 1
Quebec and Ontario account for more than 60% of the Canadian population and more than 52% of the Canadian GDP. Choosing Quebec and Ontario allowed to have a sizeable poll of plants (i.e., 1001) while maximizing the researcher’s school recognition (based in Montreal)—such a geographical‘proximity’was considered to improve the re-sponse rate without introducing a sampling bias given the weight of the two provinces in the Canadian economy.
Appendix 1
Survey Question: Environmental Spending into Different Technologies
Please think about all of your plant’s projects, investments and operating costs over the last two years that have benefited the natural environment in any way. A benefit is defined as reducing any negative impact of manufacturing operations on the environment or improving the state of nature. Assign a percentage to the five project categories below based on their use of resources (e.g., capital, operating costs and people). (Total must equal 100%. For example 40 + 20 + 5 + 10 + 25).
Sources: Klassen and Whybark (1999) and Vachon (2007)
Remediation projects—(cleaning up crises and past practices) such as removing underground
storage tanks, cleaning up an environmental spills, paying environmental fines and penalties. ——— %
Pollution control technologies—(installing equipment on the end of a process, discharge stack or effluent pipe) such as water or waste treatment equipment or air emission pollutant collection.
———%
Management systems—(the way the business is managed or people work) such as new environmental training for employees to minimize spills or new environmental audit program, ISO 14001 certification.
———%
Product adaptation—(introducing a new product or modifying an existing product’s design) such as raising the use of recycled materials or using less hazardous materials in the product (e.g.,lead, mercury…).
———%
Process adaptation—(Changing the production system and the delivery process) such as covering open tanks or redesigning manufacturing equipment to reduce waste or using reusable packaging for the shipping of end products
———%
Authors’contributions
Both authors read and approved the final manuscript.
Competing interests
The authors declare that they have no competing interests.
Author details 1
Western University, Ivey Business School, London, Canada.2University of Manitoba, Asper School of Business, Winnipeg, Canada.
Received: 22 September 2016 Accepted: 2 November 2016 Published: 12 December 2016
References
Albertini E (2013) Does environemntal management improved financial performance? A meta-analysis review. Organ Environ 26(4):431–457
Ambec S, Lanoie P (2008) Does it pay to be green? A systematic overview. Acad Manag Perspect 22(4):45–62 Armstrong JS, Overton TS (1977) Estimating nonresponse bias in mail surveys. J Market Res 14(3):396–402 Boon-itt S, Wong CY (2010) The moderating effects of technological and demand uncertainties on the relationship
between supply chain integration and customer delivery performance. Int J Phys Distrib Logistical Manag 41(3): 253–276
Bozarth CC, Warsing DP, Flynn BB, Flynn EJ (2009) The impact of supply chain complexity on manufacturing plant performance. J Oper Manag 27(1):78–93
Brandon-Jones E, Squire B, Autry CW, Petersen KJ (2014) A contingent resource-based perspective of supply chain resilience and robustness. J Supply Chain Manag 50(3):55–73
Davis T (1993) Effective supply chain management. Sloan Manage Rev 34(4):35–46
Galbreath J (2011) To what extent is business responding to climate change? Evidence from a global wine producer. J Bus Ethics 104:421–432
Gazheli A, Antal M, van den Bergh J (2015) The behavirioal basis for policies fostering long-run transitions: stakeholders, limited rationality and social context. Futures 69:14–30
Gray JV, Roth AV, Leiblen MJ (2011) Quality risk in offshore manufacturing: evidence from the pharmaceutical industry. J Oper Manag 29(7/8):737–752
Hajmohammad S, Vachon S, Klassen RD, Gavronski I (2013) Lean management and supply management: their role in green practices and performance. J Clean Prod 39:312–320
Hedman J, Henningsson S (2016) Developing ecological sustainability: a green IS response model. Inf Syst J 26:259–287 Hofer C, Cantor DE, Dai J (2012) The competitive determinants of a firm’s environmental management activities:
Evidence from US manufacturing industry. J Oper Manag 30:69–84
Holweg M, Reinhart A, Hong E (2011) On risk and cost in global sourcing. Int J Prod Econ 131(1):333–341 Jiang B (2009) Implementing supplier codes of conduct in global supply chains: process explanations from theoretic
and empirical perspectives. J Bus Ethics 85(1):77–92
Ketokivi M, Jokinen M (2006) Strategy, uncertainty and the focused factory in international process manufacturing. J Oper Manag 24:250–270
Kim B, Kim E, Foss NJ (2016) Balancing absorptive capacity and inbound open innovation for sustained innovative performance: an attention-based view. Eur Manag J 34(1):80–90
King A, Lenox L (2002) Exploring the locus for profitable pollution reduction. Manag Sci 48(2):289–299 Klassen RD, Whybark DC (1999) The impact of environmental technologies on manufacturing performance. Acad
Manage J 42(6):599–615
Kocabasoglu C, Prahinski C, Klassen RD (2007) Linking forward and reverse supply chain invetsments: the role of business uncertainty. J Oper Manag 25:1141–1160
Kumar N, Stern LW, Anderson JA (1993) Conducting inter-organizational research using key informants. Acad Manage J 36(6):1633–1651
Lambert DM, Harrington TC (1990) Measuring nonresponse bias in customer service mail surveys. J Bus Logistics 11(2):5–25
Lee, K-H and Vachon, S (2016) Business Value and Sustainability: An Integrated Supply Network Perspective. Palgrave-MacMilland, London, p 310
Lucas MT, Noordewier TG (2016) Environmental management practices and firm financial performance: the moderating effect of industry pollution-related factors. Int J Prod Econ 175:24–34
Lo SM (2013) Effects of supply chain position on the motivation and practices of firms going green. Int J Oper Prod Manag 34(1):93–114
March JG (1991) Exploration and exploitation in organizational learning. Organ Sci 2(1):71–87 Mason-Jones R, Towill DR (1998) Shrinking the supply chain uncertainty circle. Control 24(7):17–22 Muller A and Whiteman G (2015) Corporate Philanthropic Reponses to Emergent Human Needs: The Role of
Organizational Attention Focus. J Bus Ethics (in press)
Ocasio W (1997) Towards an attention-based view in the firm. Strateg Manag J 18(S1):187–206 Ocasio W (2011) Attention to attention. Organ Sci 22(5):1286–1296
Oliveira JA, Oliveira OJ, Ometto AR, Ferraudo AS (2016) Environmental Management System ISO 14001 factors for promoting the adoption of cleaner production practices. J Clean Prod 133:1384–1394
Pinske J, Gasbarro F (2016) Managing Physical Impacts of Climate Change: An Attentional Perspective on Corporate Adaptation. Bus Soc. 1–36. doi:10.1177/0007650316648688
Sarkis J, Gonzalez-Torre P, Adenso-Diaz B (2010) Stakeholder pressure and the adoption of environmental practices: the mediating effect of training. J Oper Manag 28(2):163–176
Sawhney R (2006) Interplay between uncertainty and flexibility across the value-chain: towards a transformation model of manufacturing flexibility. J Oper Manag 24:476–493
Severo EA, de Guimaraes JC, and Dorion ECH (2016) Cleaner Production and Environmental Management as Sustainable Product Innovation Antecedents: A survey of Brazilian Industry. J Cleaner Prod. (in press) Simon HA (1991) Bounded rationality and organizational learning. Organ Sci 2(1):125–134
Sodhi MS, Tang CS (2012) Managing Supply Chain Risk. In: Hillier FS, Price CC (eds) International Series in Operations Research and Management Science. Springer, New York, p 172
Statistics Canada (2015) Table 1530054–Distribution of Capital Expenditures on Pollution Abatement and Control (end-of-pipe) and Pollution Prevention, by North American Industry Classification System (NAICS) and type of Environmental Medium CANSIM Database. (Accessed 20 July 2016)
Tokar T, Aloysius J, Williams B, Waller M (2014) Bracing for demand shocks: an experimental investigations. J Oper Manag 32:205–216
Thoumy M, Vachon S (2012) Environmental projects and financial performance: exploring the impact of projects’ context and characteristics. Int J Prod Econ 140(1):28–34
Vachon S (2007) Green supply chain practices and the selection environmental technologies. Int J Prod Res 45(18/19): 4357–4379
Vachon S, Klassen RD (2002) An exploratory investigation of the effects of supply chain complexity on delivery performance. IEEE Trans Eng Manag 49(3):218–230
Vachon S, Klassen RD (2006) Extending green practices across the supply chain: the impact of upstream and downstream integration. Int J Oper Prod Manag 26(7):795–821
Vachon S, Klassen RD (2008) Environmental management and manufacturing performance: the role of collaboration in the supply chain. Int J Prod Econ 111(2):299–315
Van der Vorst JGAJ, Beulens AJM (2002) Identifying sources of uncertainty to generate supply chain redesign strategies. Int J Phys Distrib Logistics Manag 32(6):409–430
Vilko J, Ritala P, Edelmann J (2014) On uncertainty in supply chain risk management. Int J Logistics Manag 25(1):3–19 Zhao X, Chen S, Xiong C (2016) Organizational attention to corporate social responsibility and corporate social
performance: the moderating effects of corporate governance. Bus Ethics 0(0):1–14
Submit your manuscript to a
journal and benefi t from:
7Convenient online submission
7Rigorous peer review
7Immediate publication on acceptance
7Open access: articles freely available online
7High visibility within the fi eld
7Retaining the copyright to your article