R E S E A R C H
Open Access
Improving approximate extraction of
functional similar regions from large-scale
spatial networks based on greedy selection of
representative nodes of different areas
Takayasu Fushimi
1*, Kazumi Saito
2,3,4, Tetsuo Ikeda
4and Kazuhiro Kazama
5*Correspondence: [email protected]
1Tokyo University of Technology, 1404-1 Katakuramachi, Hachioji city, Tokyo 192–0982, Japan
Full list of author information is available at the end of the article
Abstract
Dividing a geographical region into some subregions with common characteristics is an important research topic, and has been studied in many research fields such as urban planning and transportation planning. In this paper, by network analysis approach, we attempt to extract functionally similar regions, each of which consists of functionally similar nodes of a road network.
For this purpose, we previously proposed the Functional Cluster Extraction method, which takes a large amount of computation time to output clustering results because it treats too many high-dimensional vectors. To overcome this difficulty, we also
previously proposed a transfer learning-based clustering method that selects approximate medoids from the target network using theKmedoids of a previously clustered network and divides all the nodes intoKclusters. If we select an appropriate network with similar structural characteristics, this method produces highly accurate clustering results. However it is difficult to preliminarily know which network is appropriate. In this paper, we extend this method to ensure accuracy using theK
medoids of multiple networks rather than a specific network. Using actual urban streets, we evaluate our proposed method from the viewpoint of the improvement degree of clustering accuracy and computation time.
Keywords: Spatial network, Functional similarity, Node clustering, Greedy algorithm, Transfer learning
Introduction
From a geographical area, extracting territorial unit each of which has the homogene-ity in terms of physical aspects, cultural aspects and so forth, is an important research task in geography like urban planning and transportation planning. There exist some studies attempting to divide a given area into subregions or to find similar regions hav-ing common structural patterns by multivariate analysis approaches (Berry1964; Grigg
1965; Berry1968) and by network analysis approaches (Zhang et al.2011; Farmer and Fotheringham2011; Yin et al.2017; Chen et al.2018). Without being limited to hyperlink networks and user-related networks in SNS, various types of networks like road networks and electric power networks have been analyzed (Burckhart and Martin2012; Crucitti et al.2006; Montis et al.2007; Opsahl et al.2010; Park and Yilmaz2010; Wang et al.2012).
In a network, each node plays some sort of function for it. Examples of functions include manager and general employee in a company network and urban and suburban areas in a road network. Discovering node roles or extracting functionally similar nodes from social networks has become an important task in network analysis (Henderson et al.2011; Henderson et al.2012; Rossi et al.2012; 2013; Gilpin et al.2013; Rossi and Ahmed2015). For the similar purpose, we previously proposed the Functional Community/Cluster Extraction (FCE) method that extracts functionally similar nodes, which we call func-tional cluster, from social or web networks (Fushimi et al.2012) and from spatial networks like urban streets (Fushimi et al.2016a). The FCE method first calculates a feature vector for each node that is generally represented as a high-dimensional vector. Then it divides all the vectors intoKclusters, each of which consists of functionally similar nodes, using theK-medoids method based on a greedy algorithm.
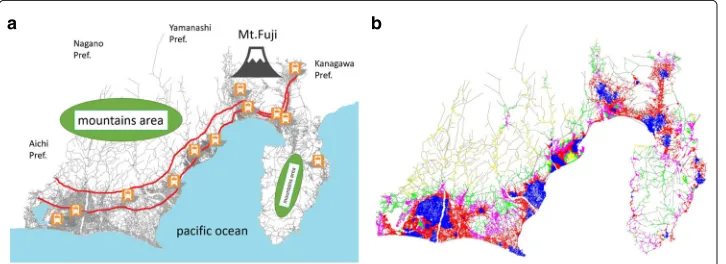
Figures1aandbrespectively indicate the main landmarks in and around the area of the Shizuoka network and the functional clusters extracted by the FCE method, where the node colors stand for the functional clusters atK=5. From these figures, the blue regions roughly correspond to the city centers of this network, the red regions approximately cor-respond to suburban areas, the green regions contain many nodes in the agricultural areas or mountain foothills, the yellow regions contain many nodes with long, winding roads, which lead to other towns over the mountainous areas, and the pink regions roughly correspond to small villages with sparse population.
However, the FCE method takes a large amount of computation time to output cluster-ing results because it treats so many high-dimensional vectors for a large-scale network. To overcome this difficulty, we proposed an accelerated version of a greedy algorithm forK-medoids clustering, which produces identical results to the original FCE method, by equipping it with some pruning techniques (Fushimi et al.2016b). For further accel-eration, by focusing on the structural similarity of urban streets and regarding them as spatial networks, we proposed a transfer learning-based method (Fushimi et al.2017c), which approximates medoid vectors using an already clustered network. We call this a source domain network (source network). By using approximates medoid vectors, the method divides all the nodes of a target network intoKclusters. If we select an appropri-ate network with similar functional and structural characteristics, this method produces highly accurate clustering results. To obtain high approximation accuracy, we must know in advance which network is suitable as a source network.
a b
Furthermore, a target spatial network naturally consists of some functional regions, each of which resembles those of other networks rather than a specific network. From our previous experiments (Fushimi et al.2016a), we learned that for all of the six cities used in our experiments, the 1st, 2nd, and 3rd functional clusters share commonly simi-lar characteristics. On the other hand, the 4th and 5th functional clusters do not, because they reflect geographical restrictions and/or the historical and the cultural backgrounds of individual cities. For example, in all the networks, the 3rd functional regions signifi-cantly contain many nodes whose degree is four, which implies that they are downtown regions with a lattice structure like Manhattan.
Therefore, in this paper, based on these observations, we extend the above transfer learning-based method (Fushimi et al.2017c) by using theKmedoids of more than one source network and useK medoids of Msource networks, where the total number of medoids isMK. For a target network that consists of Nnodes, each of whose function is represented as a high-dimensional vector, we selectMK candidates of approximate medoids fromN nodes based on the cosine similarities among the vectors of theMK
medoids and theN nodes. Then we extract theK-approximate medoids from theMK
candidates based on a greedy algorithm, which selects the nodes with the largest marginal gain of the objective function. In addition, to improve the objective function value, we introduce an update mechanism likek-means algorithm to the approximate medoids, which we call Divided Improvement (DI).
The rest of this paper is organized as follows. After explaining related work in “Related work” section, we revisit the extraction method of functional clusters in “FCE method revisit” section. Then in “Simple selection of approximate medoids from a single source network” section, we describe the transfer learning-based method and our proposed method in “Greedy selection of approximate medoids from multiple source networks” section. After explaining the network dataset in “Spatial network dataset” section, in “Evaluation of computation time” section, we evaluate its computational performance. In “Evaluation of clustering accuracy” section, we evaluate the accuracy of our pro-posed algorithm and discuss the objective function value of our propro-posed method and other comparison methods in “Evaluation of objective function value” section. Finally, we conclude in “Conclusion” section.
Related work
Studies on dividing a given geographical area into some functional regions or uniform regions have been conducted in geography. Though notion of these regions is some-what different from our functional clusters, they are similar in terms of extracting certain regions with common characteristics. To extract these regions, multivariate and network analysis methods were proposed (Berry1964; Grigg1965; Berry1968; Zhang et al.2011; Farmer and Fotheringham2011; Yin et al.2017; Chen et al.2018). As a network analysis based approach, Zhang et al. analyzed topological structure of road networks and distin-guished these structures into some patterns (Zhang et al.2011). Though the study was based on the existing TAZ (Traffic Analysis Zone) delineation, Zhang et al. mentioned that how to decide the analysis unit is an important task and it should be studied as a future work. Our FCE method extracts functionally similar regions each of which could be regarded as an unit with the similar road pattern including lattice in a city center, loops and lollipops in a residential district, and winding road in a mountainous area (Fushimi et al.2016a). Farmer and Fotheringham applied the community detection method, which is proposed by Newman (2004), to networks of travel-to-work flows, and found inter-nally well connected and relatively cohesive regions (Farmer and Fotheringham 2011). Note that their method does not consider whether distant or disconnected regions have the similar function or not, unlike our FCE method. In order to delineate urban bound-aries based on human movements, Yin et al. adopted the community detection method, Infomap (Rosvall and Bergstrom2007), to a directed weighted network, where nodes and weighted links respectively represent underlying urban regions and Twitter users’ dis-placements on them (Yin et al.2017). While the method utilizes actual human movements obtained from geo-located tweets, our FCE method focuses on artificial ones based on a random walk model on a road network considering a situation that these movements data cannot be obtained.
Research on community detection or graph clustering is another major stream of com-plex network analysis. As mentioned above, we adopt a method (Fushimi et al.2012) to extract functional clusters. This is because representative methods for extracting commu-nities as densely connected subnetworks, which include the Newman clustering method based on a modularity measure (Newman2004), cannot directly deal with such func-tional properties. The convenfunc-tional concept of a subnetwork that is connected densely, for example,k-core (Seidman1983) andk-clique (Palla et al.2005), cannot also be used for this purpose. Namely, we naturally anticipate that these representative methods have an intrinsic limitation for extracting functional similar nodes. Directly applying these con-ventional methods to a spatial network is difficult, since the maximum degree of nodes in each network is generally limited to a relatively small number, because it is unlikely that densely connected subnetworks will appear in these networks.
In this paper, we focus on the FCE method using theK-medoids clustering method that divides all the nodes into functionally similar nodes by the greedy maximization of the objective function. Typical sampling algorithms like Jiang et al. (2002) and Aggarwal et al. (2009) can cluster large datasets. Another previous work (Jiang et al.2002) focused on the fractal structure of the dataset and extracted a subset of significant size that holds the entire dataset structure. However, because the approximate centers or clus-ters are computed from stochastically chosen, relatively small objects, the accuracy of the results is not guaranteed. Since our proposed method focuses on the similar structure of road networks, we expect to obtain relatively higher accuracy than the above sampling methods.
FCE method revisit
We proposed the Functional Cluster Extraction (FCE) method that just extracts func-tionally similar node groups from the topological structure of a given network (Fushimi et al.2012). The FCE method consists of two steps: the calculation of the feature vector for each node and the clustering of these vectors. For undirected networkG = (V,E), whereVandErespectively stand for sets of nodes and undirected links, the FCE method considers the random-walk process, where the initial probability of each node is set to a uniform value.
Concretely, for each nodeu∈V, we define the probability at iteration stepsof random-walk process
ys(u)=
v∈(u)
ys−1(v)
|(v)| ,
where(u)= {v|(u,v)∈E}is the adjacent node set of nodeu. Random-walk probability
ys(u)has properties whereys(u) ≥ 0 and u∈Vys(u) = 1, and the initial probability
of each nodeuis set toy0(u) = 1/N, whereN is the number of nodes andN = |V|. Then we define the probability vectoryswhose element is the probability of each node at iteration steps. This model can be regarded as a special version of PageRank where the teleportation jump probability is set to 0.
Now we define theS-dimensional vector of nodeu:
xu=(y1(u),· · ·,yS(u)),
whereSdenotes the final step of the random-walk iterations. Hereafter,xuis called the
functional vector of nodeu.
Next, for each pair of nodes, we define the functional similarity calculated by the cosine similarity,
ρ(u,v)=
xu
xu
, xv xv
,
between the functional vectors of the corresponding nodes. Then the FCE method divides all the nodes intoK groups of functional clusters by employing the K-medoids algo-rithm (Vinod1969) due to its robustness. Formally, we maximize the following objective function with respect to set of medoidsR⊂V:
f(R)=
v∈V
max
To maximize this objective function, we employ a greedy algorithm based on the following marginal gain of each node:
g(w;R)=f(R∪ {w})−f(R)=
v∈V\R
max{ρ(v,w)−μ(v;R), 0}, (2)
wherewis a candidate node of the medoid,Ris the set of already selected medoids, and μ(v;R)=maxr∈Rρ(v,r)is the similarity between nodevand the most similar medoid,r.
The greedy algorithm selects a node that gives the highest marginal gain with respect to the already selected medoid set as the next medoid (representative vector):
rk=arg max w∈V\R
g(w;R). (3)
Therefore, we obtain a node with the most central functional vector as the first medoid and a node with the most different functional vector from the first medoid as the sec-ond medoid. That is, in the FCE method, each medoid is a representative node of each functionally different area.
For a large-scale network, however, theK-medoids method based on a greedy algorithm needs a huge amount of computation time,ON2S, to calculate the functional similarity of all the node pairs, and it is also difficult to store allN(N−1)/2 similarities on the main memory. Thus we have to re-calculate all the similarities in all theK-greedy steps of
K-medoids clustering, and the calculation cost becomesOKN2S.
Simple selection of approximate medoids from a single source network
Spatial networks like urban streets have similar topological structures among distant areas (Wang et al.2012; Jiang et al.2014; Fushimi et al.2016a). By exploiting this knowl-edge, we propose a fast method of the clustering phase in the FCE method based on transfer learning, which utilizes a set ofKmedoids in a source domain network (source network) for clustering all the nodes of a target domain network (target network). In our context, source and target networks respectively stand for a network whose nodes have been already divided intoKclusters and a network whose nodes have not been clustered. Hereafter, this method is called the Transfer Learning (TL) method.
Formally, letV andXbe a set of nodes and a set of functional vectors of a target net-work, and letZ= {z1,. . .zK}be a set of medoid vectors in a source network, all of which
were previously selected by K-medoids clustering with a greedy algorithm in the FCE method. Then the TL method selectsK-approximate medoidsR = r1,. . .,rK ⊂V of the target network as follows:
rk=arg max
v∈V
zk
zk
, xv xv
.
The TL method extractsK-approximate medoids from theNnodes in the target net-work by calculating the cosine similarities between theS-dimensional functional vectors of all pairs ofKmedoids in the source network and theN-medoid candidates in the target network. Then the TL method divides the(N−K)remaining nodes in the target network intoK-approximate functional clusters by calculating the cosine similarities between the
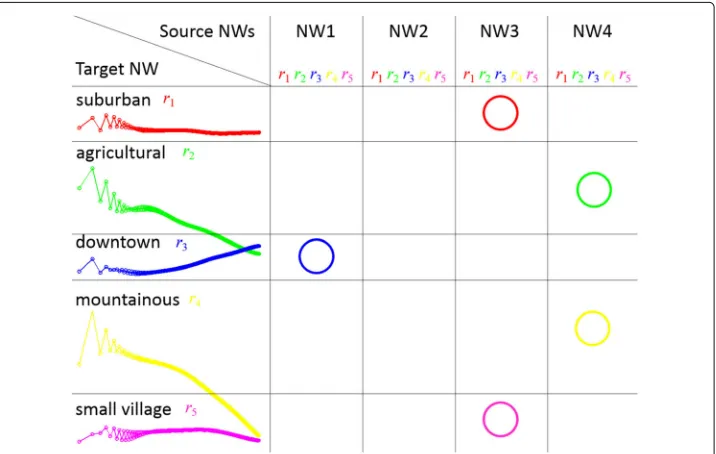
Greedy selection of approximate medoids from multiple source networks When using the TL method, we obtain good approximation results by selecting an appro-priate network as a source network. But it is difficult to know in advance which network is suitable. In addition, generally speaking, a network contains regions that resemble mul-tiple networks rather than a single network. Figure2shows an example of the similarities of the five medoids of a target network and the five medoids of four source networks. In this example, the first medoid,r1, of the target network is a node of a suburban area and most resembles the first medoid of source network NW3. Similarly to the above, the sec-ond medoid,r2, of the target network is a node of an agricultural area and most closely resembles the second medoid of source network NW4. That is, the target network has similar regions with source networks NW1, NW3, and NW4 rather than a specific source network.
Based on these considerations, we propose a greedy selection method that selectsK -approximate medoids from multiple networks as source domain rather than a single network. Hereafter, this method is referred to as the Greedy Selection (GS) method.
Formally, letV andXbe a set of nodes and a set of functional vectors of a target net-work, and letZ(m) =
z(1m),. . .z(Km)
be a set of medoid vectors in one source network
Gm, where these medoid vectors were previously selected byK-medoids clustering with
a greedy algorithm in the FCE method. When given the medoid vectors ofMsource net-worksG1,. . .,GM, the GS method selectsK-approximate medoidsR=
r1,. . .,rK ⊂V
of the target network in the following steps:
1. SelectK sets of medoid candidatesU(k)⊂V;
2. SelectK -approximate medoidsRfrom each setU(k)of medoid candidates.
In the first step, the GS method selectsMK nodes as medoid candidates by calculating the cosine similarity for all the pairs of theK-medoid vectors in theMsource networks and theNvectors:
u(k|m)=arg max
u∈V
z(km)
z(km), xu
xu
.
Then for eachk, we defineU(k) = {u(k|1),. . .,u(k|M)}as a set of the medoid can-didates of k. In the second step, the GS method selects the K-approximate medoids by maximizing the objective function in Eq. (1) with respect to the set of approximate medoidsR ⊂ U, whereUis a union of the set of medoid candidates,U = Kk=1U(k). To maximize the objective function, we employ a greedy algorithm similarly to theK -medoids method in the original FCE method, where we select approximate medoidrkof thekstep as follows:
rk=arg max
u∈U(k)
gu;R=arg max
u∈U(k)
v∈V\R
max{ρ(v,u)−μv;R, 0}, (4)
whereρ(·)andμ(·), which are used in Eq. (4), are the same as those defined in Section3. The difference between the greedy K-medoids method in the original FCE method (Eq. (3)) and the GS method (Eq. (4)) is the size of the search space of the marginal gain, and the former is the total number of nodesN = |V|, and the latter is the number of source networksM= |U(k)| N.
The GS method extractsMK-medoid candidates from theN nodes in the target net-work by calculating the cosine similarities between theS-dimensional functional vectors of all the pairs of theMK-medoids in the source networks and theNnodes in the tar-get network. Next it extracts theK-approximate medoids from theMcandidates at each of theK-greedy steps by calculating the cosine similarities between theS-dimensional functional vectors of all the pairs ofMcandidates andNnodes. Therefore, the total com-putational cost becomesO(MKNS), which is slightly larger than that of the TL method
O(KNS)but much smaller than that of the original FCE methodKN2S.
Spatial network dataset
In our experiments, we used the following 15 cities extracted from Open Street Map (OSM)1 and Digital Road Map (DRM) data. We extracted all the intersections and the roads of each city and constructed a spatial network with intersections as nodes and the roads between them as links. To simplify our analyses, we deleted nodes that represent the curved segments of highways by directly connecting both sides of the deleted ones.
Table1shows the basic statistics of the networks for the 15 cities, whereCandL respec-tively denote the averages of the clustering coefficients and the shortest path length over each network. Although the numbers of nodes and links|V|and|E|are substantially dif-ferent, the degree distributions defined bypjas well asCandLare quite similar as the
common characteristics of these spatial networks.
Evaluation of computation time
We experimentally evaluated the efficiency of our proposed method, the GS method, in terms of its computation time by comparing the following three baseline methods includ-ing our previous methods: the first method, which only employs the Lazy Evaluation (LE) technique (Leskovec et al.2007), is referred to as the (a) LE method; the second method, which employs LE, medoid pruning, and outlier pivot pruning techniques (Fushimi et al.
Table 1Basic network statistics
City |V| |E| p1 p2 p3 p4 p>4 C L Aichi 259,915 402,465 .065 .070 .574 .285 .006 0.04 98.71 Barcelona 66,790 99,387 .103 .031 .659 .201 .006 0.06 53.07 Brasilia 95,811 136,955 .133 .025 .694 .146 .002 0.04 92.94
Chiba 227,791 335,564 .116 .003 .703 .177 .002 0.04 99.73 Ibaraki 172,892 263,075 .083 .002 .708 .205 .003 0.04 111.02 Kanagawa 295,151 402,576 .192 .051 .597 .155 .005 0.04 129.17 Kyoto 88,800 128,601 .099 .090 .633 .174 .004 0.07 103.43
New York 325,962 466,510 .159 .033 .600 .204 .004 0.04 103.14 Osaka 261,939 375,750 .133 .066 .606 .190 .006 0.05 91.32 Saitama 230,408 351,811 .084 .001 .695 .217 .003 0.04 81.04 San Francisco 110,700 156,821 .173 .037 .583 .199 .009 0.05 79.43 Seoul 103,444 150,822 .111 .078 .605 .198 .008 0.04 43.99
Shizuoka 110,925 162,322 .121 .070 .576 .228 .005 0.05 83.09 Tokyo 340,919 485,858 .163 .034 .599 .197 .006 0.03 126.19 Washington D.C. 24,564 38,053 .096 .028 .571 .293 .012 0.05 51.89
pivots to 10; and the third method, based on the Transfer Learning (TL) technique men-tioned in Section4, is called the (c) TL method (Fushimi et al.2017c). In our experiments, we changed the number of medoids,K, from 2 to 10, the number of dimensionalities of the functional vectors,S, to 10, 100, 1000, and 10,000, and set the number of source net-works,M=14, in the GS method. We performed our experiments on a computer system equipped with an Xeon processor E5-2697 2.7 GHz and 256-GB main memory.
Figure3shows the computation times of the above methods, where TL is the average computation times that used each of the 14 networks as a source network. We show the results of eight randomly selected networks from Table1by setting the number of dimen-sionalities of each functional vector asS=10, 000, where the horizontal and vertical axes respectively stand for the number of medoids (clusters) and the computation times with a logarithmic scale. Note that we only show the computation time of the clustering phase without including the calculations of the functional vectors. From Fig.3, for all the net-works, the methods with the approximate medoids, TL and GS, worked extraordinarily
a b c d
e f g h
faster than the LE and PP methods. Furthermore, the computation times of the former two methods barely changed as the number of medoidsKbecomes larger.
Figure4shows the computation times of the four methods for the eight networks (as in Fig.3) by setting the number of medoids toK =10, where the horizontal axis stands for the number of dimensionalities of the functional vectors. From Fig.4, for all the net-works, the TL and GS methods returned clustering results much faster than the LE and PP methods, regardless of the number of dimensionalities of vectors.
Evaluation of clustering accuracy
Since the GS and TL methods select approximate medoids based on medoids of other networks, the clustering results somewhat differ from the original FCE method, unlike the LE and PP methods. Thus, in this section, we evaluated the GS method’s performance in terms of clustering accuracy and compared it to the TL method’s average accuracy. In the FCE method, since the meaning of the extracted order of the functional medoids (clusters) is important, we employ an accuracy measure widely used in multiclass classification,
ACC= M1 Kk=1Mkk, calculated by the sum of the diagonal elements of confusion matrix
Mkkand the total number of classifications,M=
K
k=1Kh=1Mkh. In our experiments,
we regard the class obtained by the FCE method as the actual one and the one obtained by the TL and GS methods as the estimated one.
First, we show the accuracy of the TL methods for each pair of target and source net-works in Fig.5, where the horizontal and vertical axes stand for the target and source networks, respectively.
From Fig.5, for each target network, the accuracy shows various values from low to high. For example, for the Aichi network atK=5, the highest accuracy (ACC=0.92) can be obtained using Chiba as a source network, and on the other hand, the lowest accuracy (ACC=0.23) can be obtained using Tokyo. These results indicate that high accuracy can only be obtained when selecting the appropriate network as the source network.
In addition, even though we select the Washington D.C. network as a source network, which is the smallest one used in our experiments, high accuracy can be obtained for the New York, the Seoul and the Shizuoka networks. These observations suggested that clustering accuracy does not depend on the scales of source and target networks. However
a b c d
e f g h
a b
Fig. 5Clustering accuracy (S=10, 000)aK = 5bK = 10
we conjecture that the TL method does not work well in the case that a source network is too small to contain only uniform functional region such as a lattice.
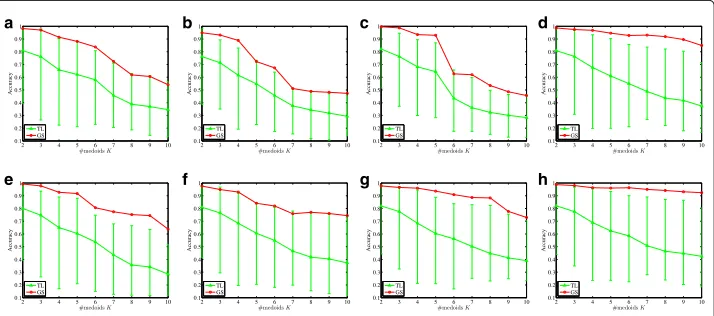
In Fig.6, we plotted the GS method’s accuracy as a red line and the the average accuracy and the range (maximum-minimum) of the TL method as a green error bar, with respect to the number of medoids. From Fig.6, for all the networks, the accuracy of the GS meth-ods is significantly higher than the average accuracy of the TL methmeth-ods and somewhat higher than their maximum accuracy at almost all the points. These results confirmed that by combining the medoids of multiple source networks, clustering results with better accuracy can be obtained rather than using a specific source network.
Evaluation of objective function value
In this section, we evaluated the GS method in terms of objective function values. When we select more adequate nodes as medoids, the value of the objective function (Eq.1) becomes larger. Therefore, we compare the objective function values of the TL and GS methods. Furthermore, to improve the quality of the clustering results, we introduce an update mechanism that is likek-means to the TL and GS methods, which we call Divided Improvement (DI).
a b c d
e f g h
Formally, letX,R=r1,. . .,rK , andV(k)= {u|c(u)=k} ⊂Vbe the set of functional vectors, the set of approximate medoids obtained by the TL or GS methods, and the set of nodes that belongs to therk’s cluster, respectively, where 1 ≤c(u) ≥Kstands for the cluster label of nodeu. First, for thek-th clusterV(k), we select the most central noderˆk
whose sum of cosine similarity with the other nodes in the cluster is the highest:
ˆ
rk=arg max u∈V(k)
v∈V(k)
ρ(v,u)=arg max
u∈V(k)
v∈V(k)
˜xv,x˜u =arg max u∈V(k)
v∈V(k) ˜
xv,x˜u
,
where each functional vector is normalized asx˜u ←xu/xu. If selected central noderˆk
is different from approximate medoidrk, we update the medoid asrk← ˆrk. This medoid
update takes a computational cost ofO(NS). Second, we divide the(N−K)remaining nodes into K clusters like Voronoi Tessellation with a computational cost ofO(KNS). By repeating these steps until not all of the medoids change, we improve the clustering quality. Hereafter, the TL and GS methods equipped with the DI technique are called TL+DI and GS+DI, respectively.
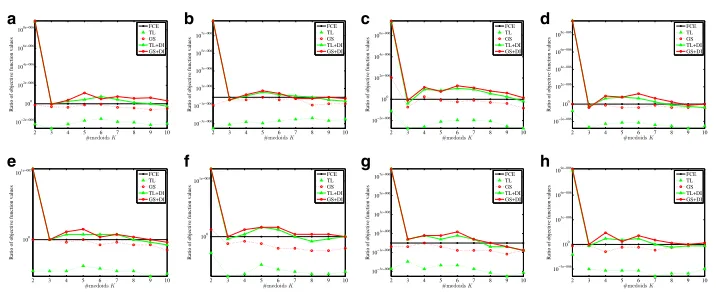
Figure 7 shows the ratio of the objective function values of four methods, TL, GS, TL+DI, and GS+DI, and that of the original FCE method with respect to the number of medoidsK, where the vertical axis is a logarithmic scale. From Fig.7, the objective func-tion values are improved by introducing the DI technique at almost all the number of medoids.
Conclusion
In this paper, we quickly and accurately extracted functionally similar regions from large-scale spatial networks, based on a transfer learning technique that utilizes previously selected representative nodes (medoids) in a different area. With the transfer learning method developed in our previous study, we proposed the GS method by extending the source domain from one specific network to multiple networks and greedily selecting appropriate medoids from these source networks based on the marginal gain of the objec-tive function. One of the virtues of the GS method is that when using it, we need not to know in advance which network is adequate as a source domain. From experimental eval-uations with real spatial networks, we confirmed that our proposed method, GS, outputs
a b c d
e f g h
more accurate clustering results than our existing one, TL, while still maintaining almost the same calculation speed.
Our proposed method is potentially applicable to some kind of networks other than spa-tial networks. For instance, functions like president, manager, chief and general employee commonly exist in employee networks of some companies. To extract these functions from a target employee network, our method utilizes representative functions of other companies. However, in order to confirm this claim, we need further experiments in our future study.
Therefore, in the future, we will conduct further experiments using social or web networks in addition to spatial networks.
Endnote
1https://mapzen.com/data/metro-extracts
Acknowledgments
We thank Prof. Seiya Okubo of the University of Shizuoka, Shizuoka, Japan, for supporting computation environments.
Funding
All authors are grateful for the financial support from JSPS Grant-in-Aid for Scientific Research (No.17H01826).
Availability of data and materials
The raw datasets used and analysed during the current study are available from an Open Street Map (OSM) site,https:// mapzen.com/data/metro-extracts, and Digital Road Map (DRM) data,http://www.drm.jp/english/drm/e_index.htm.
Authors’ contributions
TF performed the research and wrote the article. KS contributed to designing the proposed method. TI contributed preparation of experimental data and part of experimental evaluations. KK contributed survey of related work and part of experimental evaluations. All authors read and approved the final manuscript.
Competing interests
The authors declare that they have no competing interests.
Publisher’s Note
Springer Nature remains neutral with regard to jurisdictional claims in published maps and institutional affiliations.
Author details
1Tokyo University of Technology, 1404-1 Katakuramachi, Hachioji city, Tokyo 192–0982, Japan.2Kanagawa University,
2946 Tsuchiya, Hiratsuka city, Kanagawa 259–1293, Japan.3Center for Advanced Intelligence Project, RIKEN, 1-4-1
Nihonbashi, Chuo-ku, Tokyo 103-0027, Japan.4University of Shizuoka, 52-1 Yada, Suruga-ku, Shizuoka city, Shizuoka
422–8526, Japan.5Wakayama University, 930 Sakaedani, Wakayama city, Wakayama 640–8510, Japan.
Received: 2 March 2018 Accepted: 18 June 2018
References
Aggarwal A, Deshpande A, Kannan R (2009) Adaptive sampling for k-means clustering. In: Proceedings of the 12th International Workshop and 13th International Workshop on Approximation, Randomization, and Combinatorial Optimization. Algorithms and Techniques. Springer-Verlag, Berlin, Heidelberg. pp 15–28
Berry BJL (1964) Approaches to regional analysis: A synthesis. Ann. Assoc. Am. Geogr. 54:2–11
Berry, BJL (1968) Interdependency of spatial structure and spatial behavior: A general field theory formulation. Papers Reg. Sci. Assoc. 21:2050–227
Burckhart K, Martin OJ (2012) An Interpretation of the Recent Evolution of the City of Barcelona through the Traffic Maps. J. Geogr. Inf. Syst. 4(4):298–311
Chen W, Liu W, Ke W, Wang N (2018) Understanding spatial structures and organizational patterns of city networks in China: A highway passenger flow perspective. J. Geogr. Sci. 28(4):477–494
Crucitti P, Latora V, Porta S (2006) Centrality Measures in Spatial Networks of Urban Streets. Phys. Rev. E 73(3):036,125+ Everett M, Borgatti S (1994) Regular equivalence: General theory. J. Math. Sociol. 19(1):29–52
Farmer CJQ, Fotheringham AS (2011) Network-Based Functional Regions. J. Environ. Plan. A Econ. Space 43(11):2723–2741 Fushimi T, Saito K, Ikeda T, Kazama K (2016a) Extracting and Characterizing Functional Communities in Spatial Networks.
In: Proceedings of the Workshop on Artificial Intelligence for Tourism (AI4Tourism2016). pp 182–193
Fushimi T, Saito K, Ikeda T, Kazama K (2016b) Functional Cluster Extraction from Large Spatial Networks. In: ASONAM ’16: Proceedings of the 2016 IEEE/ACM International Conference on Advances in Social Networks Analysis and Mining. IEEE Press, Piscataway. pp 57–62
Fushimi T, Saito K, Kazama K (2012) Extracting Communities in Networks based on Functional Properties of Nodes. In: Richards D, Kang BH (eds). Proceedings of the 12th Pacific Rim Knowledge Acquisition Workshop (PKAW2012). Springer-Verlag, Berlin, Heidelberg. pp 328–334
Gilpin S, Eliassi-Rad T, Davidson I (2013) Guided learning for role discovery (glrd): Framework, algorithms, and applications. In: Proceedings of the 19th ACM SIGKDD International Conference on Knowledge Discovery and Data Mining. ACM, New York. pp 113–121
Grigg DB (1965) The logic of regional systems. Ann. Assoc. Am. Geogr. 55:465–491
Henderson K, Gallagher B, Eliassi-Rad T, Tong H, Basu S, Akoglu L, Koutra D, Faloutsos C, Li L (2012) Rolx: Structural role extraction & mining in large graphs. In: Proceedings of the 18th ACM SIGKDD International Conference on Knowledge Discovery and Data Mining. ACM, New York. pp 1231–1239
Henderson K, Gallagher B, Li L, Akoglu L, Eliassi-Rad T, Tong H, Faloutsos C (2011) It’s who you know: Graph mining using recursive structural features. In: Proceedings of the 17th ACM SIGKDD International Conference on Knowledge Discovery and Data Mining. ACM, New York. pp 663–671
Jiang B, Duan Y, Lu F, Yang T, Zhao J (2014) Topological structure of urban street networks from the perspective of degree correlations. Environ. Plan. B Plan. Design 41(5):813–828
Jiang C, Li Y, Shao M, Jia P (2002) Accelerating clustering methods through fractal based analysis. In: KDD-2002 workshop report fractals and self-similarity in data mining: issue and approaches. ACM, New York
Leskovec J, Krause A, Guestrin C, Faloutsos C, VanBriesen J, Glance N (2007) Cost-effective outbreak detection in networks. In: Proceedings of the 13th ACM SIGKDD International Conference on Knowledge Discovery and Data Mining. ACM, New York. pp 420–429
Lin F, Cohen WW (2010) Power iteration clustering. In: Proceedings of the 27th International Conference on Machine Learning (ICML-10). International Machine Learning Society. pp 655–662
Lorrain FH, White H (1971) Structural equivalence of individuals in social networks. J. Math. Sociol. 1(1):49–80 Montis DA, Barthelemy M, Chessa A, Vespignani A (2007) The Structure of Interurban Traffic: A Weighted Network
Analysis. Environ. Plan. B Plan. Des. 34(5):905–924
Newman MEJ (2004) Detecting Community Structure in Networks. Eur. Phys. J. B Condens. Matter Complex Syst. 38(2):321–330.https://doi.org/10.1140/epjb/e2004-00124-y
Opsahl T, Agneessens F, Skvoretz J (2010) Node Centrality in Weighted Networks: Generalizing Degree and Shortest Paths. Soc. Networks 32(3):245–251
Palla G, Derényi I, Farkas I, Vicsek T (2005) Uncovering the Overlapping Community Structure of Complex Networks in Nature and Society. Nature 435:814–818
Park K, Yilmaz A (2010) A Social Network Analysis Approach to Analyze Road Networks. In: Proceedings of the ASPRS Annual Conference 2010
Rossi RA, Ahmed NK (2015) Role discovery in networks. IEEE Trans Knowl Data Eng 27(4):1112–1131 Rossi RA, Gallagher B, Neville J, Henderson K (2012) Role-dynamics: Fast mining of large dynamic networks. In:
Proceedings of the 21st International Conference Companion on World Wide Web. ACM, New York. pp 997–1006 Rossi RA, Gallagher B, Neville J, Henderson K (2013) Modeling dynamic behavior in large evolving graphs. In: Proceedings
of the Sixth ACM International Conference on Web Search and Data Mining. ACM, New York. pp 667–676 Rosvall M, Bergstrom CT (2007) An information-theoretic framework for resolving community structure in complex
networks. Proc. Natl. Acad. Sci. 104(18):7327–7331
Seidman SB (1983) Network structure and minimum degree. Soc. Networks 5(3):269–287
Vinod H (1969) Integer Programming and the Theory of Grouping. J. Am. Stat. Assoc 64(326):506–19.https://doi.org/10. 1080/01621459.1969.10500990
Wang P, Hunter T, Bayen AM, Schechtner K, Gonzalez MC (2012) Understanding Road Usage Patterns in Urban Areas. Sci. Rep. 2:1001
Yin J, Soliman A, Yin D, Wang S (2017) Depicting urban boundaries from a mobility network of spatial interactions: A case study of Great Britain with geo-located Twitter data. Int. J. Geogr. Inf. Sci. 31:1293–1313