(RMP) coils in a large helical device (LHD) without any additional impurity gas puffing. Study of the impurity radiation is then important to clarify the physical mechanism triggering the RMP-assisted detachment. Resonance lines of CIII (977.02 Å, 2s2p–2s2), CIV (1548.2 Å, 2p–2s), CV (40.27 Å, 1s2p–1s2), and CVI (33.73 Å, 2p–1s)
measured by vacuum ultraviolet (VUV) and extreme ultraviolet (EUV) spectrometers are used to estimate the radiation power from C2+–C5+ ions because carbon is the most abundant impurity element in LHD. For the
purpose the spectral intensity from the VUV spectrometer is absolutely calibrated using the EUV spectrometer, with which the spectral intensity has already been calibrated. The partial carbon radiation at each ionization stage of C2+to C5+ions,P
rad(Cq+), can be estimated for attached and detached plasmas by calculating the ratio of the
partial carbon radiation to the resonance line based on ADAS atomic code. It is found that the radiation from C3+ions existing near a radial location ofι/2π=1 in the ergodic layer increases up to 40% of the total radiation
loss and becomes a dominant origin to trigger the detached plasma, whereas carbon radiation is negligible in the attached plasma.
c
2016 The Japan Society of Plasma Science and Nuclear Fusion Research
Keywords: EUV spectroscopy, VUV spectroscopy, detached plasma, radiation loss, carbon radiation DOI: 10.1585/pfr.11.2402019
1. Introduction
Steady operation of detached plasma has been achieved without additional impurity gas puffing in the Large Helical Device (LHD) by forming an m/n = 1/1 magnetic island atι/2π=1 in the ergodic layer with res-onant magnetic perturbation (RMP) coils [1]. Carbon re-leased from graphite divertor plates is a dominant intrin-sic impurity in high-density LHD discharges [2]. Then, it seems that the carbon radiation during the plasma detach-ment is also important for the effective edge plasma cool-ing triggercool-ing the detachment. In LHD, C2+and C3+ions with low ionization energies (Ei =48 and 65 eV) are
lo-cated near the outer boundary in the ergodic layer, whereas C4+and C5+ions with relatively high ionization energies
(Ei=392 and 490 eV) are located near the last closed flux
surface (LCFS) [2]. In the RMP-assisted plasma detach-ment, therefore, it is very interesting to compare the radia-tion power from C2+and C3+ions located outsideι/2π=1
with that from C4+and C5+ions located insideι/2π=1.
The partial radiation power at each ionization stage in the carbon ions of C2+ to C5+, P
rad (Cq+), is analyzed
from the line intensities of CIII–CVI resonance transitions, which can be measured with extreme ultraviolet (EUV: 10 -author’s e-mail: [email protected]
∗)This article is based on the presentation at the 25th International Toki
Conference (ITC25).
500 Å) and vacuum ultraviolet (VUV: 300 - 2400 Å) spec-trometers. The intensity ratio ofPrad(Cq+) to the resonance
line can be used to estimate Prad (Cq+). For the purpose
the electron temperature at the radial location where the carbon ion exists has to be evaluated because the inten-sity ratio is sensitive to the electron temperature. In addi-tion, the spectral intensity has to be absolutely calibrated for the VUV spectrometer. Thus, thePrad (Cq+) analyzed
with the intensity ratio are compared between attached and detached plasmas.
2. Experimental Setup
In LHD, them/n=1/1 magnetic island formed by the RMP coil system was originally used for the local island divertor experiment to realize an efficient particle exhaust. The O-point of them/n=1/1 magnetic island is then po-sitioned in the outboard side of the horizontally elongated plasma cross section at the #6-O or #7-O toroidal section. In the present study it is called 6-O or 7-O island configura-tion. Since the detached plasma is realized at the magnetic axis position ofRax=3.90 m, them/n=1/1 island is lo-cated in the ergodic layer due to the low edge rotational transform.
The EUV and VUV spectrometers are installed on the #10-O diagnostic port of LHD, as shown in Fig. 1 (a).
c
2016 The Japan Society of Plasma
Fig. 1 (a) Schematic view of space-resolved EUV and VUV spectrometers (EUV_Short2 and EUV_Long2) and high-time-resolution EUV and VUV spectrome-ters (EUV_Long, VUV_109L and VUV_106R) and (b) observation area of EUV_Long, VUV_109L and VUV_106R.
In the present study, two EUV spectrometers named EUV_Short (10 - 100 Å) and EUV_Long (50 - 650 Å) and two 20-cm normal incidence VUV spectrometers named VUV_109L (300 - 1000 Å) and VUV_106R (970 - 1900 Å) are used for simultaneous high-time-resolution mea-surements (5 ms) of the carbon resonance lines, i.e. CIII (977.02 Å, 2s2p–2s2), CIV (1548.2 Å, 2p–2s), CV (40.27
Å, 1s2p–1s2) and CVI (33.73 Å, 2p–1s) [3, 4]. Two
space-resolved EUV spectrometers named EUV_Short2 and EUV_Long2 are used for simultaneous vertical pro-file measurements of CIII (386.2 Å), CIV (384.17 Å), CV (40.27 Å) and CVI (33.73 Å) in the range of−0.6≤
Z ≤ 0.6 m with a time resolution of 100 ms [5–7]. The EUV_Long, VUV_109L and VUV_106R have a similar observation range, as shown in Fig. 1 (b).
3. Calibration of VUV Spectrometers
In order to obtain the absolute intensities of the CIII and CIV resonance lines, the spectral intensity measured by VUV_109L and VUV_106R has to be calibrated into absolute intensity. The wavelength ranges of EUV_Long and VUV_109L overlap between 300 and 650 Å. Because the spectral intensity of EUV_Long has already been cali-brated on the basis of the bremsstrahlung profile measure-ment in previous studies [3, 8], the spectral intensity of VUV_109L can be easily calibrated by directly comparing the same spectrum from both spectrometers in the same wavelength range of 400 - 650 Å. The result is plotted in Fig. 2 with open circles.
In order to calibrate the intensity of the VUV spectra in the long wavelength range, e.g., 650 - 1600 Å, the
in-Fig. 2 Absolute intensity calibration factor of VUV_109L and VUV_106R in the wavelength range of 400 - 1600 Å.
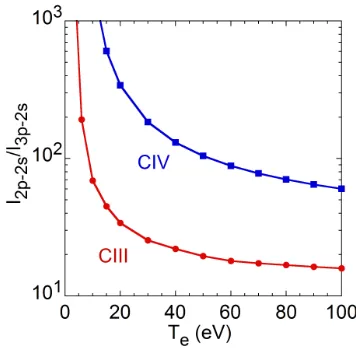
Fig. 3 Intensity ratios of CIII (977.02 Å/386.2 Å) and CIV (1548.2 Å/312.4 Å) calculated with ADAS atomic code.
tensity ratio method is applied. As shown in Fig. 3, two intensity ratios of CIII (977.02 Å/386.2 Å, 2p–2s/3p–2s) and CIV (1548.2 Å/312.4 Å, 2p–2s/3p–2s) are calculated using ADAS atomic code as a function of electron tem-perature [9]. The contribution of ne to the ratio can be
neglected because the ratio is practically insensitive tone.
Here, the absolute intensities of CIII (386.2 Å) and CIV (312.4 Å) are obtained using the EUV_Long spectrometer. The electron temperature at the radial location where the C2+–C5+ions exist is determined by analyzing the
ver-tical profile of CIII–CVI emissions, as shown in Fig. 4. The vertical profiles of CIII (386.2 Å), CIV (384.02 Å), CV (40.27 Å) and CVI (33.73 Å) are simultaneously observed with EUV_Long2 and EUV_Short2, as shown in Fig. 4 (a). A sharp peak appears in the vertical profile at 0.4<Z <
pro-Fig. 4 (a) Normalized chord-integrated vertical profiles of CIII (386.2 Å), CIV (384.02 Å), CV (40.27 Å) and CVI (33.73 Å) and (b) normalized local emissivity profiles of CIII– CVI andTeprofile as a function of minor radius.
files of CIII–CVI are obtained by reconstructing the chord-integrated profiles measured along the vertical direction based on the Abel inversion method. The magnetic sur-face necessary for the Abel inversion is calculated with the variational moments equilibrium code (VMEC), including the effect of the finite plasma pressure. Although no mag-netic surface exists in the ergodic layer, virtual magmag-netic surfaces are assumed atρ >1 by extrapolating the mag-netic flux surface atρ=1. This assumption is generally used in LHD when the analysis is carried out for the er-godic layer [6], as shown in Fig. 4 (b). The emissivity pro-file is also normalized at each peak value. Figure 4 (b) also shows theTeprofile measured by the Thomson scattering
system. Then, the electron temperature at radial locations of C2+–C5+ ions is determined from the peak position in
the CIII–CIV emissivity profiles, i.e., 15 eV for C2+, 20 eV
for C3+, 210 eV for C4+and 360 eV for C5+.
The intensity ratio in Fig. 3 is determined with the electron temperatures mentioned above. Thus, the spectral intensities from VUV_109L and VUV_106R spectrome-ters can be absolutely calibrated at wavelengths of 977.02 Å and 1548.2 Å based on the absolute intensities of CIII (386.2 Å) and CIV (312.4 Å) and the intensity ratio. The results obtained from the intensity ratio method are shown in Fig. 2 with open squares. Finally, the analyzed
calibra-Fig. 5 Ratios of partial carbon radiation power at each ioniza-tion stage to radiaioniza-tion power of resonance line calculated with ADAS atomic code: (a)Prad(C2+)/PCIII(2p–2s), (b)
Prad (C3+)/PCIV (2p–2s), (c)Prad (C4+)/PCV (2p–1s) and (d)Prad(C5+)/PCVI(2p–1s).
tion factor is fitted with a smooth curve in the wavelength range of 400 - 1600 Å, as shown in Fig. 2 with solid line.
4. Estimation of Partial Radiation
P
rad(C
q+)
The radiation power of the resonance transition gen-erally occupies a considerably large part in the radiation power from impurity ions in a certain ionization stage. Be-cause the absolute intensities of the resonance lines of CIII (977.02 Å), CIV (1548.2 Å), CV (40.27 Å) and CVI (33.73 Å) are measured with the EUV and VUV spectrometers, the ratio of Prad (Cq+) to resonance line intensity in Cq+
ions can be calculated with the ADAS atomic code. The ratio ofPrad(Cq+) to the resonance line intensity is shown
in Figs. 5 (a)-(d) as a function of electron temperature with the parameter of electron density. Because the ratio is prac-tically insensitive tone, as shown in Fig. 5, the contribution
ofnecan be neglected in the present analysis. As the value
ofTefor each ionization stage of carbon ions is already
de-termined from the profile analysis done in Fig. 4 (b),Prad
(Cq+) can be evaluated from the intensity ratio in Fig. 5.
5.
P
rad(C
q+) in Attached and
De-tached Plasmas
The partial carbon radiation ofPrad (C2+)–P
rad (C5+)
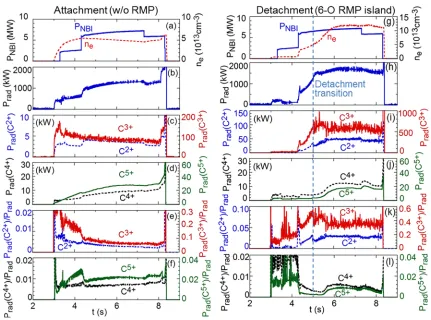
negative-ion-Fig. 6 Time behaviors of (a) NBI port-through power and line-averaged electron density, (b) total radiation loss (Prad), partial carbon radiation power of (c)Prad (C2+) and Prad (C3+) and (d)Prad (C4+) and Prad (C5+) and ratios ofPrad (Cq+) to Prad of (e) Prad (C2+)/P
radandPrad(C3+)/Pradand (f)Prad(C4+)/PradandPrad(C5+)/Pradin the attached plasma without RMP. Graphs (g)-(l) show the time behaviors for detached plasma with 6-O RMP island in the same meaning as those of graphs (a)-(f).
source-based NBIs. The total radiation loss, Prad, shows similar values for both plasmas, i.e., 20% - 25% to the port-through NBI power,PNBI. In the attached plasma, the
line-averaged electron density is constantly maintained (∼5× 1013cm−3) duringt=4 - 8 s withPrad=1400 kW. The
con-tributions ofPrad (C2+) andPrad(C4+) toPradare less than
1%, whereas those ofPrad (C3+)/Prad andPrad (C5+)/Prad
are 8% and 2%, respectively.
In the discharge with detached plasma, them/n=1/1 island is formed in the ergodic layer and the O-point of the island is located at the outboard side of the #6 toroidal sec-tion. With increase in the electron density, plasma detach-ment occurs att=5.0 s, as shown in Figs. 6 (g)-(l). The electron density starts to increase after the occurrence of detachment att=5.0 s but saturates att=6.0 s. The plasma detachment is steadily maintained at a high density ofne=
12×1013cm−3duringt=6 - 8 s until the end of the NBI
pulse. The radiation loss also reaches the maximum value ofPrad=1700 kW during this period. Compared with the attached plasma, it is found that thePrad(C2+)/P
radandPrad
(C3+)/P
radsignificantly increase to 3% and 40% during the
detachment phase, respectively, whereas the increment of
Prad is only 300 kW. In contrast, Prad (C4+)/P
rad andPrad
(C5+)/Praddo not significantly change compared to the
at-tached plasma.
The drastic increase inPrad(C2+) andP
rad (C3+)
dur-ing the detachment phase is very clear from the present analysis. Prad (C3+) expresses a dominant portion in the
total carbon radiation in the detached plasma. A flatten-ing of theTeprofile appears during the detachment phase
in edgeTeof 10 - 20 eV at the radial location of the m/n
=1/1 magnetic island [1]. Radial locations of C2+ and C3+ions are also broadened reflecting theTeflattening as
shown in Fig. 4 (b). The expansion of the radial location significantly enhancesPrad(C2+) andPrad(C3+) in the
de-tached plasma. Therefore, it is concluded that a change in the edge transport of C2+and C3+ions located near them/n
=1/1 island brought by the RMP field plays an important role in achieving the present plasma detachment. In addi-tion, the carbon transport near the LCFS is not affected by the supplied RMP field becausePrad (C4+) andPrad (C5+)
do not change in both discharges with attachment and de-tachment.
The authors thank all members of the LHD exper-imental group for their technical supports. This work was partially carried out under the LHD project
finan-[8] C.F. Donget al., Rev. Sci. Instrum.82, 113102 (2011). [9] H.P. Summerset al., Plasma Phys. Control. Fusion48, 263