Microwave Reflectometry Diagnostics: Present Day Systems and
Challenges for Future Devices
∗
)
Teresa ESTRADA
1,2), Kazunobu NAGASAKI
1), Emilio BLANCO
2), Germ´an PEREZ
2)and Victor TRIBALDOS
3)1)Institute of Advanced Energy, Kyoto University, Uji 611-0011, Japan 2)Laboratorio Nacional de Fusi´on. As. Euratom-CIEMAT, 28040 Madrid, Spain
3)Universidad Carlos III de Madrid. Legan´es, Madrid, Spain (Received 27 November 2011/Accepted 23 March 2012)
Microwave reflectometry technique has experienced significant advances in the last two decades becoming a very attractive diagnostic presently used in almost all fusion devices. This technique allows measuring electron density profiles, plasma instabilities, turbulence and radial electric fields with excellent spatial and temporal resolution. Although it is not straightforward, the extension of reflectometry to future devices is possible partially due to the limited access needed to accommodate the antennas inside the vacuum vessel keeping the sensitive elements as microwave sources and detectors outside the radiation area. However, in order to achieve a good diagnostic performance, limitations related to relativistic effects, intense neutron- andγ-radiation and long pulse operation have to be considered in the reflectometer design phase.
c
2012 The Japan Society of Plasma Science and Nuclear Fusion Research
Keywords: radio-frequency and microwave measurements, tokamak, stellarator, steady-state operation DOI: 10.1585/pfr.7.2502055
1. Introduction
Microwave Reflectometry, a radar technique used ini-tially in ionospheric studies and since the early 1980’s for diagnosing fusion plasmas, has experienced significant ad-vances in the last two decades. By probing the plasma per-pendicularly to the density cut-offsurfaces, microwave re-flectometry diagnostics allow measuring the electron den-sity profile, plasma instabilities and denden-sity turbulence. For a review see Ref. [1]. During the 1990’s different ap-proaches were developed to overcome the deleterious ef-fect of the turbulence on the density profile measurement, becoming nowadays an almost routine diagnostic for pro-file measurements in many devices. Similarly, turbulence measurements have been extended from the initial single frequency systems to multiple frequency correlation sys-tems and ultra-fast sweep frequency syssys-tems. Furthermore, in the last decade a new technique, Doppler reflectometry, has been developed able to measure simultaneously plasma turbulence and flows with excellent spatio-temporal reso-lution. All these advances, briefly outlined in section 2, make reflectometry a very attractive diagnostic presently used in almost all fusion devices. The International Reflec-tometry Workshop series proceedings [2] and the special issue of Nuclear Fusion journal dedicated to Reflectom-etry, published in Sept. 2006 [3], represent an excellent summary of the developments and present applications of this technique. Although it is not straightforward, the ex-author’s e-mail: [email protected]
∗)This article is based on the invited presentation at the 21st International
Toki Conference (ITC21).
tension to future devices like ITER is still possible par-tially due to the limited access needed to accommodate the antennas inside the vacuum vessel and the possibility to use stainless steel or carbon-based materials for the anten-nas keeping the sensitive elements as microwave sources and detectors outside the radiation area. However, limi-tations related to relativistic effects, intense neutron- and
γ-radiation and long pulse operation may hinder the good performance of reflectometry diagnostics in future devices if these effects are not properly considered in the diagnos-tics design and construction phases. Present-day reflec-tometry applications using both, conventional and Doppler systems and some of the latest advances are outlined in section 2. The main difficulties found when extrapolating present-day reflectometry systems to future fusion devices are discussed in section 3: the limitations due to relativistic effects in section 3.1, the influence of radiation heating on the diagnostic front-end design in section 3.2 and the need for real time plasma monitoring and control in section 3.3. Finally some conclusions are drawn in section 4.
2. Present-Day Reflectometry Systems
Microwave reflectometry systems can be grouped in two categories, conventional and Doppler reflectometry, depending on which of the physical processes undergone in the plasma by the probing microwave beam is dominating the recorded signals. Whereas conventional reflectometry measures the signal reflected at the plasma cut-offlayer, Doppler reflectometry measures the Bragg back-scattered
c
2012 The Japan Society of Plasma
one.
2.1
Conventional reflectometry systems
Conventional reflectometry is used to measured elec-tron density profile, plasma instabilities and density turbu-lence by probing the plasma perpendicularly to the den-sity cut-off surfaces and detecting the signal after reflec-tion at the cut-off layer. To measure the density profile the probing frequency must be swept in time or multi-ple frequencies must be used to cover the whole density range. Present systems use different approaches to min-imize the effect of the plasma turbulence on the profile measurements, i.e., Amplitude Modulation, Pulse or Fast Frequency Modulation reflectometry. A detailed descrip-tion of these techniques can be found in [4]. Although the first two techniques have been used in a number of devices with satisfactory results (e.g. [5–13]), the extrapolation to next generation devices involving long and complex trans-mission lines may present some limitations due to their dif-ferent response to parasitic reflections in waveguides. The third technique, Fast Frequency Modulation reflectome-try, is presently used in many devices and its use is en-visaged in ITER reflectometry systems. However, the se-lected technique to be finally used in ITER reflectometers may change depending on future advances and progress of the different approaches. The frequency sweeping time in the Frequency Modulation systems dropped from few milliseconds in the early 1990’s to tens of microseconds a decade later, with the subsequent improvement in the quality of the profile measurements and in the diagnostic capabilities (e.g. [14–17]). Furthermore, during the last years ultra-fast frequency sweeping systems are being de-veloped [18, 19] reducing the frequency sweeping time to two microseconds.Reflectometry has been applied to turbulence mea-surements since the 1980’s, although in some cases, the reflecting layer for microwave frequencies shows a com-plex corrugated structure which can lead to strong inter-ference in the reflected beam that hinders the density fluc-tuation information and makes difficult to extract quanti-tative information. Even in those cases, valuable qualita-tive information on the turbulence characteristics can be obtained as, for example, in turbulence studies during the development of transport barriers (e.g. [20–22]). Quan-titative description of the density fluctuations is possible for specific scenarios and in particular for coherent plasma perturbations, e.g. MHD modes [23] or high frequency Alfven eigenmodes [24, 25]. Fast frequency hopping re-flectometers [26] and multiple frequency correlation sys-tems (e.g. [27, 28]) have broadened the reflectometry ap-plications as they allow for turbulence correlation -radial, poloidal and/or toroidal correlation- and turbulence propa-gation velocity measurements. Besides, these multiple sys-tems allow measurements of the poloidal and/or toroidal distribution of density fluctuation [29].
To ensure a correct interpretation of the turbulence
and correlation measurements two-dimensional full-wave codes have been developed during the last years to sim-ulate the reflectometry response under different plasma conditions (e.g. [30–32]). A cooperative effort is under way for extending these codes toward a three-dimensional full-wave code able to simulate reflectometry in ITER-like plasmas [33].
Microwave Imaging Reflectometry (MIR) was pro-posed to overcome the problems found in the single line-of-sight systems by measuring the two dimensional struc-ture of plasma fluctuations near the cut-offlayer [34]. To that end this technique uses an optical system making an image of the reflecting layer onto an array of microwave receivers what requires a careful alignment and focusing of transmit and receive components. After several years of unfruitful attempts, recent results have shown promising capabilities of optimized MIR systems [35].
As already pointed out, ultra-fast frequency sweep-ing systems are besweep-ing developed [18, 19] reducsweep-ing the fre-quency sweeping time to two microseconds. These sys-tems, initially devoted to density profile measurements, of-fer the possibility to measure both, density profiles with excellent time resolution and the dynamics of the plasma turbulence from the plasma edge to the core, providing the access to new plasma physics phenomena. Outstanding re-sults, reported by Clairetet al.in the last International Re-fletometry Workshop [36], have been recently obtained in the Tore Supra tokamak.
2.2
Doppler reflectometry systems
Doppler reflectometry makes use of a finite tilt angle between the probing beam and the cut-offlayer normal to measure the Bragg back-scattered process that takes place at the cut-offlayer. This technique allows the measurement of the density turbulence and its perpendicular rotation ve-locity, at different turbulence scales and with good spatial and temporal resolution [37–40]. The perpendicular rota-tion velocity of the plasma turbulence has been shown to be dominated by theE×Bvelocity, which allows the determi-nation of the radial electric field,Er. Full-wave simulation
reduction in H-mode plasmas [46]. Furthermore, Doppler reflectometry is presently being applied in several devices to unravel the turbulence and flow interaction processes in-volved in the L-H transition physics [47–51].
The reflectometry developments outlined in this sec-tion can in principle be applied to the reflectometry mea-surements in future devices. However, the final diagnostic performance will depend to a large extent on the quality of the reflectometer front-end: antennas, waveguides, etc, and, as discussed in the next section, the full optimization of the front-end will not be always possible. Neutron and
γ-radiation challenge the front-end design as an accurate design is necessary to keep the radiation, thermal load and stress at acceptable levels. Large aperture front-end tems like those used in MIR or dynamical steerable sys-tems like those used in Doppler reflectometry are hardly feasible in this harsh environment.
3. Challenges for Future Devices
The extension of the reflectometry systems to fu-ture devices is possible partially due to the limited access needed to accommodate the antennas inside the vacuum vessel while keeping the sensitive elements as microwave sources and detectors outside the radiation area. Signal transmission to the detectors typically far away from the torus can be conducted using low-loss oversized waveg-uides. However, this extension is not straightforward. In addition to the problems associated with long pulse opera-tion and with intense neutron- andγ-radiation, the limita-tions imposed by relativistic effects have to be also consid-ered. For a review on the problems related to the develop-ment of diagnostics for steady state plasmas see [52].
3.1
Limitations due to relativistic e
ff
ects
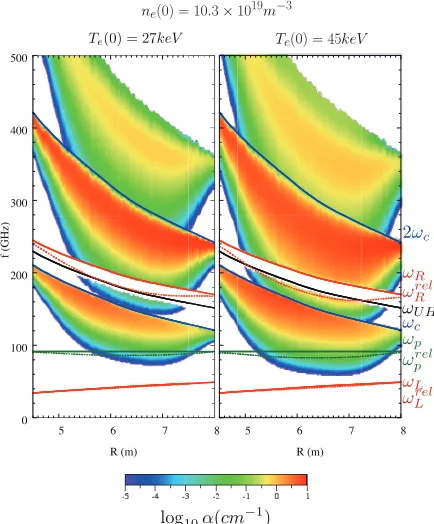
Relativistic effects modify plasma resonance and cut-off frequencies and can limit reflectometry measure-ments [54, 55]. As an example Fig. 1 shows the reso-nance and cut-off frequencies calculated using the rela-tivistic code TRECE [56] for two ITER plasma conditions. H-mode with flat density profile,ne0=1020m−3 andTe0 =27 keV, and an extreme hight temperature plasma withne0 =1020m−3 andTe0=45 keV. The relativistic correc-tion to the cut-offfrequencies reduces the gradients in the cut-offfrequency profiles in a way that depends on density and temperature profiles. This effect can hinder core den-sity measurements using either O-mode or Low Field Side (LFS) X-mode upper cut-offs in plasma scenarios with flat density profiles. Besides, wave absorption due to down-shifted electron cyclotron harmonics may preclude plasma core measurements using LFS X-mode upper cut-off inde-pendently of the density profile shape. On the other hand, X-mode lower cut-offprofile is not very much affected by relativistic effects: it keeps the moderate gradient and is not affected by the electron cyclotron absorption. As a conse-quence, the access to the plasma core in high temperature
Te(0) = 45keV ne(0) = 10.3×10¹⁹m−3
2ωc
ωR
ωrel R
ωUH
ωc ωp ωrel
p ωL
ωrel L
log10α(cm−1)
0 100 200 300 400 500
5 6 7 8
f (GHz)
R (m)
Te
TT(0) = 45keV
2ωc
ωR
ωre R
ωU ωc
ωp ωre
p ωL
ωLre L
8 5 6 7 8
R (m) Te(0) = 27keV
Fig. 1 Cut-offand resonance frequencies for two ITER plasma conditions: H-mode withne=1020m−3andTe=27 keV (left) and an extremely high temperature case withne= 1020m−3 and T
e =45 keV (right). ωc, ωp, ωL andωR are the electron-cyclotron resonance, O-mode cut-off, X-mode lower cut-offand X-mode upper cut-off frequen-cies. Cold approximation and relativistic calculated fre-quencies are shown. Color contours represent the local absorption coefficient due to EC downshifted resonances for X-mode propagation. Adapted from [53].
plasma scenarios requires the use of the High Field Side (HFS) X-mode lower cut-off. Probing the plasma from the HFS adds further complexity to the reflectometer front-end design due to the lack of near vacuum vessel ports to ac-cess the plasma. Long and often complex waveguide runs have to be used inside the vacuum vessel from the closest port to the final antenna location. Two-dimensional calcu-lations of the relativistic effects in ITER plasmas show a deformation of the X-mode upper cut-of layer surfaces in the poloidal plane [57]. Cut-layer surfaces become con-cave and as a consequence focus the reflected beam which may not longer return to the location of the emitting an-tenna. Plasma edge and gradient regions are in general less affected by relativistic effects and both O-mode or LFS X-mode upper cut-off can be used. In any case, due to the relativistic modification of plasma cut-offfrequencies, the knowledge of the electron temperature profile becomes essential to determine the density profile from the tometer data or to radially localized fixed frequency reflec-tometry measurements.
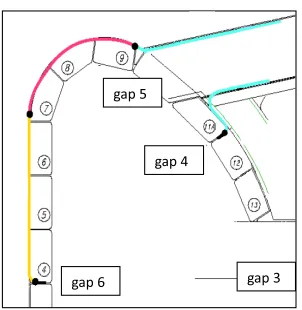
de-Fig. 2 Poloidal allocation of the ITER plasma position reflec-tometers. The waveguide path for gaps 4 and 6, running along the upper port-plug and behind the blanket mod-ules, is also indicated.
veloped to measure density profiles, plasma instabilities, turbulence and flows [53]. To meet the ITER measure-ment requiremeasure-ments, covering from the plasma edge to the core and taking into account the referred limitations both, LFS as well as HFS reflectometers are needed. Probing frequencies from 15 to 180 GHz will be used both in X-mode and in O-X-mode, to cover a broad range of densi-ties, from 5×10¹⁸ to 3 ×10²⁰m−3. HFS and LFS re-flectometry systems are intended to measure the electron density profile from the plasma core to the edge. In ad-dition, they are expected to provide information on MHD modes, disruption precursors, high frequency instabilities, Edge Localized Modes (ELMs) and L-H mode transition. Information on plasma turbulence and radial electric field should be provided by the LFS system. Besides, reflectom-etry will be used for plasma position control in long pulse operation as an alternative approach to the magnetic sys-tems. The plasma position reflectometer diagnostic is in-tended to measure the distance between the plasma column and the first wall by measuring the electron density profile in the scrape-off-layer up to the separatrix, at four diff er-ent poloidal locations shown in Fig. 2. These four reflec-tometers work in the O-mode polarization in the frequency range from 15 to 60 GHz and are distributed poloidally, from the LFS up to the HFS both in the equatorial plane (gaps 3 and 6), with two other reflectometers at intermedi-ate positions (gaps 4 and 5).
3.2
Radiation heating influence on the
diag-nostic front end design
Reflectometry systems working in future devices will face some difficulties linked to the intense neutron- andγ -radiation. This imposes a careful design of the reflectome-ter front-end to keep radiation and thermal and mechanical stresses at acceptable levels, and also to allow maintenance by remote handling.
In W7-X, the first plasma facing element of the
reflec-Fig. 3 Design proposed for ITER plasma position reflectome-ter gap 4 and gap 6 antennas. The antennas are located in the toroidal gap between two adjacent blanket mod-ules: BM11 and BM12 for gap 4 & BM4 and BM3 for gap 6. Electric insulators and support structures to the vacuum vessel and to the upper blanket module are indi-cated. Adapted from [59].
tometer will be a metallic mirror [58]. The mirror must cope with a high radiation heat-load which requires ac-tive cooling, adding complexity to the front-end design and construction.
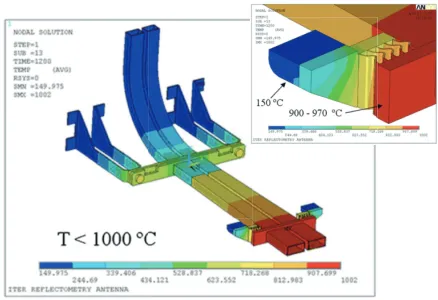
Fig. 4 Maximum temperature distribution calculated taking into account the thermal and nuclear loads at the ITER plasma position reflectometer gap 6 antennas for a pulse length of 1200 s. The higher values, kept below 1000◦ C, are acceptable due to the high temperature melting point of tungsten. Adapted from [59].
the scrape-off-layer up to the separatrix, are not suitable for the HFS reflectometer as higher gain antennas have to be used to access the core plasma region. To cope with the restrictions of limited space between blanket modules and low level of received signal, a high toroidal gain an-tenna system has been proposed which combine emitting horn and receiving mirror. An antenna system prototype was made and successfully tested at the HFS reflectometry mock-up at RRC Kurchatov Institute [60]. Heat load sim-ulations are under way as well as an optimization of the antenna design to cover a wider range of antenna-plasma cut-off distances. In both cases, plasma position gaps 4 and 6 and HFS reflectometers, the limited space between the blanket modules does not allow tilting the antennas to be aligned to the magnetic filed. As a consequence, a frac-tion of undesired polarizafrac-tion mode will be launched to the plasma. O-mode fraction can come back after reflection in the plasma when working in X-mode (HFS reflectometer) appearing in the measured signal as a parasitic component, and although X-mode fraction when working in O-mode will not be reflected by the plasma the related losses can be significant. A further difficulty on these systems relates to the waveguides and antennas maintenance. Long and bended waveguides have to be installed attached to the vac-uum vessel during the machine assemblage with no pos-sibility for maintenance or replacement during the whole ITER operation period. As for the antennas, replacement will be possible but due to the possible high activation it has to be done by remote handling and from the inner side of the vacuum vessel.
LFS reflectometer front-end will be allocated within an ITER equatorial port-plug. Similarly, gap 3 and gap 5 front-ends will be installed in an equatorial and upper port-plug, respectively. Although much less restrictive, the space available within the port-plugs limits the number of
antennas and their placement. The design and configura-tion of these antennas is presently under discussion to en-sure that the meaen-surements requirements are met. Being allocated within a port-plug, the maintenance or replace-ment of waveguides and antennas is possible although quires remote handling manipulation. The first LFS re-flectometer aim is to measure the electron density profile across the plasma edge region, but is also intended to mea-sure ELMs, plasma instabilities -MHD and high-frequency Alfven modes-, plasma turbulence and radial electric field. A careful design of the front-end, using different antenna gains and line-of-sights is important for a successful oper-ation of the reflectometers in all plasma scenarios. The an-tenna configuration options for the ITER LFS reflectome-ter are discussed in [61]. Currently, twelve waveguide-antenna systems are considered, two of them devoted to Doppler measurements. Steerable antennas or mirrors are not foreseen precluding turbulence wave-number spectrum measurements. Nevertheless, fixed tilt angle Doppler sys-tems allow the measurement of turbulence and radial elec-tric field simultaneously and with good spatio-temporal resolution, enabling the study of the turbulence-flow in-teraction proccess.
under conditions withP(ECRH)=30 kW/m2for 30 min in the test-chamber [58, 65, 66].
3.3
Real time monitoring and control
Present experiments usually evaluate the data recorded by the different diagnostics after the discharge; data collection typically takes a few minutes until data are available for the analysis. However, in long pulse experiments, data analysis must be possible during the discharge for monitoring purposes or even for active plasma control. Automated data monitoring and analysis is essential as manual analysis of the huge data sets is not feasible. A further challenge is the data acquisition at high sample rates needed for profile, turbulence and rotation measurements FPGA-based online processing system al-lowing the process of several signal in parallel may offer a good solution [67]. Real time monitoring requires reliable and steady state capable diagnostics. In W7-X [52], it is foreseen to get a suitable equilibrium reconstruction by function parametrization routines every 100 ms. Con-sequently the magnetic diagnostic and the temperature and density profile diagnostics should permanently run at a sufficiently high repetition rate. The ITER time resolution requirement for density profile measurements is 10 ms [53]. Although present-day reflectometers achieve much better time resolution, some of the abovementioned limitations of the ITER reflectometers may hinder that good performance. For example, operation using HFS X-mode lower cut-offto measure the core density profile is yet to be demonstrated. Also the performance of the long waveguide runs inside the vacuum vessel could be an issue for both HFS and plasma position reflectometers. Moreover, the automatic evaluation of the density profile in all relevant plasma scenarios is not an easy task due to the harmful effect of plasma instabilities and turbulence on the reflectometry signals, and due to the presence of parasitic reflections and/or multi-reflection processes in the plasma. Secondary reflections in the plasma may limit the performance of the ITER plasma position and HFS reflectometers due to the small distance between the plasma and the blanket modules. Also, the O-mode parasitic reflection has to be separated from the main X-mode reflected signal of the HFS reflectometry system. As for the hardware developments, a continuos effort on signal processing has been done during the last twenty years. For a review of signal processing techniques for density profile reconstruction using FM-CW reflectometry see [68]. Recently, new signal processing techniques are proposed that allow an automated evaluation of the density profile: by removing automatically measurements performed during density profile gradient collapse and recovery phases of the ELMs [69] and by identifying the relevant plasma reflection and isolating it from the parasitic and multiple reflections [70]. These advances are essential for real time plasma monitoring and control.
As already pointed out, reflectometry will be used in
ITER for plasma position control in long pulse operation as an alternative approach to the magnetic systems. Re-flectometry has not been applied to plasma position con-trol so far as this is done in present-day devices by mag-netic diagnostics. The plasma position measurement and control by reflectometry is presently being demonstrated in the AUG tokamak [71]. Recent results have shown that reflectometry density profiles and an estimate for the den-sity at the separatrix can be jointly used to track the sepa-ratrix position within the precision required for the plasma position control on ITER. Besides, the method developed to reject information polluted by the ELMs has shown to be an important development for plasma position feedback control operation [69]. Very recently, it has been success-fully demonstrated the capability to switch from magnetic to reflectometry plasma position control during the plasma discharge, both during L- and H-modes and also during the L-H transition. Reflectometry measurements provided the position of the plasma separatrix in real time at a rate of 1 ms and with an accuracy of better than 1 cm. In all cases, even with large ELMs and also during programed plasma radial movement, a good plasma position control was kept [72].
4. Summary and Conclusions
Microwave reflectometry is presently used in almost all fusion devices and its use is also foreseen for future devices like W7-X and ITER. Due to the outstanding ad-vances achieved during the last years, this technique al-lows measuring electron density profiles, plasma instabili-ties, plasma turbulence and radial electric field with excel-lent spatial and temporal resolution. The extrapolation of present day systems to future devices is possible but, in or-der to achieve a good diagnostic performance, special care must be taken in the diagnostic front-end design and con-struction. The main limitations are related to relativistic effects, intense neutron- andγ-radiation and long pulse or steady-state operation.
Relativistic effects modify plasma resonances and cut-offfrequencies to an extent that limit the plasma core ac-cessibility from the LFS probing the X-mode upper cut-off; HFS systems probing the X-mode lower cut-offhave to be used what adds further complexity to the reflectometer front-end design. Moreover, due to the relativistic mod-ification of plasma cut-offfrequencies, the knowledge of electron temperature profile becomes essential to deter-mine the density profile from the reflectometer data or to radially localized fixed frequency reflectometry measure-ments.
en-vironment. Several designs are under study for the diff er-ent ITER reflectometry systems.
In ITER, reflectometry will be used for plasma po-sition control as an alternative approach to the magnetic systems in long pulse operation. Very recently, this new application of reflectometry has been successfully demon-strated in AUG for the first time. High sample rate data acquisition systems and automate data analysis algorithms are being developed for real time plasma monitoring and plasma control in future steady-state devices.
Acknowledgments
The authors would like to acknowledge the support from the Heliotron-J and TJ-II teams and the contribution of the CEA and IST Reflectometry teams, in particular J. Santos and F. Clairet.
[1] E. Mazzucato, Rev. Sci. Instrum.69, 2201 (1998). [2] http://www.aug.ipp.mpg.de/IRW/
[3] Special Issue on Reflectometry, Nucl. Fusion46(2006). [4] C. Laviron, A.J.H. Donn´e, M.E. Manso and J. Sanchez,
Plasma Phys. Control. Fusion38, 905 (1996).
[5] V.A. Vershkov and V.A. Zhuravlev, Sov. Phys. Tech. Phys. 32, 523 (1987).
[6] E. de la Lunaet al., Rev. Sci. Instrum.66, 403 (1995). [7] M. Hirsch, H.-J. Hartfuss, T. Geist and E. de la Luna, Rev.
Sci. Instrum.67, 1807 (1996).
[8] T. Estradaet al., Plasma Phys. Control. Fusion43, 1535 (2001).
[9] K. Mukaiet al., Contrib. Plasma Phys.50, 646 (2010). [10] C.A.J. Hugenholtz and H. Heijnen, Rev. Sci. Instrum.62,
1100 (1990).
[11] J.C. Gorkon, M.J. van de Pol and A.J.H. Donne, Rev. Sci. Instrum.72, 336 (2001).
[12] Y. Kogiet al., Rev. Sci. Instrum.74, 1510 (2003). [13] T. Tokuzawa, K. Kawahata, K. Tanaka and the LHD
Exper-imental Group, Nucl. Fusion46, S670 (2006).
[14] F. Clairet, C. Bottereau, J.M. Chareau and R. Sabot, Rev. Sci. Instrum.74, 1481 (2003).
[15] G. Wanget al., Rev. Sci. Instrum.74, 1525 (2003). [16] S. Kubota, W.A. Peebles, X.V. Nguyen and L. Roquemore,
Rev. Sci. Instrum.74, 1477 (2003).
[17] A. Silva, M.E. Manso, P. Varela and L. Meneses, Rev. Sci. Instrum.77, 10E932 (2006).
[18] F. Clairetet al., Rev. Sci. Instrum.81, 10D903 (2010). [19] L. Meneses, L. Cupido and M.E. Manso, Rev. Sci. Instrum.
81, 10D924 (2010).
[20] K.H. Burrellet al., Plasma Phys. Control. Fusion34, 1859 (1992).
[21] G.D. Conwayet al., Phys. Rev. Lett.84, 1463 (2000). [22] N. Oyama and K. Shinohara, Rev. Sci. Instrum.73, 1169
(2002).
[23] R. Sabot et al., Plasma Phys. Control. Fusion48, B421 (2006).
[24] L.F. Ruchkoet al., Rev. Sci. Instrum.75, 655 (2004). [25] S. Hacquinet al., Plasma Phys. Control. Fusion49, 1371
(2007).
[26] L. Cupido, J. S´anchez and T. Estrada, Rev. Sci. Instrum.75, 3865 (2004).
[27] A. Kr¨amer-Fleckenet al., Nucl. Fusion46, S730 (2006). [28] V. Vershkovet al., Nucl. Fusion45, S203 (2005).
[29] A. Kr¨amer-Flecken, S. Soldatov, H.R. Koslowski and O. Zimmermann, Phys. Rev. Lett.97, 045006 (2006). [30] Y. Lin, R. Nazikian, J.H. Irby and E.S. Marmar, Plasma
Phys. Control. Fusion43, L1 (2001).
[31] E. Blancoet al., Rev. Sci. Instrum.75, 3822 (2004). [32] F. da Silva, S. Heuraux, S. Hacquin and M.E. Manso, Rev.
Sci. Instrum.75, 1497 (2004).
[33] https://www.aug.ipp.mpg.de/aug/ERCC/ [34] E. Mazzucato, Nucl. Fusion41, 203 (2001).
[35] B. Tobiaset al., Plasma Fusion Res.6, 2106042 (2011). [36] http://www.igi.cnr.it/irw10/
[37] M. Hirschet al., Plasma Phys. Control. Fusion43, 1641 (2001).
[38] P. Hennequinet al., Rev. Sci. Instrum.75, 3881 (2004). [39] G.D. Conwayet al., Plasma Phys. Control. Fusion46, 951
(2004).
[40] T. Happelet al., Rev. Sci. Instrum.80, 073502 (2009). [41] E. Blanco and T. Estrada, Plasma Phys. Control. Fusion50,
095011 (2008).
[42] C. Lechte, IEEE Trans. Plasma Sci.37, 1099 (2009). [43] E. Blanco, T. Estrada and J. S´anchez, Plasma Phys. Control.
Fusion48, 699 (2006).
[44] T. Happel, E. Blanco and T. Estrada, Rev. Sci. Instrum.81, 10D901 (2010).
[45] L. Vermareet al., Phys. Plasmas18, 012306 (2011). [46] T. Happelet al., Phys. Plasmas18, 102302 (2011). [47] T. Estradaet al., Plasma Phys. Control. Fusion51, 124015
(2009).
[48] T. Estrada et al., EPL (Europhysics Letters) 92, 35001 (2010).
[49] T. Estrada, C. Hidalgo, T. Happel and P.H. Diamond, Phys. Rev. Lett.107, 245004 (2011).
[50] G.D. Conwayet al., Phys. Rev. Lett.106, 065001 (2011). [51] L. Schmitzet al.,Shear Flow and Turbulence Suppression
in Limit Cycle Oscillations Preceding the L-H Transition (Transport Task Force Workshop, San Diego, California, 2011).
[52] H.J. Hartfuss, R. K¨onig and A. Werner, Plasma Phys. Con-trol. Fusion48, R83 (2006).
[53] G. Vayakiset al., Nucl. Fusion46, S836 (2006).
[54] H. Bindslev, Plasma Phys. Control. Fusion34, 1601 (1992). [55] H. Bindslev, Plasma Phys. Control. Fusion35, 1093 (1993). [56] V. Tribaldos, J.A. Jim´enez, J. Guasp and B.P. van Milligen,
Plasma Phys. Control. Fusion40, 2113 (1998). [57] G. Krameret al., Nucl. Fusion46, S846 (2006).
[58] M. Hirsch, E. Holzhauer and H.-J. Hartfuss, Nucl. Fusion 46, S853 (2006).
[59] G. Perez, T. Estrada, G. Vayakis and C. Walker, Fusion Eng. Des.84, 1488 (2009).
[60] V.A. Vershkov, Development of the HFS ITER reflectom-etry, 9th International Reflectometry Workshop (IRW9), 2009.
[61] G.D. Conway, G.R. Hanson, W.A. Peebles and A. Stegmeir, Antenna configuration options for the ITER low-field-side LFS reflectometer. ITER D 35AHBB, 2011. [62] G.D. Conwayet al., Stray radiation protection of ITER
mi-crowave based diagnostics. ITER D 33PKHG, 2011. [63] V. Furtulaet al., Rev. Sci. Instrum.81, 10D913 (2010). [64] J.R. Montejo-Garai, J.A. Ruiz-Cruz, J.M. Rebollar and T.
Estrada, IEEE Microwave and Wireless Components Lett. 21, 209 (2011).
[65] R. K¨oniget al., Rev. Sci. Instrum.81, 10E133 (2010). [66] M. Hirsch,Diagnostic and other in-vessel components in
steady-state discharges(21st International Toki Conference, Toki, Japan, 2011).
[67] L. Estebanet al., IEEE Trans. Nucl. Sci.58, 1562 (2011). [68] P. Varelaet al., Nucl. Fusion46, S693 (2006).
[69] J. Santos, L. Guimarais and M.E. Manso, Rev. Sci. Instrum.
81, 10D926 (2010).
[70] F. Clairetet al., Rev. Sci. Instrum.82, 083502 (2011). [71] J. Santos, M.E. Manso, P. Varela and J. Neuhauser, Rev.
Sci. Instrum.74, 1489 (2003).