*Corresponding author: zarinaa@uthm.edu.my
2017 UTHM Publisher. All right reserved. penerbit.uthm.edu.my/ojs/index.php/jst
Rainfall Characteristics of Johor Bahru and Kota Bharu, Malaysia
Zarina Md Ali*, Lai Wai Tan, Ira Masyra Daud and Noor Aliza Ahmad
Faculty of Civil and Environmental Engineering, Universiti Tun Hussein Onn Malaysia, 86400 Parit Raja, Johor
Received 30 September 2017; accepted 30 November 2017; available online 28 December 2017
1. Introduction
Flash flood is rapid flooding of geomorphic low-lying areas. Flash flood can be caused by heavy rain pouring on saturated soil or dry soil that has poor absorption ability or on impermeable area. Flash flood is common occurrence in urban areas including Johor Bahru [1], Batu Pahat [2], Kuala Lumpur [3], Butterworth [4], and Kota Bharu [5].
Malaysia climate is characterised by monsoonal sunny and rainy days throughout the year with an average annual rainfall and temperature of 250 cm and 27°C, respectively. However, global warming that leads to variability in weather conditions has affected characteristics and trends of rain. An example of such climate variability is the extreme rain event that has caused severe flooding of Kuantan in 2004 [6].
Hence, the variability of climatic variables such as rain should be studied for better severe weather impact preparedness. Statistical studies on rain characteristics involves the application of Mann-Kendall, moving average, and linear regression, among other methods [7-11].
Throughout the year, Malaysia was influenced by two monsoons, i.e. the south-west monsoon (from May to September) and north-east monsoon (from November to March) [12-13]. Effect of the monsoons and their
inter-monsoons on rainfall distributions are discussed in the paper.
The goal of study is to obtain the characteristics and trends of rainfall at two cities in Peninsular Malaysia, i.e. Johor Bahru and Kota Bharu. Kota Bahru, located on the east coast receives heavy rain during the north-east monsoon. Meanwhile, Johor Bahru which is situated on the west coast of Peninsular Malaysia is affected by the south-west monsoon.
Records of 13-year rainfall observed at the respective rain-gauge stations in the two cities are used in the statistical analysis.
2. Material and Method
Rainfall record
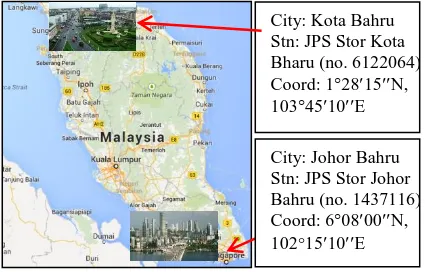
Rainfall depth observation from two rain-gauge stations, no. 1437116 JPS Stor Johor Bahru station and no. 6122064 JPS Stor Kota Bharu station were used in the study (Fig. 1).
The characteristics of 13-year daily rainfall record (between 2004 and 2016) from both stations are discussed. These rain-gauge stations are maintained by the Department of Drainage and Irrigation (DID), Malaysia. At these stations, rainfall depth is recorded with automatic data logger.
Abstract: Characteristics of rainfall was influenced by climate variability. Occurrence of extreme events due to climate variability may lead to flash floods or monsoonal flooding. This paper discusses on characteristics and trend of monthly and annual rainfall at Johor Bahru and Kota Bharu. Daily rainfall observations at the stations that spans over 13 years, i.e. from year 2004 to year 2016 was used. Minimum and maximum total annual rainfall recorded at Johor Bahru and Kota Bharu are 1708.0 mm and 3455.5 mm, and 1036.3 mm and 3037.0 mm, respectively. Mann-Kendall test has showed that the monthly and annual rainfall trends at both stations are insignificant. Longer period of rainfall observations should be considered to obtain more significant trends. The longest dry and wet days within a month observed over the 13-year rainfall are 26 days and 17 days at Johor Bahru, and 29 days and 25 days at Kota Bharu. Both Johor Bahru and Kota Bharu receives higher rain during the beginning of north-east monsoon, i.e. in November and December.
78
Fig. 1 Location of rain-gauge stations
Data treatment
Incomplete rainfall record is common due to equipment malfunctions and loss of recording, among others. Considering observations from three neighbouring rainfall stations, the normal ratio method has been used to treat a total of three months (1.9%) of incomplete rainfall observations for Kota Bharu station.
Characteristics of rainfall events
The rainfall records are found to be homogeneous after Pettitt test at α = 0.05. Characteristics and trends of annual and monthly rainfall were discussed based on Mann-Kendall and Sen’s slope methods.
The effect of monsoons is examined in terms of average monthly rainfall, categorized as (i) Cluster 1: north-east monsoon; (ii) Cluster 2: south-west monsoon; (iii) Cluster 3: monsoon in April; and (iv) Cluster 4: inter-monsoon in October. Further, period of dry and wet days is also determined. It is a wet day if mean daily precipitation P > 0.5 mm.
Mann-Kendall test
Man-Kendall test has been widely used to determine rainfall trend, i.e. monsoonal rainfall in Kerala, India [14], daily and monthly rainfall concentration in southern Italy [15], and climate variability in the arid and semi-arid environments of Iran [16], to name a few.
A non-parametric trend test has first been proposed by [17], further studied by [18] and improved by [19] to include for seasonality effect.
The null hypothesis H0 for these tests is that
there is no trend in the series. Three alternative hypotheses are that there is a negative, non-null, or positive trend of rainfall.
The Mann-Kendall test is based on the calculation of . Kendall’s 1 < < 1 is a measure of association between two samples, which ranks itself with the samples. Mann-Kendall statistics S is
1 1 1 Sign n i n i j i j P P S (1) where, Pi and Pj are the sequential rainfalldepths in a sample of n-size, and
0 if 1 0 if 0 0 if 1 Sign i j i j i j i j P P P P P P PP (2)
For n ≥ 8, statistics S is approximately normally distributed, with mean E(S) = 0 and variance V(S) of
18 5 2 1 5 2 1 1
g m m m mt t t n n n S V (3)where, tm denotes number of tied groups to extent of m. The statistical test ZS is given as
0 if 1 0 if 0 0 if 1 S S V S S S S V SZS (4)
A positive value of S indicates an increasing trend, and vice versa. The trend is significant if ZS is greater than the standard normal variate
2
Z at significance α = 5%.
3. Characteristics and Trend Analysis
Annual rainfall
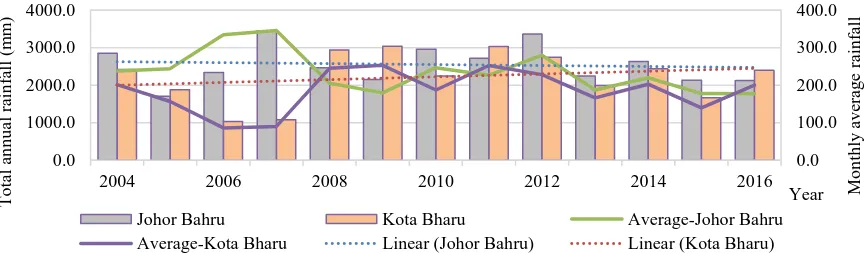
Fig. 2 shows total annual and monthly average rainfall distribution between 2004 and 2016. Minimum and maximum annual rainfall observed are 1708.0 (in 2005) mm and 3455.5 mm (in 2007) at Johor Bahru, and 1036.3 mm (in 2006) and 3037.0 mm (2009) at Kota Bharu. Both Johor Bahru and Kota Bharu cities are prone to flash floods.
Monthly average rainfall varies between 166.5 mm (in 2013) and 345.6 mm (in 2007) at Johor Bahru. Meanwhile, monthly average rainfall at Kota Bharu ranges fluctuates between 86.4 mm (2006) and 253.1 mm (2009). Highest difference in total annual rainfall and monthly average rainfall between the two
City: Kota Bahru Stn: JPS Stor Kota Bharu (no. 6122064) Coord: 12815N, 1034510E
79 stations occurs in 2007, followed by 2006. In
the end of 2006 and early 2007, Johor Bahru has been hit by major floods.
Fig. 2 Distribution of annual rainfall and monthly average rainfall of Johor Bahru and Kota Bharu between 2004 and 2016
Table 1 shows descriptive statistics of annual rainfall for Johor Bahru and Kota Bharu. Standard deviation and variation shows annual rainfall of Kota Bharu spread out more widely than Johor Bahru. Meanwhile, skewness of annual rainfall shows the asymmetrical distribution of both stations. Kurtosis indicated that annual rainfall at both stations has a flat and wide distribution.
Table 1 Descriptive statistics of annual rainfall for Johor Bahru and Kota Bharu.
Parameter Station
Johor Bahru Kota Bharu Median P50 (mm) 2404.0 2323.5
Mean P(mm) 2525.6 2208.9 Std deviation (mm) 525.54 698.25 Coef. of variation Cv 0.199 0.303 Pearson skewnessCs 0.480 0.432 Pearson kurtosis Ck 0.658 0.953
The trend analyses for both stations are shown in Table 2. Mann-Kendall does not show distinctive trend of annual rainfall (p > α) for both cities. Nevertheless, annual rainfall observed at Johor Bahru has a negative correlation during the period, which shows that there is a decreasing trend in annual rainfall, in contrast with Kota Bharu.
Table 2 Trend analysis of annual rainfall for Johor Bahru and Kota Bharu (α = 0.05)
Mann-Kendall Johor Bahru Kota Bharu Kendall’s 0.121 0.091
p-value 0.638 0.737
Sen’s slope 15.99 38.05
R2 0.109 0.155
Monthly rainfall
Fig. 3 shows distribution of total monthly rainfall for Johor Bahru and Kota Bharu. The total monthly rainfall varies from 0.5 mm to 914.0 mm (December 2006) for Johor Bahru and 1072.5 mm (December 2012) for Kota Bharu. Kota Bharu and Johor Bahru receive high total monthly rainfall mostly in November and December.
Table 3 shows descriptive statistics on monthly rainfall for Johor Bahru and Kota Bharu.
Table 3 Descriptive statistics of total monthly rainfall for Johor Bahru and Kota Bharu
Parameter Station
Johor Bahru Kota Bharu Median P50 (mm) 206.0 130.0
Mean P(mm) 230.0 185.8 Std deviation (mm) 136.5 188.2 Coef. of variation Cv 0.591 1.069 Pearson skewnessCs 1.218 2.145 Pearson kurtosis Ck 3.147 5.306
0.0 100.0 200.0 300.0 400.0
0.0 1000.0 2000.0 3000.0 4000.0
2004 2006 2008 2010 2012 2014 2016 Mo
n
th
ly
a
v
era
g
e
ra
in
fa
ll
T
o
tal
an
n
u
al
ra
in
fa
ll
(m
m
)
80
Fig. 3 Total monthly rainfall observed from year 2004 to 2016 at Johor Bahru and Kota Bharu Skewness of total monthly rainfall depth
shows that its distribution is positively skewed. Meanwhile, the kurtosis indicated that both stations have rainfall distribution with sharp peak.
Mann-Kendall test (Table 4) shows that an insignificant trend exists for monthly rainfall observed at Johor Bahru, with p < α. There is a negative correlation in total monthly rainfall observed at Johor Bahru, which reflects decreasing trends.
Table 4 Trend analysis of total monthly rainfall (α = 0.05, autocorrelation = Hamed & Rao method [19])
Rainfall station Johor Bahru Kota Bharu Mann-Kendall method
Kendall’s 0.108 0.057
p-value 0.046 0.293
Sen’s slope 0.45 0.227 Seasonal Mann-Kendall test
Kendall’s 0.120 0.019
p-value 0.063 0.782
R2 0.03 0.008
Meanwhile, total monthly rainfall trends observed for Kota Bharu begs to differ. The
trends exhibited for total monthly rainfall is similar to the trends of total annual rainfall for both stations. The very small value of R2 shows
there is no consistent trend of total monthly rainfall for both stations. Further, the seasonal Mann-Kendall also found that there is no trend for both stations with p > α.
Seasonal rainfall
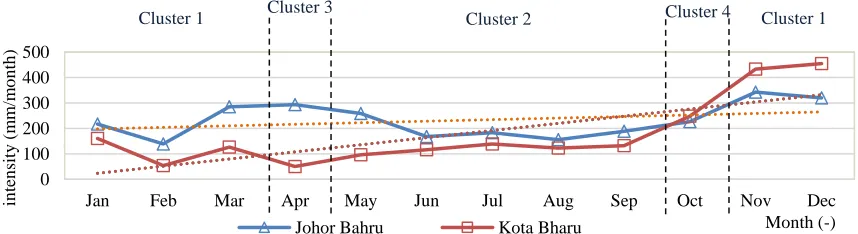
Fig. 4 shows monthly rainfall intensity over period of 13 years of four monsoons.
Cluster 1
North-east monsoon is dominated by north-east winds that blow over South China Sea at 10 to 30 knots between November and March [13]. Rainfall intensity is observed to range from 50 mm/month to 300 mm/month from January to March. Higher rainfall of more than 300 mm/month is observed in the months of November and December. According to [20,21], Johor has been hit by a series of storm events that caused floods in December 2006 and January 2007 [3] reported that in Kota Bahru, 1,000 residents have to be transferred to higher grounds due to floods. In November 2009, floods also affected Tumpat, Pasir Mas and Jeli.
Fig. 4 Monthly rainfall intensity of Cluster 1 (north-east monsoon), Cluster 2 (south-west monsoon), Cluster 3 (inter-monsoon 1) and Cluster 4 (inter-monsoon 2) over 2004 to 2016 observed at Johor Bahru and Kota Bharu.
R² = 0.0097 0
400 800 1200
Jan-2004 Sep-2005 May-2007 Jan-2009 Sep-2010 May-2012 Jan-2014 Sep-2015
M
o
n
th
ly
ra
in
fa
ll
(m
m
)
Year Johor Bahru Kota Bharu
0 100 200 300 400 500
Jan Feb Mar Apr May Jun Jul Aug Sep Oct Nov Dec
M
o
n
th
ly
ra
in
fa
ll
in
ten
sity
(m
m
/m
o
n
th
)
Month (-) Johor Bahru Kota Bharu
81 Cluster 2
The south-west monsoon is influenced by south-west winds that blows at speed less than 15 knots between May and September [13]. The average rainfall ranged between 100 mm/month to 200 mm/month except in May (Johor Bahru). Although intensity of rain is not as high as in November and December, flash flood still occurs in Johor Bahru [22].
Clusters 3 and 4
During inter-monsoons (October), average rainfall is approximately 230 mm/month for both stations. However, in April, there is a difference of as much as 250 mm/month of rainfall between these stations.
Generally, Johor Bahru received higher rainfall concentration ranging from 38.5 mm to 500 mm within the 13 years compared to Kota Bharu.
Dry and wet days
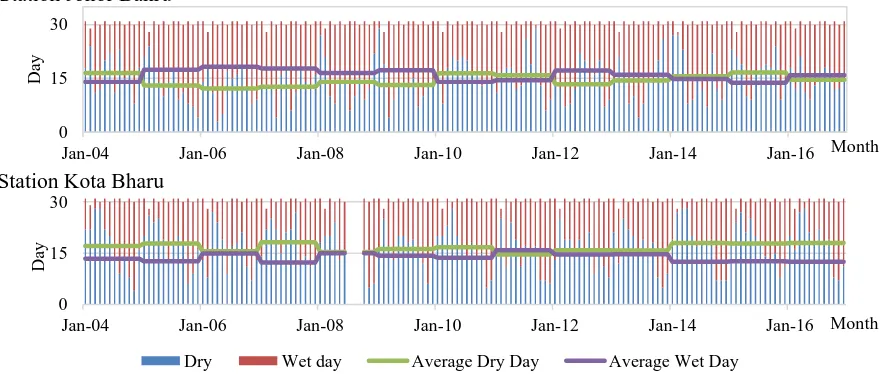
Total number of dry and wet days within each month is shown in Fig. 5. For Kota Bharu, the incomplete rainfall of July, August and September 2008 is shown as a gap of the record. During the 13-year period, there are 52% of wet days in Johor Bahru and 45% of wet days in Kota Bharu. In average, the number of dry and wet days are between 12 and 18 days monthly for both stations.
Fig. 5 Total dry and wet days within a month at Johor Bahru and Kota Bharu for year 2004 to 2016 Fig. 6 shows the frequency and probability of
wet and dry days for both stations. Johor Bahru and Kota Bharu recorded highest frequency of 1-day wet period with probability of 0.41 and 0.38, respectively. Highest count of dry days is recorded in February for both stations, while most number of wet days for Kota Bharu and Johor Bahru appeared in November and April, respectively.
For Johor Bahru, longest period of dry and wet days in a month is 26 days and 17 days,
respectively. However, 3-day successive period of dry and wet days have achieved probability of more than 0.1. Meanwhile, longest period of dry and wet days in a month for Kota Bharu is 29 days and 25 days, respectively. The probability of having 4-days of wet period is 0.13.
Higher number of wet days was found to occur during the north-east monsoon with 44.4% at Kota Bharu and 41.6% at Johor Bahru.
0 15 30
Jan-04 Jan-06 Jan-08 Jan-10 Jan-12 Jan-14 Jan-16
Da
y
Month
Station Johor Bahru
0 15 30
Jan-04 Jan-06 Jan-08 Jan-10 Jan-12 Jan-14 Jan-16
Da
y
Month
Station Kota Bharu
82
Fig. 6 Number of dry and wet days and its probability from year 2004 to 2016 at (a) Johor Bahru, and (b) Kota Bahru
4. Conclusion
Annual and monthly rainfall characteristics of 2004 to 2016 record were analysed for Johor Bahru and Kota Bharu. In December 2006 alone, Johor received a total of 914.0 mm rain. Meanwhile, in December 2012, Kota Bharu received a total of 1072.5 mm of rainfall.
Based on Mann-Kendall test, no obvious trend is shown in rainfall distribution at both stations. Longer rainfall observation is required to establish significant trend.
Successive period of dry and wet days which achieved probability of more than 0.1 are 3 days and 4 days for Johor Bahru and Kota Bharu, respectively.
Acknowledgement
The authors would like to thank Universiti of Tun Hussein Onn Malaysia for any financial support provided, and the Department of Irrigation and Drainage for providing the rainfall data.
References
[1] Mohamed, Z. (2017). “Banjir Kilat di Beberapa Kawasan di Johor Bahru” in Berita Harian Online, May 31, 2017. https://www.bharian.com.my/node/2884 38. Retrieved on Sept 30, 2017
[2] BERNAMA (2017). “Banjir kilat di Batu Pahat, 43 Mangsa Dipindah” in Sinar Online, June 27, 2017. http://www.sinar harian.com.my/edisi/johor/banjir-kilat-di-batu-pahat-43-mangsa-dipindah-1.69 4488. Retrieved on Sept 30, 2017. [3] Baharuddin, N. H. (2017). “Beberapa
Kawasan di KL Terjejas Banjir Kilat” in Utusan Online, Mar 19, 2017. http:// www.utusan.com.my/berita/wilayah/beb
erapa-kawasan-di-kl-terjejas-banjir-kilat -1.459051. Retrieved on Sept 30, 2017. [4] Unknown (2017). “Pulau Pinang Dilanda
Banjir Kilat Lagi” in Utusan Online, Sep 15, 2017. http://www.utusan.com.my/be rita/wilayah/pulau-pinang/pulaupinang-dilanda-banjir-kilat-lagi-1.526819. Retri eved on 30 Sept, 2017.
[5] Abd Mutalib, M. H. (2017). “Banjir Kilat Landa Kota Bharu, Lebih 1,000 Dipindahkan” in Utusan Online, Jan 21, 2017. http://www.utusan.com.my/berita/ nahas-bencana/banjir-kilat-landa-kota- bharu-lebih-1-000-dipindahkan-1.43421 9. Retrieved on 30 Sept, 2017.
[6] Juneng, L., Tangang, F. T. & Reason, C. J. C. (2007). “Numerical Case Study of an Extreme Rainfall Event During 9-11 December 2004 over the East Coast of Peninsular Malaysia” in Meteorology and Atmospheric Physics, 98(1-2), pp. 81-98.
[7] Ahammed, F., Hewa, G. A. & Argue, J. R. (2014). “Variability of Annual Daily Maximum Rainfall of Dhaka, Bangladesh” in Atmospheric Research, 137, pp. 176-182.
[8] Nair, A., Joseph, K.A. & Nair, K.S. (2014). “Spatio-temporal Analysis of Rainfall Trends over a Maritime State (Kerala) of India During The Last 100 Years” in Atmospheric Environment 88 (2014), pp. 123-132.
[9] Kampata, J. M., Parida, B. P. & Moalafhi, D. B. (2008). “Trend Analysis of Rainfall in the Headstreams of the Zambezi River Basin in Zambia” in Physics and Chemistry of the Earth, 33, pp. 621-625.
[10] Hess, T.M., Stephens, W. & Maryah, U.M. (1994). “Rainfall Trends in the North East Arid Zone of Nigeria” in
0.00 0.50
0 200 400
1 11 21
P
ro
b
ab
il
it
y
Nu
m
b
er
o
f
Da
y
Day
a. Station Johor Bahru
Dry Wet Prob_Dry Prob_Wet
0.00 0.20 0.40
0 120 240
1 11 21
P
ro
b
ab
il
it
y
N
u
m
b
er o
f
D
ay
Day
b. Station Kota Bharu
83 Agricultural and Forest Meteorology 74
(1995), pp. 87-97.
[11] Ahmed, A.O.C., Yasuda, H., Hattori, K. & Nagasawa, R. (2008). “Analysis of Rainfall Records (1923-2004) in Atar-Mauritania” in Geofizika, 25 (1), pp. 53-64.
[12] Tangang, F.T., Juneng, L., Salimun, E., Sei, K. M., Le, L. J., & Muhamad H. (2012). “Climate Change and Variability over Malaysia: Gap in Science and Research Information” in Sains Malaysiana, 41(11), pp. 1355-1366. [13] Malaysian Meterological Department
(2017). “Malaysia’s Climate” from http://www.met.gov.my/web/metmalays ia/climate/generalinformation/malaysia, retrieved on Oct 1, 2017.
[14] Krishnakumar, K. N., Prasada Rao, G. S. L. H. V. & Gopakumar, C. S. (2009). “Rainfall trends in Twentieth Century over Kerala, India” in Atmospheric Environment, 43(11), pp. 1940-1944. [15] Coscarelli, R. & Caloiero, T. (2012).
“Analysis of Daily and Monthly Rainfall Concentration in Southern Italy (Calabria Region)” in Journal of Hydrology, 416-417, pp. 145-156. [16] Modarres, R. & Silva, V. P R. (2007).
“Rainfall Trends in Arid and Semi-Arid Regions of Iran” in Journal of Arid Environments, 70, pp. 344-355.
[17] Hirsch, R.M., Slack, J.R. & Smith, R.A. (1982.) “Techniques of Trend Analysis for Monthly Water Quality Data” in Water Resources Research 18 (1) pp. 107-121.
[18] Mann, H.B. (1945). “Non-parametric tests against trend” in Econometrica 13 pp. 163-171.
[19] Kendall, M.G. (1975). “Rank Correlation Methods”, 4th ed. Charles Griffin, London.
[20] Akasah, Z. A., & Doraisamy, S. V. (2015). “2014 Malaysia Flood: Impacts & Factors Contributing Towards the Restoration Of Damages” in Journal of Scientific Research and Development 2, 2(14) pp. 53-59.
[21] Kent, J. (2006). “South Malaysia Flooding Kills Six” in BBC News, Dec 22, 2006.
http://news.bbc.co.uk/2/hi/asia-pacific/6203973.stm. Retrieved on Sept 30, 2017.
[22] Othman, A. (2015). “Johor Bahru Dilanda Banjir Kilat” in Sinar Online, Aug 1, 2015