Corresponding Author E-mail: seyedmehdisafavi@yahoo.com 1086 | Page http://www.ijabbr.com
Available online at
International journal of Advanced Biological and Biomedical Research
Volume 1, Issue 9, 2013: 1086-1093
Evaluation of drought tolerance in Safflower (Carthamus tinctorius L.)under Non
Stress and Drought Stress Conditions
Seyed Mehdi Safavi 1*, Seyyed Saeid Pourdad 2 , Seyed Afshin Safavi 3
1
Department of Agronomy and Plant Breeding, Kermanshah Branch, Islamic Azad University, Kermanshah, Iran
2
Dry-land Agricultural Research Institute (DARI), Kermanshah, Iran
3
Kermanshah agri-jahad organization, Kermanshah, Iran
ABSTRACT
This study was conducted to determine drought tolerance genotypes with superiority in different stressed environments. To screening quantitative indices of drought tolerance, genotypes of safflower (Carthamus tinctorius L.) were tested in a complete randomized block design with three replications under two different water regimes (irrigated and rainfed). Significant positive correlation was found between grain yield in the stress condition (Ys) with indicators stress tolerance index (STI), harmonic mean (HAR) and geometric mean productivity (GMP) indicating that these indices are suitable criteria for screening drought tolerant genotypes. No significant correlation was observed between Ys with tolerance index (TOL) and mean productivity (MP), hence they can be discarded as the desirable markers for identifying drought tolerant genotypes. Principal component analysis (PCA), indicated that the first and second components justified 98.45% of variations between the criteria. Screening drought tolerant genotypes using mean rank, standard deviation of ranks and biplot analysis, discriminated genotype G1 (44) as the most drought tolerant. In conclusion, The indices STI, GMP, MP and HAR genotype G1 (44) were identified as spring planting drought resistant genotype. This genotype had the highest grain yield under stress and non-stress conditions was also high performance.
Key words: Safflower genotypes, Stress tolerance index, Drought tolerance, Biplot
INTRODUCTION
1087 | Page al., 2001; Bassil and Kaffka, 2002a,b) and moderately tolerant to salinity. Some other research found safflower can be a candidate crop in dryland agroecosystems due to the potential for growth under water stress and the economic value in terms of both oil and seed (Yau, 2004; Kar et al., 2007); therefore this finding may be coming from the variability of safflower genotypes. In Iran water is a scarce resource due to the high variability of rainfall. The effects of water stress depend on the timing, duration and magnitude of the deficits (Pandey et al., 2001). Because of water deficit in most arid regions, resistance of crop plants against drought has always been of great importance and has taken into account as one of the breeding factors (Talebi, 2009). A long term drought stress effects on plant metabolic reactions associate with plant growth stage, water storage capacity of soil and physiological aspects of plant. Drought tolerance in crop plants is different from wild plants. In case crop plant that encounters with severe water deficit, they die or seriously lose yield while in wild plants, they survive under this conditions but yield losses is not taken into consideration (Khayatnezhad et al., 2010). Achieving a genetic increase in yield under these environments has been recognized to be a difficult challenge for plant breeders while progress in yield grain has been much higher in favorable environments (Richards et al., 2002). Thus, drought indices which provide a measure of drought based on yield loss under drought conditions in comparison to normal conditions have been used for screening drought tolerant genotypes (Mitra, 2001). To evaluate response of plant genotypes to drought stress, some selection indices based on a mathematical relation between stress and optimum conditions have been proposed (Clarke et al., 1992; Fernandez, 1992; Sio-Se Mardeh et al., 2006; Shirani Rad and Abbasian, 2011). Rosielle and Hamblin (1981) defined stress tolerance (TOL) as the differences in yield between the stress (Ys) and non-stress (Yp) environments and mean productivity (MP) as the average yield of Ys and Yp. Fischer and Maurer (1978) proposed a stress susceptibility index (SSI) of the cultivar. Fernandez (1992) defined a new advanced index (STI = stress tolerance index), which can be used to identify genotypes that produce high yield under both stress and non-stress conditions. Geometric mean productivity (GMP) and stress tolerance index (STI) (Fernandez, 1992) have been employed under various conditions. Fischer and Maurer (1978) explained that genotypes with an SSI of less than a unit are drought resistant, since their yield reduction in drought conditions is smaller than the mean yield reduction of all genotypes (Bruckner and Frohberg 1987). Other yield based estimates of drought resistance,are harmonic mean (HM) (Dehdari, 2003; Yousefi, 2004).
The present investigation was carried out for screening quantitative criteria of drought tolerance using safflower genotypes.
MATERIAL AND METHODS
This study was carried out with 15 genotypes based on Randomized Complete Blocks Design (RCBD) with three replications under two different environments (irrigated and rainfed) at the rain-fed research farm in Sararood station, Kermanshah, Iran, 2011-2012 cropping season. The Sararood research station is located in west of Iran (Latitude 34°20’North and Longitude 47°20’East) at an elevation of 1351 m, and receives an average of 472 mm of precipitation per year. The genotypes used in this study are given in Table 1. Drought tolerance indices were calculated based on grain yield per plot for stress (Ys), non-stress (Yp) and total mean of grain yield for stress ( s ) and non-stress ( p )conditions as follows:
1- Stress susceptibility index (SSI) (Fischer and Maurer, 1978):
P S P S Y Y SI SI Y Y
SSI
. 1
1
2- Tolerance (TOL) and mean productivity (MP) (Rosielle and Hambelen, 1981):
1088 | Page MP =
3- Stress tolerance index (STI) and geometric mean productivity (GMP) (Fernandes, 1992):
STI =
GMP=
Analysis of variance, mean comparison using Duncan,s multiple range test (DMRT), correlation analysis between mean of the characters measured were performed by MSTAT-C, SPSS ver. 16 and STATISTICA ver. 8.
RESULTS AND DISCUSSION
Resistance indices were calculated on the basis of grain yield of cultivars (Table 2). Selection based on a combination of indices may provide a more useful criterion for improving drought resistance of safflower but study of correlation coefficients is useful in finding the degree of overall linear association between any two attributes. Accordingly, high levels indicators STI, MP, GMP, YI and YSI values and low index of TOL and SSI indicator of resistance to stress conditions were figured. Fernandez (1992). To determine the most desirable drought resistance criteria, Spearman's rank correlation between yield under stress and non-stress conditions and indices of drought resistance were calculated (Table 3). The results indicated that TOL, MP, STI, SSI and GMP had a significant (P<0.01) positive correlation with yield under non-stress condition. The indices STI and HAR revealed a significant (P<0.01) positive correlation with yield
under stress condition, while SSI showed a significant (P<0.01) negative correlation. Some researchers
1089 | Page and GMP and the yield stress is close to vector. The first and second components of genotype was high in the area and are tolerant of drought and high performance in both conditions were. Genotype G6 (366/S6-697) The second component is the highest stress was located in the vicinity of the vector. The genotypes with the highest yield stress of genotype 44, respectively. On the other genotypes G3, G12, G11, G8 and G13 (respectively 376, Kurdestan Local, 27 - 41/1, PI-258417 and Sina) in the region of low-level components first and second and none were yield and drought resistance indices of the vectors are so close they were to susceptible genotypes. New figures Faraman (G14) adjacent vectors yield stress, tolerance index (TOL) and stress susceptibility index (SSI) have been exhausted and therefore as a potential high-stress conditions during the rainy sensitive Drought was identified. Three genotypes G9, G7, and G4 (respectively 27-N/825, 62 and 386) in the vector indices of stress tolerance and yield under both conditions were included in the average performance. The distribution of genotypes in the biplot indicates genetic diversity of cultivars under drought stress. Different indices showed that indices STI, GMP, MP and HAR have been better able to identify drought resistant genotypes and the correlations between these parameters and variables in the angle between the vectors in the biplot stress tolerance index (STI) as a suitable index for selecting drought tolerant genotypes were found in safflower.
CONCLUSION
In conclusion, The indices STI, GMP, MP and HAR genotype G1 (44) were identified as spring planting drought resistant genotype. This genotype had the highest grain yield under stress and non-stress conditions was also high performance. Faraman the new varieties have the highest yield in stress and non-stress conditions, the highest yield loss in the absence of non-stress, respectively. The reason that autumn sowing varieties, selection and introduction of new Faraman for autumn sowing and spring sowing of plant available water content of less the plant water stress imposed the. Different indices showed that indices STI, GMP, MP and HAR have been better able to identify drought resistant genotypes and the correlations between these parameters and variables in the angle between the vectors in the biplot stress tolerance index (STI) as a suitable index for selecting drought tolerant genotypes were found in safflower.
ACKNOWLEDGEMENTS
This work was supported by grant from Research Council of Islamic Azad University Kermanshah Branch, Iran.
REFERENCES
Bannayan M, Nadjafi F, Azizi M, Tabrizi L, Rastgoo M (2008). Yield and seed quality of Plantago ovata and Nigella sativa under different irrigation treatments. Ind Crops Prod. 27: 11–16.
Bassil ES, Kaffka SR (2002a). Response of safflower (Carthamus tinctorius L.) to saline soils and irrigation I. Consumptive water use. Agr Water Manage. 54: 67–80.
Bassil ES, Kaffka SR (2002b). Response of safflower (Carthamus tinctorius L.) to saline soils and irrigation II. Crop response to salinity. Agr Water Manage. 54: 81–92.
Betran FJ, Beck D, Banziger M, Edmeades GO, (2003). Crop Sci, 43: 807-817.
Bruckner PL, Frohberg RC (1987). Rate and duration of grain fill in spring wheat. Crop Sci 27:451-455.
1090 | Page Clarke JM, de Pauw RM, Townley-Smith TM (1992). Evaluation of methods for quantification of drought tolerance in wheat. Crop Sci 32:728-732.
Dehdari A (2003). Genetic analysis of salt tolerance in wheat crosses. Ph.D. thesis. Isfahan University of Technology, Isfahan, Iran, 141 p.
Dordas CA, Sioulas C (2008) Safflower yield, chlorophyll content, photosynthesis, and water use efficiency response to nitrogen fertilization under rainfed conditions. Ind Crops Prod. 27: 75–85.
Farshadfar E, Rasoli V, Teixeira da Silva JA, Farshadfar M, (2011). Aust J Crop Sci, 5 (7): 870-878.
Farshadfar E, Ghannadha M, Zahravi M, Sutka J, (2001). Acta Agron Hungarica, 49(1): 59-66.
Fernandez, GCJ. (1992). Effective selection criteria for assessing stress tolerance. Proceedings of the International Symposium on Adaptation of Vegetables and Other Food Crops in Temperature and Water Stress Tolerance. Asian Vegetable Research and Development Centre, Taiwan, 257-270 p.
Fischer RA, Maurer R, (1978). Aust J Agric Res, 29: 897 – 912.
Gavuzzi P, Rizza F, Palumbo M, Campanile RG, Ricciardi GL, Borghi B (1997). Evaluation of field and laboratory predictors of drought and heat tolerance in winter cereals. Can J Plant Sci 77:523-531.
Kar G, Kumar A, Martha M (2007) Water use efficiency and crop coefficients of dry season oilseed crops. Agr Water Manage. 87: 73-82.
Khalili Mosavi A, Taghizadeh R, Khazaei H, Omidi Tabrizi A. H., J. on Plant Science Res, (2009), 13, 1.
Khayatnezhad M, Gholamin R, Jamaati-e-Somarin S, Zabihi-e-Mahmoodabad R (2010). Study of drought tolerance of maize genotypes using the stress tolerance index. Am-Eur J Agricult Environ Sci 9:359-363.
Mitra J (2001). Genetics and genetic improvement of drought resistance in crop plants. Current Sci 80:758-762.
Pandey RK, Maranville JW, Admou A (2001). Tropical wheat response to irrigation and nitrogen in a Sahelian environment. I. Grain yield, yield components and water use efficiency. Eur J Agron. 15: 93– 105.
Quiroga AR, Dı´az-Zorita M, Buschiazzo DE (2001). Safflower productivity as related to soil water storage and management practices in semiarid regions. Commun Soil Sci Plant Anal. 32 (17 and 18): 2851–2862.
Richards RA, Rebetzke GJ, Condon AG, Herwaarden AF (2002). Breeding opportunities for increasing the efficiency of water use and crop yield in temperate cereals. Crop Sci 42:111-121.
Rosielle AT, Hambelen J, (1981) Crop Sci, 21: 943–946.
Sio-Se Mardeh A, Ahmadi A, Poustini K, Mohammadi V (2006). Evaluation of drought resistance indices under various environmental conditions. Field Crops Res 98:222-229.
1091 | Page Talebi R (2009). Effective selection criteria for assessing drought stress tolerance in durum wheat (Triticum durum Desf.). Gen Appl Plant Physiol 35:64-74.
Yau SK (2004). Safflower agronomic characters, yield and economic revenue in comparison with other rainfed crops in a highelevation, semiarid Mediterranean environment. Exp Agric. 40: 453–462.
Yousefi M (2004). Evaluation of selection efficiency for drought tolerant in wheat. M.Sc. Thesis. Isfahan University of Technology, Isfahan, Iran, 109 p. (in Farsi).
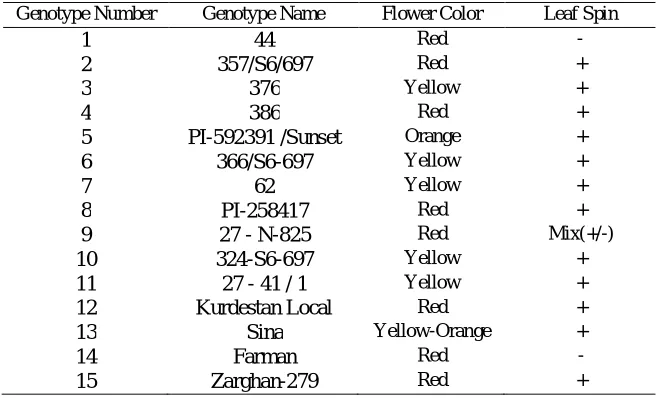
Table 1: The safflower genotypes used in the present study
Genotype Number Genotype Name Flower Color Leaf Spin
1 44 Red -
2 357/S6/697 Red +
3 376 Yellow +
4 386 Red +
5 PI-592391 /Sunset Orange +
6 366/S6-697 Yellow +
7 62 Yellow +
8 PI-258417 Red +
9 27 - N-825 Red Mix(+/-)
10 324-S6-697 Yellow +
11 27 - 41 / 1 Yellow +
12 Kurdestan Local Red +
13 Sina Yellow-Orange +
14 Farman Red
1092 | Page Table 2: Mean comparasion based on yield of stress and non-stress conditions, drought resistance indices
Genotype Yp Ys TOL STI MP GMP SSI HAR
44 1527.2 1131.2 395.4 1.16 1328.9 1314.8 0.65 1299.6
357/S6/697
681.5 671.1 10.4 0.31 676.3 676.3 0.04 676.3
376 1038 523.9 513.9 0.36 780.8 737.3 1.24 696.3
386 1469.3 708.4 760.5 0.70 1088.6 1020.1 1.29 955.8
PI-592391 /Sunset 1062.2 794.2 268 0.57 928.2 918.5 0.63 908.9
366/S6-697 1213.1 960 252.6 0.78 1086.3 1078.9 0.66 1071.6
62 1622.1 745.5 876.7 0.81 1183.9 1099.7 1.35 1021.5
PI-258417
1173.4 594.2 579.7 0.47 883.8 834.9 1.23 788.9
27 - N-825
1500 763.4 736.6 0.77 1131.7 1070.1 1.23 1011.9
324-S6-697
986.7 763.9 222.8 0.51 875.3 868.2 0.56 861.1
27 - 41 / 1
1082.2 571.4 510.8 0.41 826.8 786.4 1.18 747.9
Kurdestan Local
1089.3 548.1 540.8 0.40 818.5 772.6 1.24 729.2
Sina 1298.1 629.6 668.2 0.55 963.7 903.9 1.29 847.9
Farman
2107 597.1 1059.6 0.84 1351.9 1121.5 1.79 930.4
Zarghan-279
1093 | Page Table 3: Spearman’s rank correlation between drought resistance indices and yield of stress
and non-stress conditions
Indices Y
S YP TOL MP STI SSI GMP
YP -0.015 1
TOL -0.479 0.885** 1
MP 0.458 0.882** 0.561* 1
STI 0.660** 0.723* 0.328 0.954** 1
SSI -0.649** 0.702** 0.919** 0.318 0.113 1
GMP 0.639* 0.749** 0.360 0.967** 0.995** 0.145 1
HAR 0.787** 0.559* 0.124 0.868** 0.970** -0.052 0.965**
*and ** Significant at 1% and 5% level of probabaility, respectively.