Soft X-ray Emission Profile and Mode Structure During MHD
Events in the TST-2 Spherical Tokamak
H. TOJO, A. EJIRI, Y. TAKASE, Y. TORII, T. OSAKO, M. SASAKI
1), T. MASUDA, Y. SHIMADA,
N. SUMITOMO
1), J. TSUJIMURA, H. NUGA
1), S. KAINAGA
1)and J. SUGIYAMA
Graduate School of Frontier Sciences, The University of Tokyo, Kashiwa 277-8561, Japan1)Graduate School of Science, The University of Tokyo, Tokyo 113-0033, Japan
(Received 4 December 2006/Accepted 20 April 2007)
Mode structures during MHD events in the TST-2 spherical tokamak are revealed by means of singular value decomposition. Soft X-ray and magnetic coil signals show growths of modes with toroidal mode numbers
n=1 and 2. Slow evolution of the soft X-ray profile indicates beginning of localized crash. Occurrence of these events is correlated with the spatial gradient of the soft X-ray profile, suggesting that these events are driven by the pressure gradient. Increases in impurity ion temperatures (CIII and OV) are observed. These are positively correlated with the increment of the plasma current during these events.
c
2007 The Japan Society of Plasma Science and Nuclear Fusion Research
Keywords: IRE, spherical tokamak, SVD, soft X-ray, ion temperature, reconnection DOI: 10.1585/pfr.2.S1065
1. Introduction
In spherical tokamaks (STs), MHD instabilities have different characteristics compared to those in conventional tokamaks. In particular, reconnection events (REs) are known to cause energy and particle losses [1]. Refer-ence [1] showed the process in detail by MHD simulation. First, modes with m/n=1/1 and 2/2 grow predominantly, where m and n are poloidal and toroidal mode numbers, respectively. These modes couple nonlinearly, and deform the plasma. Magnetic field lines which belong to inner closed flux surfaces can reconnect with field lines in the outer open field line region. When such reconnection oc-curs, the pressure gradient along the reconnected magnetic field line causes plasma energy and particle losses. Such events are studied experimentally on START [2], TST-2 (Tokyo Spherical Tokamak-2) [3] and other ST devices. Objectives of this study are to compare the results of MHD simulation with experimental results in terms of mode be-havior (i.e., individual modes and their nonlinear coupling) and to identify the source of instability.
2. Experimental Setup
2.1
Soft X-ray detectors and filters
MHD mode behavior can be studied by measuring the soft X-ray (SX) emission profile. Pin-hole cameras with a 20-channel PIN-diode array and a 16-channel photo-diode array (AXUV16ELOHYB1: IRD Inc.) were used to mea-sure the SX radiation profile. The sensitive energy ranges for both detectors are from a few eV to 10 keV, and the frequency responses are up to about 100 kHz for the PIN
author’s e-mail: [email protected]
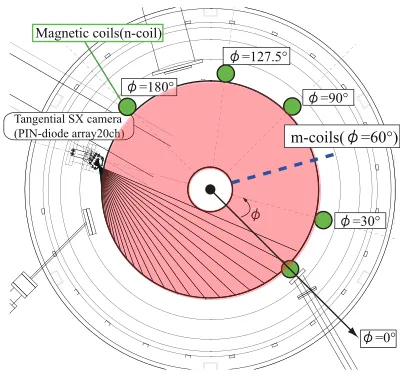
Fig. 1 Top view of TST-2 showing tangential sightlines of the tangential SX camera (black lines) and locations of mag-netic coils (n-coils and m-coils).
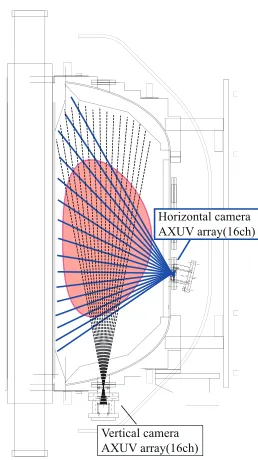
diode and 300 kHz for the AXUV. The sightlines of the PIN-diode array are tangential (toroidal) and cover the en-tire range of radius occupied by the plasma on the equato-rial plane (Fig. 1). The sightlines of the AXUV array is in the poloidal plane and measures the vertical profile of the plasma (Fig. 2).
Either a 7µm beryllium (Be) filter or a polypropylene (P.P.) filter was placed in front of the pin-hole. Be filter re-jects photons with low energies (<1 keV), whereas P.P. fil-ter has a transparent window around 300 eV, in addition to the high energy range (>1 keV). A curved filter was used instead of a flat filter to ensure the same filter thickness
c
2007 The Japan Society of Plasma
Fig. 2 Sightlines of the horizontal SX camera (16 ch) and the vertical camera (16 ch, under preparation).
Fig. 3 Schematics of flat (a) and curved (b) filters. The effective thickness is the same for all channels if a curved filter is used.
Fig. 4 Transmittance for center and edge channels of the tangen-tial SX camera, showing the effect of oblique incidence for a flat P.P filter.
for each channel in an array (Fig. 3). If a flat filter were used, the effective thickness of the filter (and therefore the transmittance) would vary for different channels (Fig. 4). This would cause a difference by a factor of two in incident power for a typical electron temperature of Te=150 eV in
TST-2, assuming a bremsstrahlung spectrum. Therefore, a curved filter was used to avoid such a systematic distortion.
2.2
Magnetic coils
Magnetic fluctuations are measured by magnetic pick-up coils with a frequency response of pick-up to 50 kHz. These coils are distributed along the toroidal direction (n-coils: 5 ch) and the poloidal direction (m-(n-coils: 7 ch). The toroidal locations of the n-coils are shown in Fig. 1. The
m-coils are located at poloidal angles ofθ=0◦, 40◦, 120◦, 150◦, 190◦, 240◦, and 320◦on the same poloidal plane at φ=60◦.
2.3
Mode analysis by singular value
decom-position
Singular value decomposition (SVD) [4] has been used to analyze mode structures in many fusion experi-ments [5]. Consider a matrix A(M×N), which can be
ex-pressed as
A=UΣVT, (1)
where U (M×M) and V (N×N) are orthogonal matrices
andΣ(M×N) is a diagonal matrix.
By using column vectors ui andvi, this can be
ex-pressed as
A=u1, u2· · ·, uM
σ1 σ2 0 ... 0 0 ... σM
vT1
vT2
... ... vT N (2)
This equation indicates that A can be expressed as the sum ofσiuivTi, whereσi, ui, and viare called the singular
value (power of the ith mode), chrono, and topo, respec-tively. In order to apply this method to experimental data, we define the matrix A as
A=
a1(0) a2(0) · · · aN(0)
a1(∆t) a2(∆t) · · · aN(∆t)
... ... ... ...
a1((M−1)∆t) a2((M−1)∆t) · · · aN((M−1)∆t)
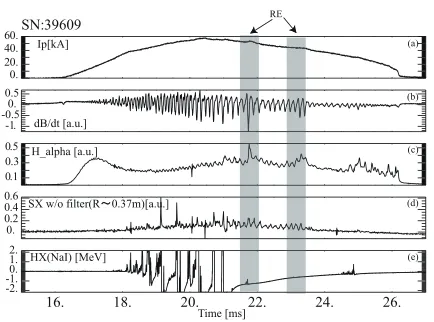
Fig. 5 Typical discharge waveforms with REs (SN39609). (a) plasma current, (b) signal from a magnetic pick-up coil, (c) Hα emission, (d) SX signal from PIN-diode (R ∼ 0.37 m), (e) hard X-ray signal from NaI (Tl) scintillator.
3. Experimental Results and
Discus-sion
3.1
Typical discharge
Figure 5 shows a typical discharge with REs. RE oc-curred at least twice in this discharge. The plasma current (Ip) increases slightly in response to a flattening of the
cur-rent density profile (reduction of the internal inductance). Prior to each RE, a growth of a mode at a frequency of around 10 kHz was observed in SX emission (especially low energy emission measured by the camera without a Be filter) and in magnetic signals from pick-up coils. In many cases, the SX intensities increase, and the mode amplitude grows with a time scale constant of about 0.4 ms. On the other hand, intensities of magnetic oscillations generally shows growths on a shorter time scale (∼0.1 ms). At the end of mode growth, energy loss from the central region towards the plasma periphery begins. Following this col-lapse, the SX intensities in the outer region increase, and the Hα emission increases. This can be explained by in-creased interaction of the lost plasma with the limiter or the vacuum vessel wall. The crash time determined by the duration of the decrease of SX intensity near the plasma center is typically 0.05-0.1 ms. RE in this study is defined as those accompanying a growth of oscillations on SX in-tensities and magnetic signals, and a crash of SX intensity. In some cases a crash is not observed on SX intensity mea-sured with filters.
3.2
Slow time evolution
In order to analyze the slow behavior of energy trans-port, the profile of dIS X/dt is plotted in Fig. 6, where
IS X is the time-averaged intensity of SX obtained by
low pass filtering (<3 kHz). This figure clarifies the en-ergy loss process during an RE. At 22.65 ms (1 in Fig. 6) the intensity starts to decrease near the center of the plasma, around ch10 (ρ∼0.2), indicating that a
reconnec-Fig. 6 Profile of dIS X/dt during an RE (SN39609). The
chan-nel number represent the radial direction (ch. 1 corre-sponds to the innermost sightline, tangentially).
Fig. 7 Chrono (a)-(d) and topo (e)-(h) of tangential SX camera and n-coils for modes i=1, 2, 4, and 7 (SN39609).
tion started around1. From2 to3 the decay region ex-pands toward the center and then toward the outboard side of the plasma. At4 the SX intensity at the center has re-covered.
3.3
SVD analysis during the growth phase
Magnetic signals reflect mainly the outer mode behav-ior of the plasma, while SX signals reflect the core be-havior. SVD analysis including magnetic signals is use-ful to obtain correlation between outer and core phenom-ena. SVD was performed on SN39609 using data from the tangential SX camera (without filter) and n-coils (5 chan-nels). Chrono and topo are shown in Fig. 7. The domi-nant mode (i=1) grew until t∼23.3 ms (Fig. 7 (a)). The poloidal mode number is even for this mode, as shown in Fig. 7 (e). The secondary mode (i=2) grows with odd poloidal mode number and shows a small correlation with the toroidal mode. Modes i=4 and 7 correspond to n=1 and 2, respectively, because magnetic coils in chrono show half a period for i=4 and one period for i=7. Moreover, the i=7 mode has twice higher frequency compared to the
Fig. 8 Chrono ((a), (d)), topo of the horizontal SX camera ((b), (e)) and, topo of the m-coils ((c), (f)). Modes i=1 and 8 correspond to (a)-(c) and (d)-(f), respectively (SN46513).
effects on the SX profile are clarified.
SVD was applied to horizontal SX camera and m-coil data. In this experiment, the P.P. curved filter was used for the SX camera and only fluctuating components (5-40 kHz) were analyzed. The dominant mode (i=1) shows a growth of even mode until just before the crash, and the magnetic topo shows some correlation to this fluctu-ation (Fig. 8 (a), (c)). Note that the intensity of fluctufluctu-ations measured by m-coils depends strongly on plasma position. Therefore, there are many cases for which we cannot deter-mine the poloidal mode number. For i=8, SX topo shows an odd-mode (Fig. 8 (b)). It is believed that channels 9-11 correspond to the plasma center in this discharge. In some cases, during the growth phase an even-mode is dominant and odd-mode is weak. However, sometimes SX fluctua-tions do not show growth but magnetic fluctuafluctua-tions show growth with a short time scale.
3.4
Correlation between SX gradient and
∆
I
pIdentification of the condition or energy source for this instability is very important for its prevention. We define the spatial gradient of SX intensity, dIS X/dr, where IS X is
the SX intensity (without filter) and r is the tangency ra-dius of the sightline. The gradient is taken from a linear fit to the SX intensity profile on the outboard side of the torus. Figure 9 indicates that a steep profile is necessary to cause an RE. The threshold is around dIS X/dr=0.02. This result
suggests that the instability is pressure driven, because SX intensity depends strongly on the plasma pressure. A pos-itive correlation between dIS X/dr and∆Ip/Ip, which is a
measure of the strength of RE, was also confirmed. Here
∆Ipis the increment of Ipduring an RE. It indicates that a
steeper SX profile induces a larger RE.
3.5
Ion temperature increase
Magnetic reconnection releases magnetic energy. In-creases of ion-temperature (Ti) have been observed in
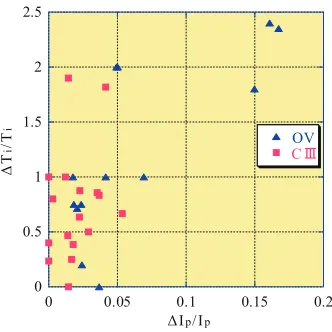
MAST [6] and TST-2 [7]. Sudden increases of ion tem-perature suggest the occurrence of magnetic reconnec-tion. Figure 10 shows the correlation between∆Ti/Tiand ∆Ip/Ip, where∆Ti/Tiis the relative increment of ion
tem-Fig. 9 dIS X/dr for discharges with RE (red circles) and without
RE (blue squares) for various values of Ip.
Fig. 10 Correlation between∆Ti/Tiand∆Ip/Ip. CIII and OV are
presented by red squares and blue triangles.
perature due to RE. The ion temperature was measured by Doppler broadening of CIII and OV lines. Typically Ti
(CIII)∼20 eV and Ti (OV)∼40 eV before RE. All data
points in the plot show growth of magnetic and/or SX fluc-tuations. Ti measured by CIII and OV are correlated
pos-itively with ∆Ip/Ip. Especially, the highest increment of ∆Ti/Ti∼2.4 was measured by OV. The scale of RE
(repre-sented by∆Ip/Ip) is positively correlated with the increase
of Ti, indicating that large scale REs result in stronger ion
heating.
4. Conclusion and Summary
sug-gested as a candidate to drive this instability. The thresh-old for instability was dIS X/dr∼0.02. The measured ion
heating was also consistent with other experiments, and a positive correlation with∆Ip/Ip showed evidence of
con-version of magnetic energy to ion thermal energy.
Acknowledgments
This work was supported by JSPS (Japan Society for the Promotion of Science) Grant-in-Aid for Scientific Re-search No. 16106013.
[1] N. Mizuguchi et al., Phys. Plasmas 7, 940 (2000).
[2] A. Sykes et al., Plasma Phys. Control. Fusion 39, B247 (1997)
[3] Y. Takase et al., Nucl. Fusion 41, 1543 (2001).
[4] C. Nardone, Plasma Phys. Control. Fusion 34, 1447 (1992) [5] S. Yoshimura et al., Nucl. Fusion 9, 3378 (2002).