Wavelet Analysis on FECG Detection using Two Electrodes
System Device
Fauzani N. Jamaluddin
1,*, Zulkifli Abd. Kadir Bakti
1, Mustaffa Kamal Harun
1,
Azan Aminnudin
11
Department of Electric and Electronic
Universiti Kuala Lumpur – British Malaysian Institute, Batu 8, Jalan Sg.Pusu, 53100 Gombak, Selangor, Malaysia
Received 1 November 2013; received in revised form 7 January 2014; available online 30 January 2014
1.
Introduction
Fetal monitor is really useful in assessing high risk pregnancies such as diabetes, high blood pressure and problem with fetal growth. Through monitoring, it can de distinguish either the baby is in good condition or shows a distress or hypoxia response. From Fetal electrocardiograph (FECG), fetal heart rate, amplitudes of different waves and duration of the waves, segments and intervals can be obtained. Unfortunately, the QRS complex of FECG is difficult to obtain using non-invasive method. Due to the low SNR in non-non-invasive method, only R-peaks can be detected and P and T waves remain hidden [1]. Doppler ultrasound is most common method used in hospital during fetal monitoring process. It is safe, but inaccurate, highly sensitive to noise and the success of the measurement depends on the positioning of the probe [9]. Furthermore, during monitoring maternal are not advised to make lot of movement and it may lead to blood circulation problem where can decrease oxygen supply and abnormal changes. Repositioning of the probe is always wanted to avoid ‘blackout’ period, where the detected signals are not visible by medical practitioner.
Other than ultrasound Doppler, FECG also can be measured using standard ECG electrodes Ag/AgCl by patch it onto maternal abdomen. Previous research in [3, 4 and 9] used 12 to 13 numbers of electrodes to detect FECG signal. Although FECG are successfully detected, too large numbers of electrodes makes the maternal are not comfortable during monitoring process. However, the
researcher keep on reducing numbers of electrode used as in [17], use eight electrodes where three for MECG and five for abdominal, [8] use four electrodes and [6] used wrist lead and placed onto abdomen.
Currently, a lot of methods for FECG have been implemented on FECG extraction. This include least square acceleration (LSA) and adaptive impulse correlation (AIC) [2], linear prediction (LP) and segmentation linear prediction (SLP) [3], correlation and non-correlation function [4], and blind source separation (BSS) [5]. And latest, principle component analysis (PCA) is used to determine fetal heart rate in [18]. Some of the methods are successful techniques for FECG extraction. However, most of the method requires multi-channel signals and thus causing structural complexity.
Due to the advantages of Wavelet Transform (WT) for time-frequency representation, many researches also discovered it for FECG extraction. Although there are many researchers as in [6], [8], [10] and [17] have used WT in their research works, there is no standard mother wavelet used for FECG detection. The chosen suitable mother wavelet for ECG and FECG processing is still in research.
Since, there is no standard position of electrodes for FECG detection; therefore comparison between two placements of electrodes has been made to find the best measurement of FECG. In addition, according to previous research on [6], the amplitude of the maternal ECG will be reduced by 90% when the electrode is placed at the uterine fundus. So, similar method in [6] is adapted in this
Abstract: Fetal electrocardiogram signal detection during pregnancies is very useful in assessing fetal condition. Doppler ultrasound is very common in fetal monitoring. It is safe, but inaccurate, highly sensitive to noise and the success of the measurement depends on the positioning of the probe. Recently, there are many research use non-invasive Ag/Ag Cl electrode in fetal electrocardiogram detection. However it involves large number of electrode during measurement. In addition, complex structures of signal processing are required. A research work has been made on fetal electrocardiogram detection using two electrodes biopotential device without reference electrode. Best possible electrode placement for maximum fetal electrocardiogram waveforms detection has been identified. The signals are successfully detected at 0.028Hz after processed using discrete wavelet analysis for de-noising and continuous wavelet transform for signal detection.
research using two electrodes system. The signals then are processed using wavelet analysis. Discrete Wavelet Transform (DWT) was used for de-noise unwanted signal and Continuous Wavelet Transform (CWT) for signal detection.
2.
Two Electrodes System
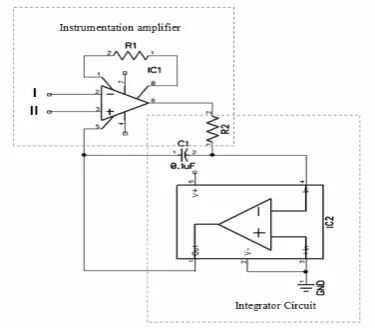
The electrodes system consists of instrumentation amplifier (IA) AD620 from Analog Devices, integrator circuit and notch filter. AD620 is chosen since in offers better performance, save space and cost effective compare to conventional differential amplifier. It offers CMRR, 130db (G=100), and low power consumption, 1.3mA. Other than that, this IA only requires one resistor to set it gains of 1 to 10,000 by equation:
1
/
4
.
49
1
k
R
Gain
=
+
(1)
Based on figure 1, R1 is set to 200Ω, and it makes the gain is set to 248.
Fig.1 Two electrodes system circuit design
The reference electrode is eliminated and integrator circuit is added to the reference pin of AD620 to create ‘virtual ground’ as implemented in previous work in [11]. Based on op-amp golden rule concept, where V- = V+, the op-amp will ensure to keep the negative input at ground as well since the positive input is grounded, and automatically create ‘virtual ground’ without directly connected to the ground of the circuit. Other than that, ‘virtual ground’ also created when the circuit is able to maintain at a steady reference potential (DC level at the output), regardless of the change in the surface skin resistance. In addition, in [12] use the same integrator circuit to compensate the DC offset created by electrode-skin contact. Power line interference is the most challenges face by many researchers during biopotential measurement. Therefore, a simple notch filter cut-off at 50Hz is added to the circuit design. Two Ag/Ag Cl electrodes from Kendall Meditrace 200 used and
connected to pin 2 and pin 3 of AD620 to pick up fetal heart beat signals.
3.
FECG Detection using Two Electrodes
System
The fetus’s heart is among the first organs developed and begins beating by the 22nd day of life. The FECG detection is very challenging task since skin and fat have poor conductivity and fetal cardiac signals need to propagate up to maternal body surface after going through all the tissue and layers [13]. However, the layer will slowly dissolve in the 37th to 38th week of pregnancy, where the R-peak of FECG is easier to detect. The recording is performed on 27 years old maternal during her 37th weeks of pregnancy. As there is no standard electrode placement for FECG detection, then two placements have been tested in order to get best detected signals.
The comparisons between both positions are shown in Figure 2 and Figure 3. The measurement of abdominal signal and maternal ECG signal were recorded at the same time as it easier to make any comparison between the signals. Position I was placed with two Ag/AgCl sensing electrodes at the top of the abdomen, about 3cm from center of the abdomen.
Black arrow in the both figures indicate the MECG signals, red arrow is for FECG and green arrow for unwanted signal or known as noise. Black dashed lines indicate that maternal ECG correlates to the signal that is detected in abdominal record. As in Figure 2, there are mix signal between noise, abdominal signal and MECG. It is indicate that strong signal exist is position I compare to position II in figure 3 since it closer to maternal heart. However, the R-peak of FECG still can be identified.
Fig. 2 Comparison between MECG and abdominal signals for Position I
Fig. 3 Comparison between MECG and abdominal signals for Position II
results in Figure 3 show that, MECG is very low amplitude compare to FECG where give stronger signals compare in position I is. It may happen as the maternal heart is quite far from the position of the electrodes and closer to fetus heart as the position of the fetus itself in vertex position where it ready for delivery process. Since amplitude of MECG is very low signals, further analysis is getting easier as MECG signals can be ignored compare to other strong signals exist, especially R-peak of FECG.
4.
FECG Detection using Wavelet Analysis
Fourier transform usually used in signal processing. It is mathematical technique for transforming time domain to frequency domain. Unfortunately, during transforming to frequency domain, time information is lost. Therefore, it is impossible to identify when the particular event took place. To overcome this problem, wavelet analysis is chosen since it is based on time-frequency representation concept. It introduces multi-resolution technique, which different frequencies are analyzed with different resolution. At high frequencies, wavelet transform gives good time resolution and poor frequency resolution, while at low frequencies; the wavelet transform gives good frequency resolution and poor time resolution.
Generally, wavelet is always referred to as small wave, is localized waves of finite energy used to represent signals [14]. It can be visualized as “brief oscillation”. Wavelet is purposely designed to have specific properties, used for signal processing. Through convolution techniques, required information can be extracted from unknown signal. The wavelet will resonate every time it detects similar frequency. Basically, wavelet analysis is comparing the signal with a chosen wavelet, and recording the coefficient that indicates the correlation of the signal to the wavelet. It makes it very suitable for non-stationary signals analysis as ECG and FECG.
Wavelet analysis expands function in terms of wavelets, which are generated in the form of translations and dilations of a fixed function called mother wavelet. The translations and dilations wavelets are also known as father wavelet. The mother wavelet can be chosen from large numbers of family wavelet such as Daubechies (db), Symlett, Biorthogonal Spline (B-Spline), Coiflet and etc. It is important to choose the suitable and appropriate mother wavelet function as it determine the characteristics of the transformation. To date, there is specific mother wavelet function for FECG detection. Previous research in [15], [16], [14], [6] and [25] show that the chosen of mother wavelet is different each other. [6], [15], [16] and [17] choose db in their research, while [14] and [8] choose B-spline.
By using the Matlab program which provide very good wavelet toolbox, One Dimensional Wavelet 1-D and Continuous Wavelet 1-D are used. Through Wavelet 1-D, non-stationary signal like FECG can be de-noised, while Continuous Wavelet 1-D used for signal detection. De-noising process through wavelet transform is involving three main process. First, decompose the signal to few
frequency bands, second; modifying wavelet coefficient and finally is reconstruction where it refers to Inverse Wavelet Transform process. After the filtering process done, CWT has been applied. The analysis of CWT will result scalogram of wavelet coefficients and coefficients line of FECG signal. Through CWT, R-peak of FECG is clearly identified and the exact frequency of FECG exist can be obtained.
4.1 Decomposition
Decomposition process is the process where the signals are sent through to the finite impulse response (FIR) high pass filer (HPF) (h) and FIR low pass filter (LPF) (g) with different cut-off frequencies at different scales. This process also called as Mallat tree decomposition and result of multi resolution analysis (MRA), where the signal can be access in different segment and different frequencies.
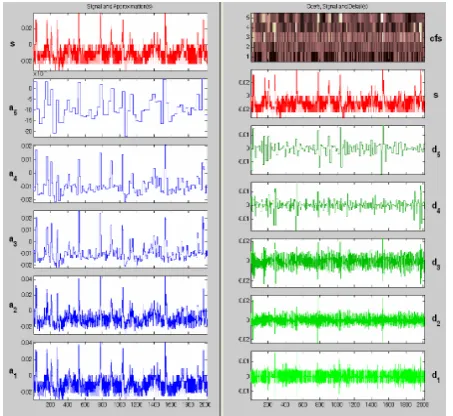
In this task, the selection of appropriate wavelet was very important. The similar wavelet to the desired signal was chosen to the best possible result. Therefore, FECG signal has been decomposed using 5th levels biorthogonal 1.5 wavelets. HPF will produce coefficients, dn and LPF will produce approximations, an.
Based on Figure 5, the noise at level 4 and 5 are reduced and the signal emphasis on the location of R peak detection. Meaning that, the signal can be detected at frequency band fs/64 –fs/32, with resolution 2016/32 at level 5th, d5. Where 2016 is the number of samples used, and frequency sampling, fs are 8 kHz.
Figure 5: Detail Coeficient,dn and approximation at 5th level of decomposition of FECG signals
signals have been removed. At level 5th approximation, a5 LPF, 0 – fs/64 successfully performs on the signal, and it highlights each peak of the signal which is free from noise
Although the decomposition process emphasis the location of the peak and remove high frequencies of unwanted signal, but FECG signal still difficult to detect. Both peak of FECG and noise have strong amplitude. Therefore, some modifications on wavelet coefficient need to be done to filter the unwanted peak.
4.2 Modifying Wavelet Coefficient
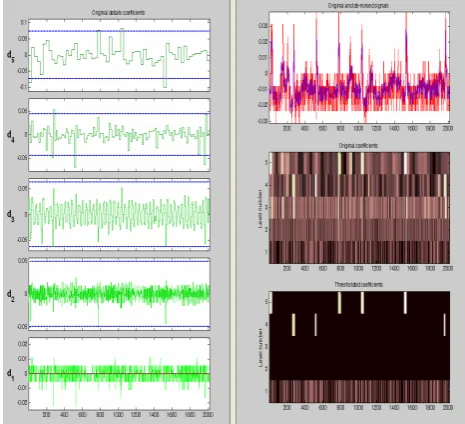
The next step of de-noising process is modifying wavelet coefficient. Wavelet coefficient can be modified by threshold method. Hard thresholding is used. A certain threshold on peak amplitude is set on the wavelet coefficient where it only enhance the amplitude above the threshold and any signals below the threshold will be set to zero.
Figure 6 shows the threshold process and the result of the process. By using this process, it is very easy to remove the unrelated noisy peak by setting the threshold limit at desired signal. This kind of process is also known as peak detection process and it is very important to FECG extraction.
As in the right bottom of Figure 6, thresholded coefficient shows the detected signal, which is indicated by yellow line. Each of the yellow line represents Rpeak of the FECG signals. The de-noised signal can be seen in the right top of Figure 5, in purple line color while, the red color represents the original of the signals. The process then continued to the reconstruction stage, where inverse discrete wavelet transform (IDWT) is requires as the signals can be analyze further in CWT for signals identification.
Fig.6 Thresholding process of FECG signal
4.3 Reconstruction through Inverse DWT
To obtain a de-noised signal which compatible for further process, IDWT of the thresholded wavelet coefficient need to be performed. This process is also known as reconstruction.
(a)
(b)
(c)
Fig 7 (a) Original of FECG Signal, (b) Filtered Signal or De-noised Signal, (c) Comparison between original and filtered Signal
Figure 7 show the comparison of the original signal in (a) and de-noised signal in (b). Figure 7 (c) shows the de-noised signal overlap on the original signal. According to these figures, its show that the de-noising process not just increases 3.30dB of SNR, but it is also very useful for peak detection.
4.4 CWT
CWT is very convenient in tackling problem involving signal identification and detection of hidden transient (hard to detect, short lived element of signal). Although biorthogonal wavelet is successfully in de-noise process, db wavelet is chosen for signal identification. In addition, both of the wavelet types have quite similar shape and peak.
The CWT is defined by following standard equation:
∫
=
f
t
t
dt
b
a
f
WT
ψ
(
)(
,
)
(
)
ψ
a,b(
)
(2)Based on the equation, scale factor is represent by a, while b refers to translation factor. And the mother wavelet is as in equation 3. However, it is based on chosen wavelet family as discussed before.
)
(
1
)
(
,
at
b
a
t
b
a
=
ψ
−
ψ
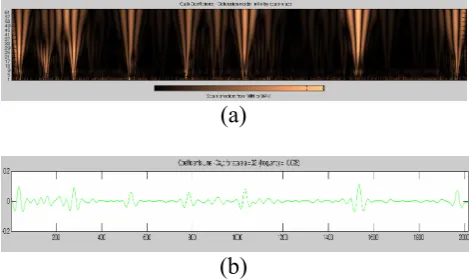
(3)plane, where Y-axis represents the dilation (scaling factor) of the wavelet, while X-axis is the translation (shift along time axis). The result is represented by scalogram, coefficient lines and local maxima lines. Square magnitude of the CWT will produce scalogram. Through scalogram, it allows users to observe pattern and energy distribution of the coefficient. The strength of the coefficient is shown by the intensity of its color. The brightest part shows that the frequency component is of higher power than with less brighter parts. While modulus maxima used for locating and characterizing singularities in the signal.
Based on Figure 8, it shows the result of the CWT process on de-noise abdominal signal. Figure 8 (a) shows the scalogram and (b) Coefficient Line. As illustrated in Figure 8 (a), the scalogram emphasizes on the detection of R-peak as shown in maximum resolution of CWT, which is the brightest part. It show that the FECG signal exist in high frequencies than the other detected signals. Even though there are other bright color signal detected, but the intensity of the color are not similar to the regular detected signal. The intensity of the color will represent frequency band for that particular time. Therefore, it can be concluded that the detected signal which is regular in time are in the same frequency band. And it refers to R-peak of FECG signal.
(a)
(b)
Fig 8 Result of CWT on abdominal signal position II, (a) Scalogram, (b) coefficient line.
According to the coefficient line, R-peak FECG signals are much easy to be recognized. Each related peak is emphasized and shows the regularity. The unrelated peak can be ignored since it is too small compared to the regular peak. In addition, according to the scalogram, the unrelated peak signals are in detected different frequency band. The coefficient line as illustrated in Figure 8 (b), shows the time representation in frequency 0.028, where FECG signals is detected through CWT.
5
Accuracy
To test the performance of R-peak of FECG detection, accuracy (Acc) is calculated before and after wavelet transforms based on formula in [8] and [7], where given by;
FN
FP
TP
TP
Acc
+
+
=
(4)The formula is calculated based on three quantitative results: true positive (TP) when an R-peak is correctly detected, false negative (FN) when an R-peak was not detected and false positive (FP) when an artifact is detected as R-peak [8]. The Acc calculation indicates the performance of two electrodes biopotential amplifier and processed signals wavelet analysis. Three fetal ECG signal from the same maternal have been recorded and calculated for Acc as in table 1.
Based on Acc results in Table 1, it shows that average of Acc of FECG detection using the developed device is only 60.3%. Denoising and detection process using WT can increase the accuracy of R-peak detection by about 18.7%.
Table 1: Accuracy of propose method
Record
Before
WT (%)
After WT
(%)
1
58.3
78
2
61
88
3
61.5
70
AVERAGE
60.3
78.7
6. Conclusion
As there is no standard positioning for FECG detection, two series of experiments have been conducted in order to find the best electrode placement. Misplacement of electrodes sensors will lead to mixed signals between maternal ECG and FECG. Position II is discovered to be the best placement as it is far from maternal ECG and only R-peaks of FECG were detected. Though R-peak is detected in position II, there are missing peaks and unwanted peaks. The average accuracy of sensors in FECG detection is a 60.3%.
References
[1] V. Vigneron, A. Paraschiv-Ionescu, A. Azancot, O. Sibony, C. Jutten. Fetal Electrocardiogram Extraction Based On Non-stationary ICA and Wavelet Denoising. Proceedings of Seventh International Symposium on Signal Processing and its Applications, (2003).
[2] M.H. Song, S.P. Cho, H.D. Park, K.J. Lee. The Novel Method for the Fetal Electrocardiogram Extraction from the Abdominal Signal. Proceeding 29th Annual International Conference of the IEEE Engineering in Medicine and Biology Society, (2007), pp. 3284-4
[3] R. Vulling, C. Peters, M. Mischi, G. Ochi, J. Bergman. Maternal ECG Removal from Non-Invasive Fetal ECG Recording. Proceedings of the 28th IEEE EMBS Annual International Conference, (2006), pp. 1394-1397.
[4] M. Ungureanu, J.W.M Bergmans, M. Mischi, S. Guid Oei, R. Strungaru. Improved Method for Fetal Heart Rate Monitoring. Proceeding of the 2005 IEEE Engineering in Medicine and Biology 27th Annual International Conference, ( 2005), pp. 5916-5919
[5] L.D. Lathauwer, B.D. Moor, J. Vandewalle. Fetal Electrocardiogram Extraction by Blind Source Subspace Separation, IEEE Transactions on Biomedical Engineering, Volume 47 (5), (2000), pp. 567-572.
[6] F. Mochimaru, Y. Fujimoto, Y.Ishikawa. Detecting the Fetal Electrocardiogram by Wavelet Theory-based Methods. Prog. Biomed. Res, Volume 7(3), (2002), pp.185-193.
[7] C.I. Ieong, M.I. Vai, P.U. Mak. ECG QRS Complex Detection with Programmable Hardware, 30th Annual International IEEE EMBS Conference, (2008), pp. 2920-2923.
[8] E.C. Karvounis , M.G. Tsipouras , D.I. Fotiadis, K.K Naka. A Method for Fetal Heart Rate Extraction Based on Time-Frequency Analysis. IEEE International Symposium Computer Based Medical Systems, (2006), pp. 347-347.
[9] I. Saadane. Detection of the Abdominal Fetal Electrocardiogram: A Study into Changes in the Optimal Recording Sites During Gestation and the Evaluation of Non-Contact Sensors. M.S Thesis, Eindhoven University of Technology, (2005).
[10]G. Cornelia, R. Romulus. ECG Signals Processing Using Wavelets. Unpublished.
[11] J. Zang. ECG premier. Unpublished, (2008) [12] A. Vahed. 3 Lead Wirelesses ECG. Unpublished. [13] R. Sameni. Extraction of Fetal Cardiac Signals from
an Array of Maternal Abdominal Recordings.Ph.D Dissertation, Sharif University of Technology, ,(2008).
[14]M. Haske, V. Sheppard, M. Smith. Wavelet Modeling of ECG Signals. Unpublished, (2004).
[15]C. Saritha, V. Sukanya, Y. Namasimha Murthy, ECG Signal Analysis Using Wavelet Transform. Bulg. J. Phys, Volume 35,(2008), pp. 68-77.
[16] H. Hassanpour, A. Parsaei. Fetal ECG Extraction Using Wavelet Transform. International Conference on Web Technologies and Internet Commerce, (2006), pp.179 -179
[17] K.D. Desai, M.S. Sankhe. A Real-Time Fetal ECG Feature Extraction Using Multiscale Discrete Wavelet Transform. 5th International Conference on Biomedical Engineering and Informatics,(2012), pp. 407-412.