The relationship between auditory
efferent function and frequency
selectivity in Man
A thesis submitted for the degree of Doctor of Philosophy
University College London
University of London
Jennifer Clare Hill
Institute of Laryngology and Otology
ProQuest Number: 10609399
All rights reserved
INFORMATION TO ALL USERS
The qu ality of this repro d u ctio n is d e p e n d e n t upon the q u ality of the copy subm itted.
In the unlikely e v e n t that the a u th o r did not send a c o m p le te m anuscript and there are missing pages, these will be note d . Also, if m aterial had to be rem oved,
a n o te will in d ica te the deletion.
uest
ProQuest 10609399
Published by ProQuest LLC(2017). C op yrig ht of the Dissertation is held by the Author.
All rights reserved.
This work is protected against unauthorized copying under Title 17, United States C o d e M icroform Edition © ProQuest LLC.
ProQuest LLC.
789 East Eisenhower Parkway P.O. Box 1346
A cknowledgem ents
I must thank my supervisors Dr. Deepak Prasher and Prof. Linda Luxon, and all of the subjects who participated in this study.
I am grateful to Richard Baker in the phonetics department, UCL, for invaluable advice regarding all matters to do with the filter shape testing and answering my many questions.
This work was supported by the Ferens departmental studentship. Additional funding was provided by the I.L.O. after a set back beyond my control.
Thanks to those at the I.L.O. who helped enormously by keeping me sane and making encouraging comments (Katherine, Jill, Siobhan and Borka) as well as Antony and Dave, who also helped with more technical issues.
Also to my other friends (you know who you are) for being there, especially Steve, who also endured many hours of testing, all in the name of research.
Table of Contents
1. Introduction 14
2. Background Theory________________________________________________ 17
2.1 The Anatomy and Physiology of the Human E ar_________________________ 17
2.1.1 Outer and Middle E a r_____________________________________________________17
2.1.2 Cochlea_______________________________________________________________ 20
2.1.3 Auditory Neural Pathways_________________________________________________ 27
2.2 Otoacoustic Emissions (OAEs)_______________________________________ 31
2.2.1 Existence of otoacoustic emissions__________________________________________ 31
2.2.2 How OAEs have been used to study the auditory efferent system___________________ 33 2.3 The Auditory Efferent System________________________________________ 34
2.3.1 Detailed Anatomy_______________________________________________________ 34
2.3.2 Physiology_____________________________________________________________ 35
2.3.3 Possible roles of the auditory efferent system__________________________________ 46 2.4 Measurement of Frequency Selectivity in Humans________________________ 52 2.5 Thesis Rationale__________________________________________________ 54
3. Equipment and General Methods_____________________________________ 60
3.1 Auditory Filter Shape Measurement__________________________________ 60
3.1.1 Modelling of Auditory Filter Shape_________________________________________ 60
3.1.2 The Notched Noise M ethod_______________________________________________ 62
3.1.3 Equipment_____________________________________________________________ 69
3.2 Otoacoustic Emission Measurement___________________________________ 78
3.2.1 Transient Evoked Otoacoustic Emissions (TOAEs)_____________________________ 78
3.2.2 Synchronised Spontaneous Otoacoustic Emission (SSOAE) Measurement____________83
3.2.3 Distortion Product Otoacoustic Emission Measurement (DPOAE)__________________84
3.3 Pure Tone Audiometry_____________________________________________ 87 3.4 Tympanogram____________________________________________________ 87 3.5 Acoustic Reflex Thresholds__________________________________________ 88
4. Plan o f Experim ents________________________________________________90
5. Investigation o f the Possible Link between Auditory Filter Shape at 1kHz and
Otoacoustic Emission Magnitude and Suppression. __________________________ 93
5.1 Introduction______________________________________________________ 93 5.2 Method__________________________________________________________ 93
5.2.1 Subjects_______________________________________________________________ 93
5.2.2 Measurement of Auditory Filter Shape at 1kHz______________ 94
5.2.3 Transient Otoacoustic Emission (TOAE) Measurement__________________________ 94
5.2.4 Synchronised Spontaneous Otoacoustic Emission (SSOAE) Measurement___________ 95
5.2.5 Distortion Product Otoacoustic Emission Measurement__________________________ 95
5.3 Results__________________________________________________________ 95
5.3.1 TOAE magnitude_______________________________________________________ 96
5.3.2 TOAE suppression______________________________________________________ 96
5.3.3 TOAE magnitude and suppression in specific frequency bands____________________ 100
5.3.4 Temporally windowed TOAE suppression____________________________________ 101
5.3.5 SOAEs________________________________________________________________102
5.3.6 DPOAEs______________________________________________________________104
5.3.7 Other parameters describing the shape of the auditory filter______________________ 111
5.4 Discussion
121
5.5 Conclusion______________________________________________________ 127
6. The Onset Latency o f Auditory Efferent Suppression o f Otoacoustic Emissions 129
6.1 Introduction_____________________________________________________ 129
6.1.1 Onset T im e___________________________________________________________ 129
6.1.2 Overall Timescale of Response____________________________________________ 131
6.2 Method_________________________________________________________ 131
6.2.1 Subjects_______________________________________________________________ 131
6.2.2 Apparatus and stimulus protocol____________________________________________132
6.2.3 Procedure_____________________________________________________________134
6.2.4 Analysis_______________________________________________________________135
6.3 Results_____________________ 136
6.4 Discussion_______________________________________________________ 142
6.4.1 Onset T im e___________________________________________________________ 142
6.4.2 Lack of Significant Suppression at Certain Points_____________________________ 144
6.4.3 Variability of Suppression______________________________________________ _ 145
6.5 Conclusion___________________________________________ 147
7. Efferent Activation with White Noise During Filter Shape Measurement 149
7.1 Introduction_____________________________________________________ 149 7.2 Methods________________________________________________________ 150
7.2.1 Subjects_______________________________________________________________150
7.2.2 Measurement of Auditory Filter Shape_______________________________________150
7.2.3 Otoacoustic Emission Measurements________________________________________151
7.3 Results_________________________________________________________ 151
7.3.1 Cross-talk____________________________________________________________ 154
7.3.2 TOAE magnitude ______________________________________________________ 154
7.3.3 TOAE suppression_____________________________________________________ 154
7.3.4 TOAE magnitude and suppression in specific frequency bands___________________ 157
7.3.5 Temporally windowed TOAE suppression___________________________________ 158
7.3.6 SOAEs_______________________________________________________________ 160
7.3.7 DPOAEs_____________________________________________________________ 160
7.3.8 Other parameters describing the shape of the auditory filter______________________ 161
7.3.9 Influence of other factors_________________________________________________ 165
7.4 Discussion_______________________ 166
7.5 Conclusion______________________________________________________ 169
8.Efferent Activation with Narrow Band Noise during Filter Shape Measurement 171
8.1 Introduction__________________ 171
8.2 Methods________________________________________________________ 172
8.2.1 Subjects_______________________________________________________________172
8.2.2 Measurement of Auditory Filter Shape______________________________________ 172
8.2.3 Otoacoustic Emission Measurements________________________________________173
8.3 Results_________________________________________________________ 173
8.3.1 TOAE magnitude_______________________________________________________175
8.3.2 TOAE suppression______________________________________________________176
8.3.3 TOAE magnitude and suppression in specific frequency bands____________________177
8.3.4 Temporally windowed TOAE suppression____________________________________ 179
8.3.5 SOAEs________________________________________________________________ 181
8.3.6 DPOAEs______________________________________________________________182
8.3.7 Other parameters describing the shape of the auditory filter_______________________ 183
8.4 Discussion 195
8.5 Conclusion______________________________________________________ 199
9. The Auditory Filter Shape at 2kHz and the Possible Link vAth OAE Magnitude
and Suppression________________________________________________________201
9.1 Introduction_____________________________________________________ 201 9.2 Methods________________________________________________________ 201
9.2.1 Subjects_______________________________________________________________201
9.2.2 Measurement of Auditory Filter Shape______________________________________ 202
9.2.3 Otoacoustic Emission Measurements________________________________________202
9.3 Results_________________________________________________________ 202
9.3.1 TOAE magnitude______________________________________________________ 202
9.3.2 TOAE suppression_____________________________________________________ 202
9.3.3 TOAE magnitude and suppression in specific frequency bands____________________203
9.3.4 Temporally windowed TOAE suppression____________________________________204
9.3.5 SOAEs________________________________________________________________204
9.3.6 DPOAEs__________________ 204
9.3.7 Other parameters describing the shape of the auditory filter_______________________205 9.3.8 Relationship to TOAEs elicited and/or suppressed at 2kHz_______________________208
9.3.9 Influence of other factors_________________________________________________ 210
9.4 Discussion_______________________________________________________ 211 9.5 Conclusion______________________________________________________ 214
10. D iscussion_______________________________________________________ 216
11. Concluding Remarks_______________________________________________222
12. R eferences_______________________________________________________ 226
13. Appendix 1: Program written to test auditory filter at 1kH z_______________ 245
14. Appendix 2: Program written to test auditory filter at 2kH z_______________ 252
15. Appendix 3: Correlation o f DP suppression and auditory filter shape
param eters____________________________________________________________258
16. Appendix 4: Scatterplots o f the relationship between suppression o f click evoked OAEs by white noise and auditory filter shapes during contralateral narrow band
noise_________________________________________________________________261
Table of tables
Table 3-1: Notched-noise masker g values________________________________________________66
Table 3-2: Notched-noise masker frequencies for a 1kHz probe to n e___________________________68
Table 3-3: Notched noise maskers fo r testing the filter at 2kHz________________________________69
Table 3-4: Inter-test and inter-subject variability for the filter shape bandwidth estimation._________ 77
Table 5-1: Combinations o f stimuli tested with TOAEs______________________________________94
Table 5-2: Summary o f results o f TOAE suppression tests and relationship to filter bandwidth_______96
Table 5-3: Correlation between 3dB bandwidth, and TOAE standard response and suppression, after
filtering__________________________________________________________________________ 100
Table 5-4: Correlation between 3dB bandwidth, and TOAE suppression after filtering between various
frequencies and windowing from 10-20ms after stimulus onset_______________________________101
Table 5-5: Correlation o f DP measures and 3dB bandwidth o f auditory filte r___________________105
Table 5-6: Suppression o f2 f-f2 distortion products by a contralateral IfcHz tone -DPGram________106
Table 5-7: Suppression of2frf 2 distortion products by a contralateral 1kHz tone - Fine structure around
1kH z____________________________________________________________________________ 107
Table 5-8: Suppression of2fl-f2 distortion product by contralateral 1kHz narrow band noise- DPGram
___________________________________________________________________________________ 109
Table 5-9: Suppression of2fl-f2 distortion product by contralateral 1kHz narrow band noise - fine
structure around 1 k H z______________________________________________________________110
Table 5-10: Correlation o f TOAE magnitude and suppression with parameters describing auditory filter
shape____________________________________________________________________________ 113
Table 5-11: Correlation o f TOAE magnitude and suppression at 1 and 2kHz with parameters describing
auditory filter shape________________________________________________________________113
Table 5-12: Correlation o f temporally windowed TOAE suppression at 1 and 2kHz with parameters
describing auditory filter shape_______________________________________________________114
Table 5-13: Comparison o f the values o f the parameters describing the shape o f the auditory filter in
subjects with and without SOAEs______________________________________________________115
Table 5-14:Correlation ofDPOAE magnitude measurements with parameters describing auditory filter
shape__________ ;_________________________________________________________________115
Table 6-1: Mean total response suppression data at various click times________________________137
Table 6-2: Mean windowed suppression data at various click times___________________________138
Table 7-1: Mean 1kHz auditory filter parameters with and without contralateral white noise and p values
fo r testing the difference o f the means.__________________________________________________153
Table 7-2: Summary o f results o f TOAE suppression tests and relation to B W ^ and ABW,m________155
Table 7-3: Pearson’s correlation coefficients for the relationship between bandwidth o f the auditory filter
during contralateral white noise and TOAE magnitude and suppression in two different frequency
regions __________________________________________________________________________ 157
Table 7-4: Pearson’s correlation coefficients and significance values for the relationship between ABW^,
Table 7-5: Pearson’s correlation coefficients for the relationship between B W ^ and the TOAE
suppression data after filtering by frequency> and windowing in tim e__________________________ 159
Table 7-6: Pearson’s correlation coefficients for the relationship between ABW ^ and the TOAE
suppression data after filtering by frequency and windowing in tim e__________________________ 159
Table 7-7: Relationship between DPOAE measures and B W a n d ABW ^______________________ 160
Table 7-8: Correlation o f TOAE magnitude and suppression with parameters describing auditory filter
shape during contralateral white noise__________________________________________________ 161
Table 7-9: Correlation o f TOAE magnitude and suppression at 1 and 2kHz with parameters describing
auditory filter shape during contralateral white noise______________________________________ 162
Table 7-10: Correlation o f TOAE suppression at 1 and 2kHz with parameters describing auditory filter
shape during contralateral white noise__________________________________________________163
Table 7-11: Comparison o f the values o f the parameters describing the shape o f the auditory filter during
contralateral white noise in subjects with and without SOAEs________________________________ 163
Table 7-12: Correlation o f DPOAE magnitude measurements with parameters describing auditory filter
shape____________________________________________________________________________ 164
Table 8-1: Mean and standard deviations for 3dB bandwidth o f 1kHz auditory filter tested during
contralateral narrow band noise at 1kHz, 2kHz and 500Hz._________________________________173
Table 8-2: Summary o f difference parameter values for bandwidth with and without contralateral narrow
band noise________________________________________________________________________ 175
Table 8-3: TOAE suppression results___________________________________________________176
Table 8-4: Pearson’s correlation coefficients for the relationship between 4 measures o f TOAE
suppression and the 3dB bandwidth o f auditory filters measured during contralateral NBN or the change
in bandwidth from the filter measured with no noise._______________________________________177
Table 8-5: Pearson's correlation coefficients for the relationship between BWJnbn, and ABWInbn and
TOAE magnitude and suppression in 2 frequency bands____________________________________177
Table 8-6: Pearson’s correlation coefficients for the relationship between BW2nbn, and ABW2nbn and
TOAE magnitude and suppression in 2 frequency bands____________________________________178
Table 8-7: Pearson’s correlation coefficients for the relationship between BW50onbn and ABW50onbn and
TOAE magnitude and suppression in 2 frequency bands____________________________________178
Table 8-8: Pearson’s correlation coefficients for the relationship between BWInbn and ABWj^,n and
TOAE suppression in 2 frequency bands after temporally windowing (10-20ms)_________________180
Table 8-9: Pearson’s correlation coefficients for the relationship between BW2t&n and ABW2nbn and
TOAE magnitude and suppression in 2 frequency bands after temporally windowing (10-20ms)_____181
Table 8-10: Pearson’s correlation coefficients for the relationship between BW2nbn and ABW2nbn and
TOAE magnitude and suppression in 2 frequency bands after temporally windowing (10-20ms)_____181
Table 8-11: Mean and standard deviations for various parameters derviedfrom DPOAEs_________182
Table 8-12: Pearson’s correlation coefficients for relationship between DPOAE measures and auditory
filter shape bandwidth (and change in bandwidth) during contralateral N B N___________________183
Table 8-13: Pearson’s correlation coefficients for the relationship between parameters describing the
Table 8-14: Correlation coefficients for the relationship between parameters describing the filter shape
measured during 2kHz contralateral NBN and TOAE magnitude and suppression________________ 184
Table 8-15: Pearson’s correlation coefficients for the relationship between parameters describing the
filter shape measured during 500Hz contralateral NBN and TOAE magnitude and suppression._____185
Table 8-16: Pearson's correlation coefficients for the relationship between parameters describing the
filter shape measured during 1kHz contralateral NBN and TOAE magnitude and suppression in two
frequency bands.______________________________________________________________ 186
Table 8-17: Correlation coefficients for the relationship between the filter shape parameters measured
during 2kHz contralateral NBN and TOAE magnitude and suppression in two frequency bands. ____186
Table 8-18: Correlation coefficients for the relationship between the filter shape parameters measured
during 500Hz contralateral NBN and TOAE magnitude and suppression in two frequency bands. 187
Table 8-19: Correlation coefficients for the relationship between the filter shape parameters measured
during 1kHz contralateral NBN and TOAE suppression in two frequency bands after windowing ___188
Table 8-20: Correlation coefficients for the relationship between the filter shape parameters measured
during 2kHz contralateral NBN and TOAE suppression in two frequency bands after windowing____189
Table 8-21: Correlation coefficients for the relationship between the filter shape parameters measured
during 500Hz contralateral NBN and TOAE suppression in two frequency bands after windowing 189
Table 8-22: Comparison o f the values o f the parameters describing the shape o f the auditory filter during
contralateral 1kHz NBN in subjects with and without SOAEs________________________________ 190
Table 8-23: Comparison o f the values o f the parameters describing the shape o f the auditory filter during
contralateral 2kHz NBN in subjects with and without SOAEs________________________________ 191
Table 8-24: Comparison o f the values o f the parameters describing the shape o f the auditory filter during
contralateral 500Hz NBN in subjects with and without SOAEs_______________________________191
Table 8-25: Pearson correlation coefficients o f DPOAE magnitude measurements with parameters
describing auditory filter shape during contralateral 1kHz NBN______________________________192
Table 8-26: Pearson correlation coefficients o f DPOAE magnitude measurements with parameters
describing auditory filter shape during contralateral 2kHz NBN_______________________ 193
Table 8-27: Pearson correlation coefficients o f DPOAE magnitude measurements with parameters
describing auditory filter shape during contralateral 500Hz NBN_____________________________193
Table 8-28: Pearson correlation coefficients for the realtionship between the suppression ofTOAEs in the
2kHz region and the tone in noise threshold during contralateral 1kHz NBN____________________195
Table 9-1: TOAE suppression results including Pearson correlation coefficients for relationship with 3dB
bandwidth o f 2kHz auditory filter. _____________________________________________________203
Table 9-2: Pearson’s correlation coefficients for the relationship between the 3dB bandwidth o f the 2kHz
auditory filter and TOAE magnitude and suppression in 2 frequency bands_____________________203
Table 9-3: Pearson’s correlation coefficients for the relationship between the 3dB bandwidth o f the 2kHz
auditory filter and TOAE suppression in 2 frequency bands after temporally windowing (10-20ms)__204
Table 9-4: Pearson’s correlation coefficients for relationship between DPOAE measures and 2kHz
auditory filter bandwidth ____________________________________________________________205
Table 9-5: Pearson’s correlation coefficients for the relationship between parameters describing the
Table 9-6: Pearson’s correlation coefficients for the relationship between parameters describing the
2kHz auditory filter shape and TOAE magnitude and suppression in two frequency bands._________206
Table 9-7: Pearson’s correlation coefficients for the relationship between parameters describing the
2kHz auditory filter shape and TOAE suppression in two frequency bands after windowing.________207
Table 9-8: Comparison o f the values o f the parameters describing the shape o f the 2kHz auditory filter in
subjects with and without SOAEs______________________________________________________207
Table 9-9: Pearson correlation coefficients o f DPOAE magnitude measurements with parameters
describing 2kHz auditory filter shape___________________________________________________208
Table 9-10: Summary o f TOAE suppression results________________________________________209
Table 9-11: Pearson correlation coefficients for the relationship between TOAE suppression tests and
2kHz auditory filter parameters_______________________________________________________209
Table 15-1: Correlation coefficients and significance values for the relationship between DP suppression
(contralateral 1kHz tone) at various F2 frequencies and auditory filter shape parameters - DPGram_258
Table 15-2: Correlation coefficients and significance values for the relationship between DP suppression
(contralateral 1kHz tone) at various F2 frequencies and auditory filter shape parameters - Fine Structure
around 1kHz______________________________________________________________________ 258
Table 15-3: Pearson’s correlation coefficients and significance values for the relationship between DP
suppression (contralateral 1kHz narrowband noise) at various F2 frequencies and auditory filter shape
parameters - DPGram ______________________________________________________________259
Table 15-4: Pearson’s correlation coefficients and significance values for the relationship between DP
suppression (contralateral 1kHz narrowband noise) at various F2 frequencies and auditory filter shape
Table of Figures
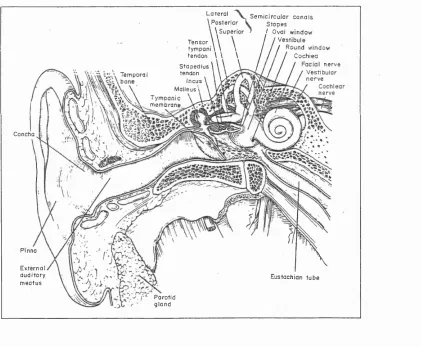
Figure 2-1: The structure o f the ear in humans_____________________________________________17
Figure 2-2: Transfer function o f the middle ear_____________________________________________18
Figure 2-3: Cross-section o f the cochlea__________________________________________________20
Figure 2-4: Schematic diagram o f the cochlear d u c t________________________________________20
Figure 2-5: Cross-section o f the organ o f Corti_____________________________________________21
Figure 2-6: Tuning curves from guinea pig cochlea in various conditions_______________________24
Figure 2-7: Tuning curves for inner and outer hair cells______________________________________25
Figure 2-8: Change in tuning o f the auditory nerve fibre with kanamycin administration___________26
Figure 2-9: Connections o f hair cells to afferent nerve fib re s_________________________________ 27
Figure 2-10: Pathway o f the afferent auditory pathways_____________________________________ 29
Figure 2-11: The efferent auditory pathways.______________________________________________30
Figure 2-12: Schematic diagram showing the course o f the auditory efferent system to the cochlea, and
the afferent system_________________ 34
Figure 2-13 .Diagram o f a transverse section through the brainstem showing position o f sections_____38
Figure 2-14: Rate Intensity functions for an auditory nerve fibre in response to a tone, with and without
electrical stimulation o f the COCB. _______ 48
Figure 2-15: Effect o f COCB electrical stimulation on inner hair cell tuning curve________________56
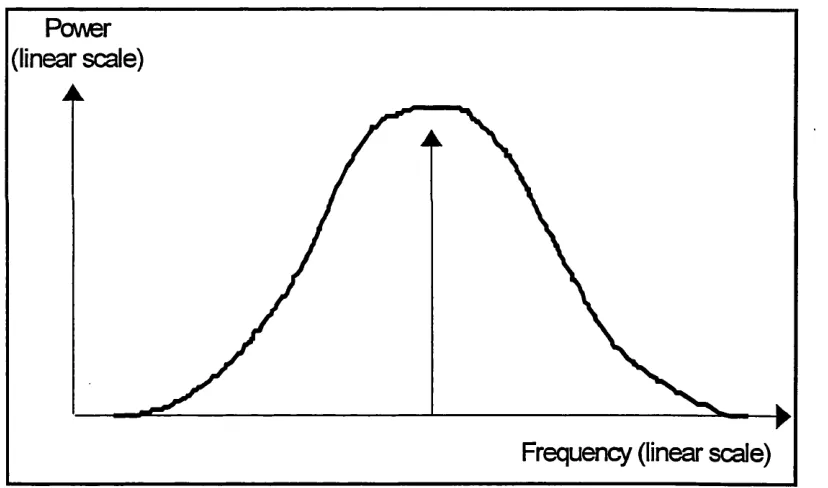
Figure 3-1: Approximation o f auditory filter shape_________________________________________ 60
Figure 3-2 Arrangement o f notched-noise and probe tone in time______________________________ 63
Figure 3-3: Frequency bands o f the 5 notched-noise maskers around the probe tone at 1kHz________65
Figure 3-4: Layout ofTDT modules_____________________________________________________ 71
Figure 3-5: Schematic diagram o f equipment set up to produce contralateral noise_________________ 72
Figure 3-6: Repeatability o f bandwidth measure o f auditory filte r_____________________________ 78
Figure 3-7: "Non-linear" click stimuli from IL 0 9 2_______________________________________ 80
Figure 3-8: Equivalent attenuation method o f calculating OAE suppression with sample data 82
Figure 3-9: Repeatability o f TOAE suppression measuredfrom 8 subjects on two separate occasions. _83
Figure 3-10: Example Distortion Product Gram _ _ ________________________________________ 85
Figure 3-11: Repeat DPGram measurements on the same ear showing good inter-test reliability. ____86
Figure 5-1: Graph o f TOAE Suppression - Mean and 95% Confidence Interval___________________97
Figure 5-2: Scatterplot o f suppression o f click evoked TOAEs by contralateral white noise versus 3dB
bandwidth o f auditory f il te r_______________ 98
Figure 5-3: Scatterplot o f suppression o f click evoked TOAEs by a 1kHz tone versus 3dB bandwidth o f
the auditory filter ____________________ 98
Figure 5-4: Scatterplot o f the suppression o f 1kHz tone evoked TOAEs by white noise versus 3dB
bandwidth o f the auditory f il te r________________________________________________________99
Figure 5-5: Scatterplot o f suppression o f 1kHz tone evoked TOAEs by 1kHz tones versus 3dB bandwidth
o f the auditory filte r_______________ 99
Figure 5-6: Boxplot comparing the 3dB bandwidth o f the auditory filter in subjects with and without
Figure 5-7: Scatterplot o f the the 3dB bandwidth o f the auditory filter vs. the suppression o f click evoked
TOAEs by contralateral white noise, showing the subjects with SOAEs and those without SOAEs____103
Figure 5-8: Mean suppression of2fl-f2 distortion product by contralateral 1kHz tone - DPGram___106
Figure 5-9: Mean suppression o f the 2fl-f2 distortion product by contralateral 1kHz tone - fine structure
around 1kH z______________________________________________________________________ 108
Figure 510: Mean suppression of2flf2 distortion product by contralateral narrowband noise
-DPGram__________________________________________________________________________109
Figure 5-11: Mean suppression o f 2fl-f2 distortion product by contralateral narrow band noise - Fine
structure around 1 kH z______________________________________________________________ 111
Figure 5-12: Histogram o f the Symmetry Index o f the auditory filter shape in 39 normal subjects____112
Figure 5-13: Graphs showing the frequencies o f significant correlation between suppression o f DPs and
auditory filter shape parameters- DPGram______________________________________________ 118
Figure 5-14: Graphs showing the frequencies ofsignificant correlations between DP suppression and
auditory filter shape parameters- fine structure around 1kHz________________________________ 119
Figure 6-1: Stimulus arrangement for testing efferent latency________________________________ 133
Figure 6-2: Comparison o f suppression values for the total response data and the windowed data___139
Figure 6-3: Suppression results from the windowed data o f tests 1, 2 and 5_____________________140
Figure 6-4: Suppression levels for the windowed data between 26 and 40ms, from tests 1-5.________141
Figure 7-1: Histogram showing the distribution o f ABW^, and the normal distribution. ___________152
Figure 7-2: Mean auditory filter shape from 24 normal subjects with and without contralateral white
noise _ _ ____ 153
Figure 7-3: Scatterplot o f the relationship between the suppression o f click evoked OAEs by white noise
and the 3dB bandwidth o f the auditory filter during contralateral noise. _______________________155
Figure 7-4: Scatterplot o f the relationship between the suppression o f click evoked OAEs by a 1kHz tone
and the 3dB bandwidth o f the auditory filter during contralateral noise________________________156
Figure 7-5: Scatterplot o f the relationship between the suppression o f 1kHz tone evoked OAEs by white
noise and the 3dB bandwidth o f the auditory filter during contralateral noise___________________156
Figure 7-6: Scatterplot o f the relationship between the suppression o f click evoked OAEs by a 1kHz tone
and the 3dB bandwidth o f the auditory filter during contralateral noise________________________157
Figure 8-1: Mean and 95% confidence intervals for 1kHz auditory filter measured during various
contralateral stimuli conditions._______________________________________________________174
Figure 8-2: TOAE magnitude in Vi octave around 2kHz compared to 3dB bandwidth o f 1kHz auditory
filter measured during contralateral 500Hz narrow band n o ise______________________________179
Figure 16-1: Scatterplots o f the relationship between 4 measures o f TOAE suppression and the 3dB
A b strac t
The auditory efferent system consists of two populations of fibres. The lateral system connects with the inner hair cells and the medial system connects with the outer hair cells. Past work has suggested that the efferent system may act via the action of the outer hair cells to control cochlear mechanics and, in doing so, contribute to the high degree of frequency selectivity observed in the auditory system. This hypothesis has not, in the past, been fully examined in humans.
In this study, normally hearing human subjects were examined to see if there was a link between efferent
I
activity and frequency selectivity. The first experiment investigated whether there was a link between j
efferent action and frequency selectivity at 1kHz. Efferent activity was assessed using the contralateral suppression of transient and distortion product otoacoustic emissions (OAEs). Emissions were evoked by tones and clicks and suppressed by contralateral white noise, narrow band noise and tones. The ! suppression was examined in specific frequency bands as well as over the entire response range. I Frequency selectivity was estimated using the notched-noise masking technique and ‘roex’ filter shape
I modelling. No conclusive relationship was found.
! The possibility that the efferent system might play a part in frequency selectivity only when activated by [ the contralateral ear was considered by testing the auditory filter during contralateral white noise. No ■ consistent relationship was found between efferent function, and either the 1kHz filter shape measured ! during contralateral stimulation, or the change in filter shape. However, contralateral white noise did '■ cause a significant broadening of the 1kHz filter via what was thought to be the action of the efferent
system.
The timing of the onset of the contralateral efferent effect was examined using OAEs in order to allow stimulus timings to be set so that the efferent system would be effective during filter shape testing. The onset latency was found to be between 17 and 20ms.
Further analysis of the auditory filter shape during contralateral stimulation was undertaken by stimulating the contralateral ear with narrowband noises at 500Hz, 1kHz and 2kHz. This also provided no clear proof of a link with efferent activity.
Finally, the filter shape at 2kHz was considered. Significant relationships emerged between the shape of the filter and the activity of the efferent system in this region. This implied that efferent control of frequency selectivity is not constant over the length of the basilar membrane.
1. Introduction
The auditory efferent system consists of an extensive network o f neural fibres that extend from the brainstem to the organ of Corti in the cochlea. The importance o f these pathways lies in the fact that responses to auditory signals can be modified before they reach the brain. Although the efferent system has been the subject o f numerous studies, its exact function is still not clear. It seems unlikely that such a comprehensive system of fibres would be redundant. Physiological and behavioural evidence suggests that its role may be to protect the ear against damage from loud sounds (Rajan 1992) or to aid in localising (Fisch 1970) or attending to sounds (Giard et al. 1994). It has also been suggested that it may help in detection of sounds in background noise. It is this latter role that is to be investigated in this thesis.
The human ear exhibits a high degree o f frequency selectivity. In other words, it is able to pick out particular frequencies from a signal successfully. Energy input is required in order to enable the system to behave in this manner. The outer hair cells in the cochlea seem to be involved in these active processes. The efferent system makes connections to the outer hair cells. Thus, the hypothesis behind this thesis is that the efferent system may control, or at least be involved in, frequency selectivity via the action of the outer hair cells.
Past work has found that efferent activity is implicated in discrimination o f signals in noise, both in animals (Kawase et al. 1993; Winslow and Sachs 1988) and in humans (Micheyl and Collet 1996). The tuning of the auditory system in animals can be measured directly, at the level of the nerve or basilar membrane. In humans, the task is less straightforward, although it is possible to get an estimation of the shape of the auditory filter which is representative of the frequency selectivity present in the system. There have however, been no studies where the frequency selectivity has been examined in this manner and related to the functioning o f the auditory efferent system in humans.
G
Q
2. Background Theory
2 .1 The A natom y and P hysio logy o f the Hum an E ar
In this section, the anatomy and physiology o f the ear are discussed, with the emphasis
towards those aspects that are relevant to frequency selectivity.
The structure of the ear can be divided into 3 major sections: the outer, middle and inner
ear. Figure 2-1 shows this basic structure.
Figure 2-1: The structure of the ear in humans (from Pickles 1988)
Temporal
Concha
L a te r a l S e m i c ir c u la r c a n a l s y P os te ri or W S t a p e s
\ S u p e r i o r J / Oval window
T e n so r \ \ \ / / Vestibule
tympani \ \ \ I I I ^®^nd window
ten don \ \ \ I I I Coch iea
S ta p e d iu s \ \ \ \ ___I I I / n er v e
tendon \ \ / / / / Ve stibul ar
Incus \ \ \ sSnm A\ / / n e r v e
Malleus i
\
f r ¥ ' r\ \ \% '-\\
VJvrVsvm
Mi l - u V / ' ■ V O M . m e m b r a n e
\\v 'V" •> ,• - . V -... *
Pi nna
Ex terna
Eusta chia n t u b e
a u d i t o r y m e a t u s
P aro ti d g la n d
2.1.1 Outer and Middle Ear
The outer ear consists o f the pinna, narrowing to form the concha and external auditory
meatus. The structure o f the resonant cavity thus formed, causes a relative increase in
shape of the pinna also provides clues as to the direction of the sound source. Spectral modulation occurs due to interference of components of the acoustic wave reflected from the walls of the pinna. This modulation varies with position of the source and thus provides localising clues.
The sound wave travels along the external auditory meatus to the tympanic membrane. From here the sound is transmitted to the cochlea via movement o f the ossicular chain which is composed of three bones: the malleus, incus and stapes, which are linked together. The stapes is attached to the oval window o f the cochlea. The middle ears acts as an impedance coupler between the low impedance of the air in the external auditory meatus and the higher impedance o f the fluids in the cochlea, preventing large transmission losses due to reflection.
Different frequencies are transmitted by the middle ear with different efficiencies. The transfer function can be measured by comparing the pressure at the tympanic membrane to that at the cochlear duct, behind the oval window (Nedzelnitsky 1980, see Figure 2-2).
Figure 2-2: Transfer function of the middle ear (Nedzelnitsky, 1980)
40 r 3 0
-20
--10
- 2 0
1000
Frequency (H z)
100 0 0
100
has a greater effect at lower frequencies because the displacement o f the air is greater and therefore the forces are also greater.
The middle ear muscles, the stapedius muscle and the tensor tympani muscle, also have
some control over the amount o f energy transmitted through the middle ear. The stapedius muscle is connected to the neck o f the stapes and acts to stiffen the ossicular chain and the tympanic membrane. It is innervated by the facial (VHth) cranial nerve. The tensor tympani muscle is attached to the malleus and contraction again causes stiffening of the ossicular chain and the tympanic membrane. It is innervated by the trigeminal (Vth) cranial nerve. Activation of the middle ear muscles affects primarily the transmission o f frequencies below l-2kHz. The reflex is activated by loud sounds (>75dBSL), vocalisation, general movement, tactile stimulation or voluntarily in some cases.
There are a number o f hypothesised functions o f the reflex: 1) protection of the inner ear against loud sounds; 2) stabilisation of cochlea input at low frequencies for intensities o f up to 20dB above reflex threshold; 3) reduction in the masking o f high frequency sounds by those o f low frequency, helping in the perception o f complex stimuli; 4) reduction in the effect of middle ear resonances on the frequency response o f the middle ear.
2.1.2 Cochlea
2.1.2.1 Structure
The cross-sectional structure o f the inner ear or cochlea is shown in Figure 2-3.
Figure 2-3: Cross-section of the cochlea (from Pickles 1988)
Reissner's membrane
Scala vestibuli Stria vascularis Spiral limbus
Tectorial membrar
Spiral prominence
Spiral
ganglion Organ of Corti
Scala tympani MODIOLUS
Basilar membrane
The scala vestibuli and the scala tympani are filled with perilymph and are connected at
the apex o f the cochlea at the helicotrema (see Figure 2-4).
Figure 2-4: Schematic diagram of the cochlear duct (from Pickles 1988)
S c a la vestibuli
Stapes
S cala media
window
Round
window Helicotrema
'Scala Tympani
The inner compartment o f the cochlea is called the scala media. It is filled with
endolymph is highly positive (+80mV) whereas the perilymph in the other two
compartments is at 5-7mV relative to the plasma. The positive potential o f the
endolymph is thought to arise from a N a+/K" ATPase ion pump in the stria vascularis.
The perilymph is very similar to normal extracellular fluid.
The scala vestibuli opens onto the oval window, which is connected to the stapes
footplate. Thus, movement o f the stapes produces displacement o f the oval window and
therefore the fluid in the scala vestibuli. The movement o f fluid is transmitted via the
scala tympani to the round window. This flow o f fluid causes a displacement in the
basilar membrane. The structure o f the organ o f Corti showing the basilar membrane is
shown in Figure 2-5.
Figure 2-5: Cross-section of the organ of Corti (from Pickles 1988)
Tectonai m em brane
Outer hair cells
Reticular lamina Inner hair cefl^ Inner spiral
sulcus
Space' Inner spiral
bundle
(efferent) |r P illa r s % ^ uelw Tunnel I of Corti
Cells of Inner radial
fibres ; (afferent)
Wa
S-tabenular opening
■Myelinated Tunnel crossing fibres (efferent) nerve fibres
Outer spiral fibres (afferent)
Supporting (Deiters') cells
Two types o f receptor cell are found in the organ o f Corti; the inner and outer hair cells.
There are 3,500 inner hair cells in one row and 12,000 outer hair cells in 3-5 rows. The
hair cells have many fine stereocilia attached. The longest o f the outer hair cell
stereocilia are connected to the tectorial membrane, which is attached only at one end.
The hairs o f the inner hair cells are fitted loosely into a groove called H enson’s stripe on
the lower surface o f the tectorial membrane. Thus, as the basilar membrane is deflected
relative to the tectorial membrane there is a shearing force applied to the stereocilia.
hi response to this movement, fC ion channels are opened and closed allowing release
o f Kf from the stereocilia into the cell body. The resting potential o f the inner hair cells
to the K+ flow, triggers the release of transmitter from the base of the hair cell, instigating an action potential in the afferent auditory nerve fibres which end there. The inner hair cells’ function therefore seems to be the conversion o f acoustic mechanical stimuli into electrical impulses, which are then transmitted to the cortex. The function of outer hair cells is not yet certain.
The afferent and efferent nerve fibres make connections at the base o f the hair cells and provide a link to the higher centres of the brain. These pathways are described in section 2.1.3.
2.1.2.2 Transient Cochlear and Neural Potentials
Three different cochlear potentials can be recorded at the round window or across the cochlear partition, in response to stimuli:
(a) The cochlear microphonic
The cochlear microphonic (CM) is believed to arise from the current flow mainly through the outer hair cells, in response to acoustic stimulus. This a.c. response approximately follows the stimulus.
(b) The summating potential
A d.c. shift in the average potential can be measured for the duration o f the stimulus which is called the summating potential (SM). The shift can be positive or negative in direction and is thought to be derived from the d.c. flow from both the outer and inner hair cells.
(c) The compound action potential
2.1.2.3 Frequency Selectivity in the Cochlea
The term frequency selectivity refers to the ability to resolve sinusoidal components from a complex signal. The high degree o f frequency selectivity present in the auditory system is essential in order to distinguish different sounds successfully. The human ear is capable o f resolving two frequencies greater than 10% of the centre frequency away from each other. However, when tones are presented successively we are able to detect much smaller differences in frequency (as low as 0.2-0.3% at 1kHz). This is referred to
as frequency discrimination.
(a) Basilar Membrane Mechanics
Incoming acoustic signals are transferred to the inner ear, as a hydromechanical wave, where they are coded according to frequency for nerve transmission. Studies, using the Mossbauer effect, o f the motion o f the basilar membrane (BM) during travelling wave displacement, have shown that each portion of the BM peaks in displacement at a particular frequency (Sellick et al. 1982). Frequencies just outside a certain band are many times less likely to have this effect and thus a highly tuned bandpass filter is indicated.
This variation o f resonant frequency with position along the cochlear partition is brought about by the changes in stiffness and inertia. At the base o f the cochlea the system is predominantly stiffness limited and at the apex, it is mostly mass limited. The travelling wave moves from the base towards the apex and grows in amplitude because the stiffness limited system moves first. Resonance occurs when the stiffness limitation equals the mass limitation. High frequencies resonate at the base because the inertial forces are higher. The wave slows down approaching the point o f resonance and therefore damping occurs effectively, thus reducing the amplitude o f the wave beyond this point.
seen. For example, Sellick et al. (1982) have shown that after death, the cochlea is only broadly tuned (see Figure 2-6).
Figure 2-6: Tuning curves from guinea pig cochlea in various conditions
9 0
80
70
6 0
50
AP threshold at 18 kHz 4 0
• 1 3 - 3 4 dB SPL
0 5 3 - 8 3 dB SPL 30
■ post mortem
20
20
Frequency (kHz)
Thus, when alive, both the sensitive and the broadly tuned characteristics are effective. The active mechanism suggested would act as an amplifier, increasing the energy o f the travelling wave and thus sharply tuning the response. It would also seem likely that the production o f otoacoustic emissions (see section 2.2) is linked with this active process. The active mechanism is discussed further in section (d).
(b) Tuning of hair cells
The responses of both outer and inner hair cells to different frequencies are shown in
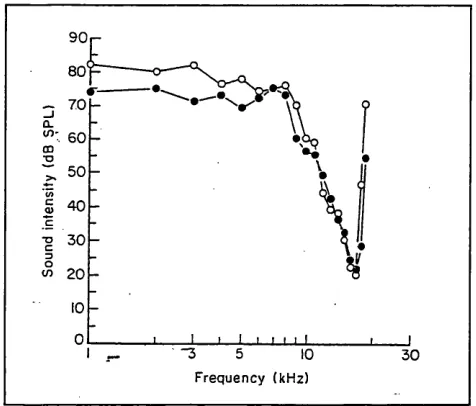
Figure 2-7: Tuning curves for inner (open circles) and outer (filled circles) hair cells (Cody and Russell 1987)
90
80
50
40
"3 30
F r e q u e n c y (k H z)
(c) Tuning of auditory nerves
The frequency selectivity o f the auditory nerve shows similar characteristics to that of the basilar membrane and the hair cells. Individual fibres are sharply tuned to a particular characteristic frequency. The tuning curves become increasingly asymmetric at higher frequencies. As with the hair cell and basilar membrane tuning curves, in the asymmetric cases, the high frequency tail of the curve is very steep whereas the lower tail gradually slopes off. Increase in stimulus intensity causes an increase in the firing rate o f the fibres, which follows a sigmoidal relationship. For lower frequency tones (below about 5kHz) there is also phase locking to the response. The neural coding o f pitch seems to depend on both temporal and spectral features i.e. both the patterns of firing o f the neurons and the distribution o f firing across different neurons play a part.
(d) Active Processes and Outer Hair Cells
cells, have indicated that the outer hair cells play a crucial role in the maintenance o f normal tuning. Work by Robertson and Johnstone (1979), using this technique, showed that the auditory nerve tuning curves lost sensitivity and sharpness, and shifted to a lower frequency, when the outer hair cells were lost (Figure 2-8).
Figure 2-8: Change in tuning of the auditory nerve fibre with kanamycin
administration, which acts on the outer hair cells. From Robertson and Johnstone (1979), adapted by Pickles (1988)
100
K anamycin
80
6 0 co
Norm al
4 0
20
20 30
F requency (k H z )
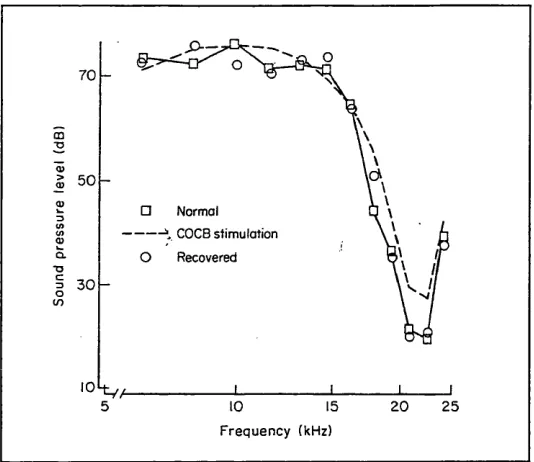
Electrical stimulation o f the crossed olivocochlear bundle (COCB) in guinea pigs and cats was also found to degrade the tuning curves o f inner hair cells (Brown et al. 1983) and o f the auditory nerve (Guinan and Gifford 1988b). The COCB predominantly makes connections with the outer hair cells, and therefore this evidence again indicates that the latter are important in frequency selectivity.
Russell and Nilsen (1997) estimated the location of the amplifier o f cochlear mechanics in guinea pigs to be a 1.25nm portion of the basilar membrane when measuring non linear, saturating vibrations at 15kHz. It has been suggested though, that this mechanism may not contribute evenly to peripheral tuning along the cochlear partition. Human auditory filters, at close centre frequencies were measured using the roex(p,r) method (see section 3.1) and were found to be very different from each other (Fagelson and Champlin 1997).
Therefore, in summary, it is clear that the shape of the tuning characteristics o f the hair cells and the auditory nerve are very similar to that o f the basilar membrane. It is likely that the overall frequency selectivity o f the auditory system is determined at the level of the basilar membrane. Current evidence suggests that the fine-tuning observed is due to an actively driven feedback loop, at the level o f the basilar membrane, which is accomplished via the motile properties o f outer hair cells.
2.1.3 Auditory Neural Pathways
The afferent pathway relays the electrical impulses from the cochlea to the brain. Each ear has about 30,000 fibres which connect mostly with the inner hair cells (type I fibres). One hair cell is innervated by many fibres. Only 5-10% o f fibres (type II) connect with outer hair cells (see Figure 2-9).
The efferent nerve fibres carry nerve impulses descending to the cochlea. This means that higher centres are able to have some control over the cochlea and therefore the incoming information. The efferent fibres make connections with the outer and inner hair cells. Each outer hair cell has many efferent nerve connectors, with those at the base having more than those at the apex. The projections to the inner hair cells synapse with the afferent fibres rather than directly with the hair cell itself. The fibres terminating at the outer hair cells tend to have large endings, which cover the base o f the hair cell as well as the afferent terminals.
2.1.3.1 The Afferent Pathways
Figure 2-10: Pathway of the afferent auditory pathways. Cross section through the junctional zone between the pons and the medulla. From Noback and Demarest (1981)
M edia l g e n i c u l a t e b od y
Inferior c o l l i c u l u s
Lateral l e m n i s c u s
Nu. o f lateral l e m n i s c u s
Lateral l e m n i s c u s Dorsal c o c h l e a r nu.
F a c i a l n u .
ven tra l c o c h l e a r nu.
C o c h le a r n.
S u p e r io r olivary nu.
Primary au d it o r y
c o r t e x
Dorsal and in t e r m e d i a t e a c o u s t i c s t r ia e
2.1.3.2 The Efferent Pathways
The route o f the descending efferent pathways is shown schematically in Figure 2-11.
The efferent system will be discussed in greater detail in section 2.3.
Figure 2-11: The efferent auditory pathways. From Noback and Demarest (1981)
T r a n s v e r s e gyri
o f H e s c h l
M edia l g e n i c u l a t e
bo d y Inferior c o l l i c u l u s
Nu. o f lateral l e m n i s c u s
O l i v o c o c h l e a r b u n d le
Dorsal c o c h l e a r nu.
Ventral c o c h l e a r nu.
V e s t i b u l o c o c h l e a r
a n a s t o m o s i s
L atsra I
s j v i e o i a ^ t rap e z o id
Su p erior olivary
2.2 Otoacoustic Emissions
2.2.1 Existence o f otoacoustic emissions
The discovery that the cochlea actually emits sound as well as receiving it has revolutionised research into hearing. Gold had suggested in 1948 that a feedback mechanism, consisting o f both a mechanical-to-electrical and an electrical-to-mechanical stage, was the source of the high degree o f frequency selectivity exhibited in the cochlea. However, it was not until Kemp (1978) demonstrated that energy emitted by the human cochlea could be recorded in the ear canal, that there was more interest in Gold’s hypothesis. These sounds are called otoacoustic emissions (OAEs). The argument that active processes control the mechanical state o f the cochlea, gathered further weight with the discovery that outer hair cells change shape as a voltage is applied (Brownell et al. 1985). In addition, they seemed to be the source o f the reverse transduction process (electrical-to-mechanical energy) which could affect motion of the basilar membrane (Mountain and Hubbard 1989).
The exact mechanisms, which lead to the production o f OAEs from active processes within the cochlea, are still to be elucidated. However, OAEs are proving to be a useful tool in analysing the details o f cochlear mechanics. The measurement o f OAEs has the advantage o f being a non-invasive objective procedure that can easily be applied to humans as well as animal models. The test has the benefit o f examining only the sensory elements o f the hearing pathway, without confounding the results with information about the neural pathways.
OAEs are very sensitive to physiological changes in the cochlea. Therefore, even mild pathological conditions can abolish OAEs entirely. Many problems with hearing, such as those due to noise exposure, may involve damage to the actively assisted vibration o f the basilar membrane and therefore OAEs provide a valuable insight into the cochlea in these cases. Thus, the normal and the abnormal cochlea can be studied using OAEs in order to further our understanding of the exact mechanisms involved in the hearing process (for review see Probst et al. 1991).
2.2.1.1 Transient otoacoustic emissions (TOAE)
These emissions are elicited by a brief stimulus, usually a click. The response emitted by the ear is then recorded, averaged and frequency analysed using a fast Fourier transform (FFT) procedure.
It appears that all normally hearing adults would exhibit measurable TOAEs if tested in ideal conditions (Probst et al. 1991). However, with hearing losses greater than 25-30dBHL the TEOAE is unrecordable, with the most important frequency region being 1-2kHz for TOAE generation (see Probst et al. 1991 for review). The latency o f the emissions is related to their frequency components. Lower frequencies are emitted later than higher ones, with the frequencies around 1kHz being emitted after about 10ms (e.g. Kemp and Chum 1980). The growth o f emission amplitude with stimulus level is approximately linear until stimulus levels o f greater than about 20-30 dBSL, at which point, the response saturates (e.g. Kemp 1978).
2.2.1.2 Spontaneous otoacoustic emissions
Spontaneous otoacoustic emissions (SOAEs) are acoustic signals generated by the cochlea without any stimulus. They are narrow band emissions and can be found in approximately a third of normally hearing ears (see Probst et al. 1991 for review). SOAEs are most commonly found in the vicinity o f l-2kHz, although this may be influenced by the transfer function of the middle ear, which is best in this frequency range (Kemp 1980). SOAEs can be measured directly with no external stimulus. However, in practice it is more convenient, since the response is more robust, to measure the SOAEs emitted after a click stimulus. In this situation the SOAEs are synchronised to the stimulus and are therefore often called synchronised spontaneous otoacoustic emissions (SSOAE). SOAEs appear to be very stable in frequency with time, and therefore it would seem likely that non-uniformities of some type at distinct points o f the organ o f Corti may lead to their generation.
2.2.1.3 Distortion product otoacoustic emissions
consists o f two tones, fi and f2 (primary frequencies), where fi<f2, combination tones are
produced. The most common DPOAE to study because it is usually the strongest, is that at a frequency o f 2fr-f2, the cubic distortion tone.
DPOAEs have advantages when studying the details of cochlear mechanics in that the place that the response originates is a localised area o f the cochlea. There may be more than one source of DPOAEs on the basilar membrane (Whitehead et al. 1992). Much of the DPOAE energy is thought to come from the region around the travelling wave peaks o f the stimuli (fj and f2) and probably more predominantly from the region o f f2 (Brown
and Kemp 1984). It is thought that the source may be in the region o f maximum overlap o f the travelling wave envelopes of the 2 primary tones, which would place it near to f2.
A second source may be from the DP site (Brown et al. 1996). The exact mechanism o f DP production is not defined. However, it is certain that the situation is complex, and the interference (constructively or destructively) of the overall emission with emissions from any part of the cochlea, will affect the outgoing signal. There are therefore many influences on the emitted response.
2.2.1.4 Stimulus-frequency otoacoustic emissions
Stimulus frequency otoacoustic emissions (SFOAEs) can be generated by presentation o f a low level tonal stimulus. The response is a steady state emission o f additional energy at the same frequency as the stimulus. There has been much less research work on this class o f emissions in comparison with other types, especially in pathological ears (for review see Probst et al. 1991). For this reason, SFOAEs were not tested in this study and therefore are not discussed in detail.
2.2.2 How OAEs have been used to study the auditory efferent system
2.3 The Auditory Efferent System
2.3.1 Detailed Anatomy
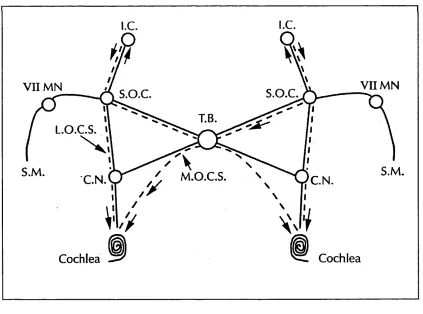
As early as 1893 (Held), it was known that efferent neural pathways relayed information from the brain to the cochlea. However, the anatomy of the pathway was described in greater detail by Rasmussen (1946). The efferent input to the cochlea consists o f the olivocochlear bundle, which passes from the superior olivary complex structures on both sides o f the brain. The contralateral fibres (crossed olivocochlear bundle, COCB) cross over the dorsal surface o f the brainstem, below the floor o f the fourth ventricle. The crossed and the uncrossed (ipsilateral) fibres then join together. Before leaving the brainstem, some fibres end in the cochlear nuclei and the rest travel along the vestibular nerve until they transfer into the auditory nerve and enter the cochlea (Figure 2-12).
Figure 2-12: Schematic diagram showing the course of the auditory efferent system (broken line) to the cochlea, and the afferent system (solid line).1
i.e . i.e .
V I I M N V I I M N
X S.O.C. S.O.C.
T.B. L.O.C.S.
X
S.M .
C.N. C.N.
Cochlea Cochlea
By using transport techniques, involving radioactively labelled amino acids, two populations of olivocochlear neurons have been found (Guinan et al.
1983):-i) The lateral olivocochlear neurons (LOC) (54% o f the total number of
olivocochlear fibres) are mainly (approximately 90%) ipsilateral and synapse with cochlear afferent neuron dendrites close to the inner hair cells. They are thin, unmyelinated and originate from the lateral superior olivary complex.
ii) The medial olivocochlear neurons (MOC) (40% of the total population)
project mainly contralaterally (80%) from the region around the medial nuclei of the superior olivary complex and terminate beneath the outer hair cells of the organ o f Corti. These are large, myelinated fibres.
Most efferent units were found, in the cat, to have binaural inputs (Liberman 1988).
This structure suggests that it may be possible for the efferent system to exert control over both the hair cell and the transmission o f the impulse to the afferent nerve. Moreover, it would seem likely that these two very distinct populations of fibres would have different roles to play in the hearing process.
2.3.2 Physiology
Studies to evaluate the function o f this extensive pathway o f fibres have used electrical and acoustic stimuli to activate the efferent nerves in both animal and human subjects. This review o f the physiology o f the efferent system classifies current knowledge according to the effects that efferent activation has on different levels o f the auditory pathway. Firstly, the effects to the afferent responses and cochlear potentials will be discussed, followed by efferent induced otoacoustic emission changes.
2.3.2.1 Effects o f efferent activation on afferent responses and cochlear potentials
Kawase and Liberman (1993) found both a decrease and an increase in cochlear action potential (CAP) for tones masked with ipsilateral noise. The effect depended on frequency. Enhancement o f CAP in the cat was largest for tones from 8 to 16 kHz and suppression was largest for 2 to 8 kHz. Kawase et al. (1993) showed that discharge rates to a masked tone could be increased whilst the rates to the masker decreased, by the addition o f contralateral sound, indicating a role in signal discrimination.
Some other cochlear potentials are also affected by activation of the efferent system. An increase in the cochlear microphonic (CM) was observed under electrical stimulation in animals (Fex 1962; Gifford and Guinan 1987; Mountain 1980) and a drop in endocochlear potential (EP) was also found (Fex 1967; Gifford and Guinan 1987). The CM is thought to be produced predominantly by the outer hair cells and the stria vascularis is the presumed generator of the EP.