Archives • 2019 • vol.3 • 114-134
ANTIOXIDANT POTENTIALS AND HIGH-PERFORMANCE LIQUID
CHROMATOGRAPHY (HPLC) FINGERPRINTING OF LEAF EXTRACT OF
PEDILANTHUS TITHYMALOIDES
Falode J A
1,2*, Obafemi T O
3, Akinmoladun A C
2, Olaleye M T
2, Boligon A A
4, Athayde M L
41
Department of Biochemistry, Federal University, Oye-Ekiti, Ekiti State, Nigeria
2
Department of Biochemistry, Federal University of Technology, Akure, Ondo State, Nigeria
3
Department of Biochemistry, Afe Babalola University, Ado-Ekiti, Ekiti State, Nigeria
4
Phytochemical Research Laboratory, Department of Industrial Pharmacy, Federal University of Santa Maria, Build 26, Room 1115, Santa Maria, CEP 97105-900, Brazil
*john.falode@fuoye.edu.ng
ABSTRACT
Pedilathus tithymaloides is a medicinal plant whose rapid wound healing and anti-inflammatory properties had been documented. In the present study, high-performance liquid chromatography with diode-array detection (HPLC-DAD) was used to quantify the flavonoids, phenolic acids and carotenoids present in the methanol leaf extract of P. tithymaloides. The phytochemical screening and in vitro antioxidant assays were carried out by standard protocols. The phytochemical screening revealed the presence of tannins, flavonoids, alkaloids, terpenoids and cardiac glycosides; while saponins, phlobatannins, steroids and anthraquinones were absent. The contents of phenols and flavonoids in the extract were 1.56 µg/mg tannic acid equivalents (TAE) and 17.89 µg/mg quercetin equivalents (QE) respectively, while total antioxidant capacity was 327.53 mM/mg ascorbic acid equivalents (AAE). The leaf extract demonstrated a very good potentials in scavenging free radicals as shown in the 2,2-diphenyl-1-picrylhydrazyl (DPPH), 2,2-azinobis (3-ethylbenzothiazoline-6-sulfonic acid)(ABTS), hydroxyl (.OH), nitric oxide (.NO) radical scavenging activities, the lipid peroxidation, hemolytic, and anti-denaturation assays. The HPLC analysis revealed that flavonoids (quercetin, isoquercitrin, quercitrin, rutin and kaempferol), tannins (catechin and epicatechin), phenolic acids (gallic, chlorogenic, ellagic and caffeic acids) and carotenoids (Tocopherol, β-Carotene) are present in the extract of P. tithymaloides. The extract exhibited significant free radical scavenging and antioxidant potentials, these may be due to substantial amount of the constituent phytochemicals in the extract. The results of this work suggest that leaves of P. tithymaloides are promising sources of natural phytochemicals and antioxidants that can combat diseases related to oxidative stress caused by free radicals.
Introduction
Pedilanthus tithymaloides is a perennial succulent spurge (Sajeva and Costanzo, 1994), an erect shrub (Vardhana, 2008), the plant is known by the scientific name Pedilanthus tithymaloides. However, the genus Pedilanthus has been submerged into the genus Euphorbia, and is more correctly known by its new name {Euphorbia tithymaloides} (Steinmann, 2003).
P. tithymaloides has a large number of household names used by gardeners and the public. Among them are buck-thorn, cimora misha, Christmas Candle, Devil's Backbone, Fiddle Flower, ipecacuahana, Jacob's Ladder, Japanese Poinsettia, Jew's Slipper, Jewbush, Milk-Hedge, Myrtle-Leaved Spurge, Padus-Leaved Clipper Plant, Red Slipper Spurge, Redbird Cactus, Redbird Flower, Slipper Flower, Slipper Plant, Slipper Spurge, timora misha, and Zig-Zag Plant (Balfour, 1988; Spoerke and Smolinske, 1990; Nellis, 1997). In other parts of the world, it is known as gin-ryu (Japan); pokok lipan and penawar lipan (Indonesia); airi, baire, and agia (India); aperejo (Yoruba); sapatinho do diabo (Brazil); itamo real (Puerto Rico); pantoufle (France); and zapatilla del diablo (Mexico) (Quattrocchi, 1990; Torkelson, 1996).
P. tithymaloides is a medicinal plant applied to wounds for rapid healing (Waroonluk, 2010). The chemical analysis of its stems and leaves has identified kaempferol 3-O -β-D-glucopyranoside-6-(3-hydroxy-3-methylglutarate), quercitrin, isoquercitrin and scopoletin, which are phenolic and flavonoid compounds (Abreu et al., 2008). Previous studies reported an anti-inflammatory effect of the stem and leaves of P. tithymaloides in rats that induced paw edema by carageenan. In addition, an in vitro study showed that the extract could efficiently inhibit ROS (reactive oxygen species) and RNS (reactive nitrogen species) (Abreu et al., 2006). The chemical constituents isolated from P. tithymaloides studied by the broth micro-dilution method using Mueller-Hinton and RPMI-1640 media showed strong inhibition against Staphylococcus aureus, Bacillus subtilis, Pseudomonas aeruginosa and Escherichia coli (Vidotti et al., 2006).
Some other medicinal applications have been documented on the plant, the root is known to be a powerful emetic (Nellis, 1997). A proteolytic enzyme known as pedilanthain can be extracted from the plant's latex, and has been shown in experiments to be effective against intestinal worms and to reduce inflammation when ingested (Nellis, 1997). In 1995, a galactose-specific lectin was purified from the plant's latex, and indications are that it might be useful in combating diabetes mellitus (Van Damme, 1998; Nagda and Deshmukh, 1998). In folk medicine, tea has been brewed from the leaves which has been used to treat asthma, persistent coughing, laryngitis, mouth ulcers, and venereal disease (Nellis, 1997). Tea brewed from the root has been used as an abortifacient (Nellis, 1997). The latex has been used topically to treat calluses, ear ache, insect stings, ringworm, skin cancer, toothache, umbilical hernias, and warts (Nellis, 1997). None of these uses has been scientifically verified as effective (Nellis, 1997). In the West Indies, a few drops of the latex is added to milk and used as an emetic (Spoerke and Smolinske, 1990)
Materials and Methods
Plant MaterialThe plant used was Pedilanthus tithymaloides leaves were obtained from a farm settlement in Esa Oke, Osun state, Nigeria. These were authenticated in the herbarium of Botany Dept., University of Ibadan. They were washed thoroughly with distilled water and allowed to air dry. The air-dried leaves were pulverized and then subjected to solvent extraction
Chemical, apparatus and general procedures for HPLC
diode array detector and LC solution 1.22 SP1 software.
Methods Extraction
The ground leaves were put in a glass container and extracted with 80% methanol. The set up was left for about 72 hours and agitated about 24-hourly for the extraction of the bioactive components and then filtered. The filtrate was concentrated in a rotary evaporator, freeze-dried and stored in a refrigerator for further uses.
Phytochemical Screening
The extracts were screened for the presence of alkaloids, saponins, tannins, phlobatannins anthraquinones, steroids, terpenoids, isoprenoids, flavonoids and cardiac glycosides. (Sofowora, 2006; Edeoga, 2005; Harborne, 1992; Trease and Evans, 1996).
In-Vitro Antioxidant Assays
DPPH (1, 1, diphenyl 2-picryl hydrazyl) Radical Scavenging Assay
The antioxidant activity by DPPH assay was assessed using the stable free radical DPPH. 1 ml of various concentration of the extract and 1 ml of DPPH 0.1mM were pipetted to the test tube, and incubated in the dark at room temperature for 30 minutes. After incubation, absorbance was taken at 517 nm. Ascorbic acid was used as the standard for comparison. The percent DPPH radical scavenging capacity of the extract was calculated thus:
% DPPH radical scavenging = [(ctrl abs - sample abs)/ctrl abs] × 100.
The experiment was carried out in triplicate (Molyneux, 2004).
ABTS Radical Cation Decolorization Assay
ABTS constitutes a relatively stable free radical, which decolorizes in its non-radical form. The spectrophotometric analysis of ABTS•+ scavenging activity was determined according to the method of (Gülçin, Elias et al., 2006). In this method, an antioxidant is added to a pre-formed ABTS radical solution and after a fixed time period, the remaining ABTS•+ is quantified spectrophotometrically at 734 nm. ABTS•+ was produced by reacting 2 mM ABTS in H2O with 2.45 mM potassium persulfate (K2S2O8),
and allowing the mixture to stand in the dark at room temperature for 6 hrs before use. Then, 1 mL of ABTS•+ solution was added to 3 mL of extract in ethanol at different concentrations (25–400 μg/mL). The absorbance was recorded 30 min after mixing and the percentage of radical scavenging was calculated for each concentration relative to a blank containing no scavenger. The extent of decolorization is calculated as percentage reduction of absorbance.
The scavenging capability of test compounds was calculated using the following equation:
ABTS•+ Scavenging Capacity (%) = [1- (As - Ac)] × 100 where AC is absorbance of a control lacking any
radical scavenger and AS is absorbance of the
remaining ABTS•+ in the presence of a scavenger (Gülçin et al., 2006).
FRAP Assay
a) Acetate buffer 300 mM pH 3.6: Weigh 3.1g sodium acetate trihydrate and add 16 ml of glacial acetic acid and make the volume to 1L with distilled water.
b) TPTZ (2, 4, 6-tripyridyl-s- triazine): (M.W. 312.34), 10 mM in 40 mM HCl (M.W. 36.46).
c) FeCl3. 6 H2O: (M.W. 270.30), 20 mM.
The working FRAP reagent was prepared by mixing a, b and c in the ratio of 10:1:1 just before testing. Standard was FeSO4. 7 H2O: 0.1 - 1.5 mM in methanol.
FRAP solution (3.6 mL) add to distilled water (0.4 mL) and incubated at 37˚C for 5 min. Then this solution mixed with different concentrations of plant extract (80 mL) and incubated at 37˚C for 10 min. The absorbance of the reaction mixture was measured at 593 nm. For construction of the calibration curve, five concentrations of FeSO4, 7H2O (0.1, 0.4, 0.8, 1, 1.12, 1.5 mM) were used and the absorbance values were measured as for sample solutions (Benzie and Strain, 1996).
Nitric Oxide Radical Scavenging
The nitric oxide radical scavenging capacity of the fractions was measured by Griess reaction (Sangameswaran et al., 2009). Various concentrations (25, 50, 100, 200, and 400µg/ml) of the
buffered saline (PBS) was added to 0.5 mL different concentrations of extracts. The reaction mixture was incubated at 25°C for 150 min. After incubation, 0.5 mL aliquot was removed and 0.5 mL of Griess reagent: (1% (w/v) sulfanilamide, 2% (v/v) H3PO4 and 0.1% (w/v) naphthylethylene diamine hydrochloride) was added. The absorbance was taken at 546 nm. Ascorbic acid was used as reference standard and was treated the same way as that of the extract. Sodium nitroprusside in PBS (2 mL) was used as control. The nitric oxide radicals scavenging activity of the extract and ascorbic acid was calculated according to the following equation: Percentage of inhibition = [(A0 – A1) / A0] x 100, where A0 is the
absorbance of sodium nitroprusside in PBS (without extracts and ascorbic) and A1 is the absorbance in
the presence of extract and ascorbic acid.
Reductive Potential
Ferric Cyanide (Fe3+) Reducing Antioxidant Power Assay
Reducing power of the extracts were measured by the direct reduction of Fe3+(CN−)6 to Fe2+(CN−)6 and
was determined by absorbance measurement of the formation of the Perl's Prussian Blue complex following the addition of excess Fe3+ (Oyaizu, 1986), but modified by (Gülçin, 2006b). Different concentrations of extracts in 0.5mL of distilled water were mixed with 1.25 mL of 0.2 M, pH 6.6 sodium phosphate buffer and 1.25 mL of potassium ferricyanide [K3Fe(CN)6] (1%) the mixture was
incubated at 50 °C for 20 min. After the incubation, the reaction mixture was acidified with 1.25 mL of trichloroacetic acid (10%). Finally, 0.5 mL of FeCl3
(0.1%) was added to this solution and the absorbance was taken at 700 nm in a spectrophotometer. Increased absorbance of the reaction mixture indicates greater reduction capacity (Gülçin, 2006 a, b).
Assay of Hydroxyl Radical Scavenging Activity The hydroxyl radical (-OH) scavenging activity was measured by the method of Jin et al. (1996). The hydroxyl radical was generated in a mixture of 1.0 mL of 0.75 mM 1,10-phenanthroline, 2.0 mL of 0.2 M sodium phosphate buffer (pH 7.4), 1.0 mL of 0.75 mM FeSO4 and 1.0 mL of H2O2 (0.01%, v/v). After addition of 1.0 mL sample solution, the mixture was incubated at 37oC for 30 min. Then, the absorbance
of the mixture at 536 nm was measured. Deionized water and Mannitol were used as the blank and positive control respectively. The scavenging activity on -OH was calculated by the following equation: Scavenging activity (%) = (Abs sample – Abs
blank)/(Abs 0 – Abs blank) *100
where Abs 0 is the absorbance of the deionized water instead of H2O2 and sample in the assay
system.
Fe2+ Chelating Ability Assay
The principle of the assay is based on disruption of o-phenanthroline - Fe2+ complex in the presence of chelating agent. The in vitro Fe2+ chelating ability of plant extract was assayed according to the method of Minnoti and Aust (1958) with slight modification (Puntel et al., 2005). Briefly, 900 μl of aqueous FeSO4 (500 μM) and 150 μl of extract were
incubated for 5min at room temperature. 78 μl of 1,10- phenanthroline (0.25 % ,w/v , aqueous) was added. The absorbance of the orange coloured solution was read at 510nm with a spectrophotometer. The in vitro Fe2+ chelating ability of the sample was calculated by using the following formula:
Chelating ability (%) = (Abs control - Abs sample) / Abs control x 100.
In vitro Inhibition of Lipid Peroxidation Assay In vitro inhibition of lipid peroxidation was estimated according to the method of Ruberto and Baratta, 2000). In this assay, egg yolk homogenate served as lipid rich medium, and FeS04 acts as
initiator of lipid peroxidation. Briefly, 50μl of plant extract was mixed with 0.25ml 10% egg yolk. This was followed by the addition of 10 µl FeS04 (0.07M,
aqueous). The mixture was incubated at room temperature for 30min.This was followed by the addition of 0.75 ml glacial acetic acid (5%,v/v aqueous) and 0.75ml thiobarbituric acid 0.8% in Sodium dodecyl siphate (SDS) 1.1%. The mixture was incubated in a boiling water bath (900C) for 60 min, cooled and centrifuged at 3000 rpm. 1 ml of the pink colour supernant was read at 532 nm on a spectrophotometer.
Determination of Total Phenolic Content
The total phenolic content of the extract was determined according to the method described elsewhere (Hung et al., 2001). In this assay, the phenolic group present in plant extract interacts with Folin – Ciocalteau in alkaline medium using Na2CO3 solution giving a blue colour, which has
maximum absorption at 685nm and correlates with total phenolic content. 0.1 ml of aqueous extract of the plant of different concentrations (2 – 10%) was rapidly mixed with 0.1 ml of Folin Ciocalteu reagent , followed by the addition of 0.3 ml sodium carbonate (15%,w/v) solution. The mixture was incubated in the dark for 30mins.The absorbance of the blue colour was read at 760 nm after 30mins on a spectrophotometer. The total phenolic content was extrapolated from a standard curve using tannic acid (graded doses, 50 – 250ug/ml) as a standard phenol.
Determination of Total Flavonoids Content
Total Flavonoids Content of the leaf extract was determined using the method described by Kumaran and Karunakaran (2007) with slight modification. Briefly, 0.5 ml of extract solution (1 mg/ml) and standard (quercetin) at different concentrations were taken in test tubes. 3.0 ml of methanol followed by 0.1 ml of 10% aluminum chloride solution was added into the test tubes. 200 ml of 1M potassium acetate solution was added to the mixtures in the test tubes. Furthermore, each reaction test tube was then immediately diluted with 2.8 ml of distilled water and mixed to incubate for 30 min at room temperature to complete reaction. The absorbance of pink colored solution was noted at 415 nm using a spectrophotometer against blank methanol. TFC of the extract was expressed as quercetin equivalents (QE) after calculation using the following equation: C=(c · V)/m, where, C =total flavonoid contents, mg/g plant extract in QE, c = concentration of quercetin obtained from calibration curve (mg/ml), V =the volume of the sample solution (ml), m= weight of the sample (g).
Total Antioxidant Activity
The total antioxidant capacity of the extract was determined with phosphomolybdenum using
ascorbic acid as the standard. The assay was based on the reduction of Mo (vi) to Mo (v) by the extracts and the subsequent formation of a green phosphomolybdate (v) complex at acidic pH.0.1ml of the extract (100ug/ml) solution was combined with 3ml of reagent (0.6M sulphuric acid, 28mM sodium phosphate, and 4mM ammonium molybdate). The tubes were capped and incubated in a boiling water bath at 950C for 90min. After the samples had cooled to room temperature, absorbance of the aqueous solution of each was read at 695nm against blank in a spectrophotometer. The blank solution contained 3ml of reagent solution and the appropriate volume of the same solvent used for the sample and it was incubated under the same conditions as the rest of the sample. The antioxidant capacity was expressed as the equivalent of ascorbic acid (Baydar et al., 2007).
Anti-Hemolytic Assay
Anti-hemolytic activity was assessed by following the spectrophotometric method (Yang et al., 2005, Verma et al., 2007, Ebrahimzadeh et al., 2010). From a normal healthy individual 5 ml of blood was taken and centrifuged at 1500 rpm for 3 min. Pellet of blood was washed three times in sterile phosphate buffer saline solution (pH 7.2). Obtained RBC pellets were washed twice and then Diluted to 20% cell suspension with PBS.
500µl of RBC + 500 µl of extract (different concentrations) + 250 µl of HgCl2 (5 µM). Incubate at
37oC for 3hrs in a water bath. Thereafter, add 2ml of PBS, centrifuge at 2000g for 10mins. Read absorbance of the supernatant at 540nm. For control, replace extract with PBS.
Calculation, AControl – ATest
AControl
Use Ascorbic acid, quercetin or tannic acid as standard.
Anti-Denaturation Activity
of these different concentrations was transferred to Eppendorf tubes using 1ml micro pipette. 5ml of 0.2 % W/V BSA was added to all the above Eppendorf tubes. The standard consist 10μg/ml of Diclofenac Sodium in methanol with 5ml 0.2% W/A BSA solution, Quercetin, Tannic acid. The test tubes were heated at 720C for 5 minutes and then cooled for 10 minutes .The absorbance of these solutions was determined by using UV/Vis Double beam spectrophotometer (Elico SL -196) at a wave length of 660 nm. The % inhibition of precipitation (denaturation of the protein) was determined on a % basis relative to the control using the following formula.
% inhibition of denaturation =
(Abs of control – Abs of extract) X 100 Abs of control
Quantification of compounds by HPLC-DAD
Reverse phase chromatographic analyses were carried out under gradient conditions using C18
column (4.6 mm x 250 mm) packed with 5μm diameter particles. The mobile phase was water containing 1% formic acid (A) and acetonitrile (B), and the composition gradient was: 13% of B until 10 min and changed to obtain 20%, 30%, 50%, 60%, 70%, 20% and 10% B at 20, 30, 40, 50, 60, 70 and 80 min, respectively (Boligon et al., 2012) with slight modifications. Pedilanthus tithymaloides methanolic extract was analyzed dissolved in ethanol at a concentration of 20 mg/mL. The presence of eleven antioxidants compounds was investigated, namely, gallic acid, chlorogenic acid, caffeic acid, ellagic acid, catechin, epicatechin, quercetin, quercitrin, isoquercitrin, rutin and kaempferol. Identification of these compounds was performed by comparing their retention time and UV absorption spectrum with those of the commercial standards. The flow rate was 0.7 ml/min, injection volume 50 μl and the wavelength were 254 nm for gallic acid, 280 nm for catechin and epicatechin, 327 nm for caffeic, ellagic and chlorogenic acids, and 366 nm for quercetin, isoquercitrin, quercitrin, rutin and kaempferol. All the samples and mobile phase were filtered through 0.45 μm membrane filter (Millipore) and then degassed by ultrasonic bath prior to use. Stock solutions of standards references were prepared in the HPLC mobile phase at a concentration range of 0.030 – 0.250 mg/ml for kaempferol, quercetin, isoquercitrin, quercitrin, catechin, epicatechin and
rutin; and 0.030 – 0.250 mg/ml for gallic, caffeic, ellagic and chlorogenic acids. The chromatography peaks were confirmed by comparing its retention time with those of reference standards and by DAD spectra (200 to 400 nm). Calibration curve for gallic acid: Y = 12740x + 1305.1 (r = 0.9997); catechin: Y = 12407x + 1359.6 (r = 0.9999); epicatechin: Y = 12547x + 1193.4 (r = 0.9996); caffeic acid: Y = 13058x + 1359.3 (r = 0.9990); chlorogenic acid: Y = 13261x + 1275.3 (r = 0.9995); ellagic acid: Y = 11985x + 1265.9 (r = 0.9998); rutin: Y = 12845 + 1065.7 (r = 0.9999); quercetin: Y = 13560x + 1192.6 (r = 0.9991), isoquercitrin: Y = 14273x + 1275.4 (r = 0.9998), quercitrin: Y = 13719x + 1256.7 (r = 0.9993) and kaempferol: Y = 14253x + 1238.9 (r = 0.9997). All chromatography operations were carried out at ambient temperature and in triplicate. The limit of detection (LOD) and limit of quantification (LOQ) were calculated based on the standard deviation of the responses and the slope using three independent analytical curves. LOD and LOQ were calculated as 3.3 and 10 σ/S, respectively, where σ is the standard deviation of the response and S is the slope of the calibration curve (Boligon et al., 2013).
Quantification of carotenoids HPLC-DAD
Carotenoids analysis was carried at reverse phase chromatographic analyses were carried out under gradient conditions using C18 column (4.6 mm x 150
mm) packed with 5 μm diameter particles. The mobile phase consisted of mixtures of ACN: H2O
Limit of detection (LOD) and limit of quantification (LOQ)
LOD and LOQ were calculated based on the standard deviation of the responses and the slope using three independent analytical curves. LOD and LOQ were calculated as 3.3 and 10 r/S, respectively, where r is the standard deviation of the response and S is the slope of the calibration curve (Boligon et al., 2012).
Results
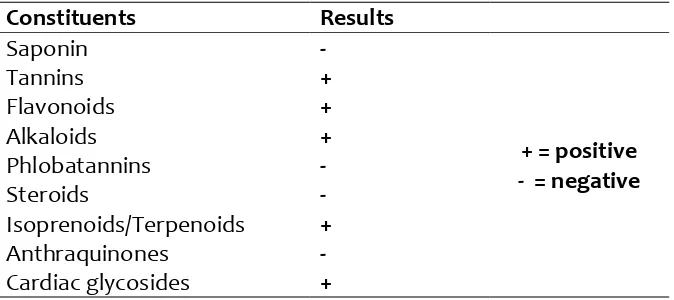
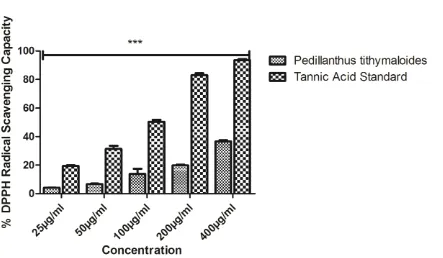
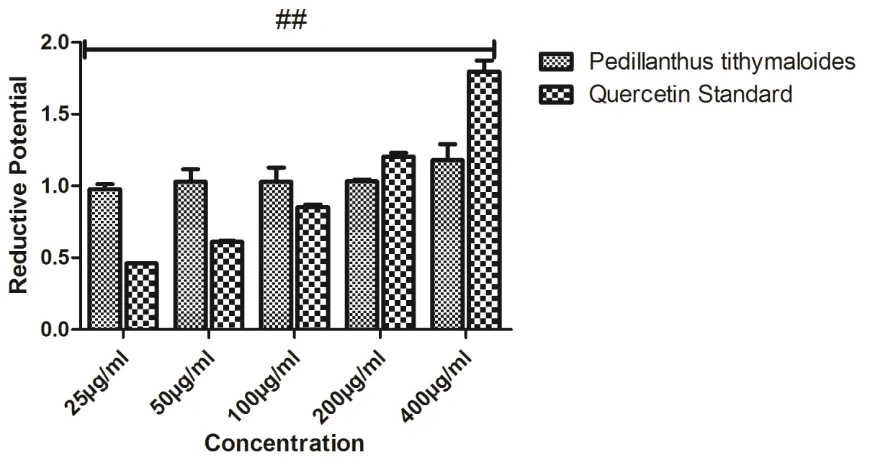
The phytochemical screening revealed the presence of alkaloids, tannins, isoprenoids, flavonoids and glycosides in the extract (Table 1). Table 2 showed the relative quantities of phenols, flavonoids, and antioxidant capacity; Total Phenols (µg TAE/mg) are 1.56, while Total Flavonoids (µg QE/mg) and Total Antioxidant Capacity (mM AAE /mg) are 17.89 and 327.53 respectively. The DPPH radical scavenging capacity was shown in Figure 1, it’s relatively compared to the standard, even at the highest concentration used, and the radical scavenging capacity was not up to 40%. The extract’s ABTS radical scavenging capacity in Figure 2 demonstrated concentration dependent manner, although not up to the trolox standard. NO radical scavenging capacity in Figure 3 showed that the scavenging in the lowest concentration was not significant from the highest, this was also the trend observed in the reductive potential, Figure 4; this might suggest that the extract a very high capacity to scavenge NO radical and to reduce oxidants. The metal chelating capacity was observed to be very low but followed a concentration dependent manner (Fig 5). Figure 6 showed the extract’s capacity to scavenge OH radical, the extract compared favourably with the standard at each concentration, it also had concentration dependence. Figure 7 also described the extract’s capacity to inhibit lipid peroxidation, though the trend seems non-significantly different from each other, but it had high capacity to inhibit lipid peroxidation. The high performance liquid chromatography (HPLC) profile of Pedilanthus tithymaloides was presented in Figure 8 and Table 3; gallic acid (peak 1), catechin (peak 2), chlorogenic acid (peak 3), caffeic acid (peak 4), ellagic acid (peak 5), epicatechin (peak 6), rutin (peak 7), isoquercitrin
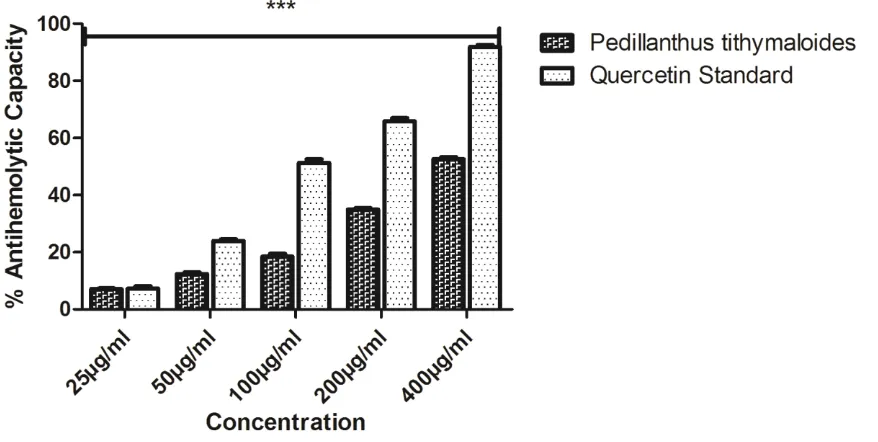
(peak 8), quercitrin (peak 9), quercetin (peak 10) and kaempferol (peak 11). The result showed that phenolics were abundant in the extract especially flavonoids; and kaempferol was the most abundant (34.27 ± 0.01 mg/g), followed by quercetin and others. The high performance liquid chromatography (HPLC) profile of carotenoids in Pedilanthus tithymaloides was also represented in Figure 9 and Table 4; tocopherol (peak 1) and β-Carotene (peak 2) were the only carotenoids present, and β-Carotene was the most abundant (2.82 ± 0.01 mg/g). Assays to substantiate the anti-inflammatory properties of the extract were reported in Figures 8 and 9. These are the antihemolytic and antidenaturation assays. The extract’s potential in antihemolytic assay showed a concentration dependent relationship but the power is not as much pronounced as that of the standard quercetin, while in antidenaturation assay, the extract competed with the standard to a large extent. The result showed a significant difference in all the concentrations employed for the assays.
HPLC analysis
HPLC fingerprinting of Pedilanthus tithymaloides methanolic extract revealed the presence of the gallic acid (tR = 10.24 min; peak 1), catechin (tR = 15.92
min; peak 2); chlorogenic acid (tR = 22.18 min; peak
3), caffeic acid (tR = 26.07 min; peak 4), ellagic acid
(tR = 29.83 min; peak 5), epicatechin (tR = 34.21 min;
peak 6), rutin (tR = 39.87 min; peak 7), isoquercitrin
(tR = 44.81 min; peak 8), quercitrin (tR = 47.03 min;
peak 9), quercetin (tR = 52.11 min; peak 10) and
kaempferol (tR = 57.29 min; peak 11) (Fig. 1 and Table
3). The HPLC analysis revealed that flavonoids (quercetin, isoquercitrin, quercitrin, rutin and kaempferol), tannins (catechin and epicatechin) and phenolics acids (gallic, chlorogenic, ellagic and caffeic acids) are present in the extract of Pedilanthus tithymaloides.
HPLC analysis Calibration curve:
Tocopherol was: Y = 34721x + 1046.9 (r = 0.9999); tR
13.81 min. LOD = 0.023 g/mL and LOQ = 0.075 g/mL.
β-carotene: Y = 27732x + 1156.8 (r = 0.9988); tR 23.59
Lycopene: Y = 31058x + 1527.1 (r = 0.9999); tR 29.14
min. LOD = 0.028 g/mL and LOQ = 0.091 g/mL. (Figure 11, table 4).
Discussion
Phytochemicals are known to support bioactive activities in medicinal plants and may therefore be responsible for the antioxidant activities of the leaf of Pedillanthus tithymaloides. The phytochemical screening revealed the presence of alkaloids, tannins, isoprenoids/terpenoids, flavonoids and glycosides in the extract (Table 1). Alkaloids have been associated with medicinal uses for centuries and one of their common biological properties is their cytotoxicity, they have also been documented to possess analgesic, antispasmodic and bactericidal effects (Falode et al., 2016). Tannins hasten the healing of wounds and inflamed mucous membrane (Okwu and Okwu, 2004), they are generally known to be useful in the treatment of inflamed or ulcerated tissues and have remarkable activity in cancer prevention. Flavonoids are potent water-soluble antioxidants and free radical scavengers which prevent oxidative cell damage and have strong anticancer activity (Falode et al., 2016). Flavonoids also lower the risk of heart diseases. Terpenoids are capable of promoting the activities of some enzymes in the intestine, building the immune system and promoting wound healing. Cardiac steroids are widely used in the treatment of congestive heart failure. They help in increasing the force of contraction of the heart (positive ionotropic activity) in heart failure patients. Thus, the presence of these constituents in P. tithymaloides supports the common traditional use of the plant in the treatment of various diseases (Falode et al., 2016, 2018). Table 2 showed the relative quantities of phenols, flavonoids, and antioxidant capacity; Total Phenols (µg TAE/mg) are 1.56, while Total Flavonoids (µg QE/mg) and Total Antioxidant Capacity (mM AAE /mg) are 17.89 and 327.53 respectively. The DPPH radical scavenging capacity was shown in Figure 1, it’s relatively compared to the standard, even at the highest concentration used, and the radical scavenging capacity was not up to 40%. The extract’s ABTS radical scavenging capacity in Figure 2 demonstrated concentration dependent manner, although not up to the trolox
standard. NO radical scavenging capacity in Figure 3 showed that the scavenging in the lowest concentration was not significant from the highest, this was also the trend observed in the reductive potential, Figure 4; this might suggest that the extract a very high capacity to scavenge NO radical and to reduce oxidants. The metal chelating capacity was observed to be very low but followed a concentration dependent manner (Fig 5). Figure 6 showed the extract’s capacity to scavenge OH radical, the extract compared favourably with the standard at each concentration, it also had concentration dependence. Figure 7 also described the extract’s capacity to inhibit lipid peroxidation, though the trend seems non-significantly different from each other, but it had high capacity to inhibit lipid peroxidation. The extract as shown in Table 2 demonstrated remarkable contents of phenols and flavonoids; and total antioxidant activities. The reducing power of a compound is related to its electron transfer ability and may serve as a significant indicator of its potential antioxidant activity (Falode et al., 2018). The hydroxyl radical is the most reactive of the reactive oxygen species, and it induces severe damage in adjacent biomolecules (Gutteridge, 1984; Falode et al., 2018), the hydroxyl radical can cause oxidative damage to DNA, lipids and proteins, Figure 6 showed the extract’s capacity to scavenge OH radical. Metal ion chelating capacity plays a significant role in antioxidant mechanisms, since it reduces the concentration of the catalyzing transition metal in LPO (Duh et al., 1999; Falode et al., 2018)
Mueller-Hinton and RPMI-1640 media showed strong inhibition against Staphylococcus aureus, Bacillus subtilis, Pseudomonas aeruginosa and Escherichia coli (Vidotti et al., 2006).
HPLC is a chromatographic procedure which is used to separate, identify, quantify and purify individual components of a mixture. HPLC fingerprinting has become imperative and vital quality control tool for herbal samples. It provides quantitative and qualitative information to researchers as well as enables the screening of samples for the presence of new compounds (Jagmohan and Pramod, 2011). The high performance liquid chromatography (HPLC) profile of Pedilanthus tithymaloides was presented in Figure 10 and Table 3; gallic acid (peak 1), catechin (peak 2), chlorogenic acid (peak 3), caffeic acid (peak 4), ellagic acid (peak 5), epicatechin (peak 6), rutin (peak 7), isoquercitrin (peak 8), quercitrin (peak 9), quercetin (peak 10) and kaempferol (peak 11). The result showed that phenolics were abundant in the extract especially flavonoids; and kaempferol was the most abundant (34.27 ± 0.01 mg/g), followed by quercetin and others. The high performance liquid chromatography (HPLC) profile of carotenoids in Pedilanthus tithymaloides was also represented in Figure 11 and Table 4; tocopherol (peak 1) and β-Carotene (peak 2) were the only carotenoids present, and β-Carotene was the most abundant (2.82 ± 0.01 mg/g).
P. tithymaloides is a low tropical shrub, locally known as Rang-chita. Different parts of the plant are used in traditional Indian medicine as abortive, anticancer, anti-inflammatory and antimicrobial (Ghosh et al., 2012; Ghosh et al., 2013; Bunyapraphatsara and Chokchaichareonporn, 2000), it had been reported to possess therapeutic activity against skin disorders (Kumar and Chaturvedi, 2010). The flavonoid luteolin along with the new compound tetradecanediol sodium salt were isolated from the methanolic extract (ME) of PT leaves (Ghosh et al., 2013); luteolin has been reported to suppress NF-κB activation and COX-2 expression activated by the MyD88-independent pathway via Toll-like receptor-4 (Lee et al., 2009); luteolin also inhibits the post-attachment stage of Enterovirus 71 and Coxsackie virus A16 (Xu et al.,
2014), replication of Poliovirus (Vrijsen et al., 1988), Influenza virus A (Liu et al., 2008), and HIV-1 (Mehla et al., 2011).
Assays to substantiate the anti-inflammatory properties of the extract were reported in Figures 8 and 9. These are the antihemolytic and antidenaturation assays. Quite a number of extracts have been demonstrated to protect and stabilize red blood cells that were exposed to a combined hypotonic and hemolytic induced stress. The degree of inhibition of BSA denaturation increased with the decrease in the concentration of the extracts (Williams et al., 2008). The anti-denaturation of the drug will be more at lower concentration. The extract showed a concentration dependent increase in both antihemolytic and antidenaturation activities.
Conflicts of interest
The authors did not declare any conflict of interest.
Funding
This research did not receive any specific grant from funding agencies in the public, commercial, or not-for-profit sectors.
References
Abreu, P., Matthew, S., González, T., Costa, D., Segundo, M.A., Fernandes, E., 2006. Antiinflammatory and antioxidant activity of a medicinal tincture from Pedilanthus tithymaloides. Life Sci. 78, 1578-1585.
Abreu, P., Matthew, S., Gonzalez, T., Vanickova, L., Costa, D., Gomes, A., Segundo, M.A., Fernandes, E., 2008. Isolation and identification of antioxidants from Pedilanthus tithymaloides. J. Nat. Med. 62, 67-70.
Balfour, Systematic Botany, 1988. p. 321
Baydar, N.G., Ozkan, G., Yasar, S., 2007. Evaluation of the antiradical and antioxidant potential of grape extracts. Food.Cont. 18, 1131-1136. Benzie, I.F.F., Strain, J.J., 1996. The ferric reducing
ability of plasma (FRAP) as a measure of “antioxidant” power: the FRAP assay. Anal. Biochem. 239, 70-76.
Athayde, M.L., 2012. Protective effects of extracts and flavonoids isolated from Scutia buxifolia Reissek against chromosome damage in human lymphocytes exposed to hydrogen peroxide. Molecules, 17, 5757-5769
Boligon, A.A., Brum, T.F., Frolhich, J.K., Froeder, A.L.F., Athayde, M.L., 2012. HPLC/DAD profile and determination of total phenolics, flavonoids, tannins and alkaloids contents of Scutia buxifolia Reissek stem bark. Research Journal of Phytochemistry 6 (3): 84-91
Boligon, A.A., Kubiça, T.F., Mario, D.N., Brum, T.F., Piana, M., Weiblen, R., Lovato, L., Alves, S.H., Santos, R.C.V., Alves, C.F.S., Athayde, M.L., 2013. Antimicrobial and antiviral activity-guided fractionation from Scutia buxifolia Reissek extracts. Acta Physiol Plant 35, 2229-2239
Bunyapraphatsara, N., Chokchaichareonporn, A., 2000. Medicinal Plants Indigenous to Thailand. Prachachon Bangkok, p 691.
Duh, P.D., Tu, Y.Y., Yen, G.C., 1999. Antioxidant activity of water extract of HarngJyur (Chrysanthemum morifolium Ramat). LWT; 32, 269‐277
Ebrahimzadeh, M.A., Nabavi, S.F., Eslami, B., Nabavi, S.M., 2009. Antioxidant and antihemolytic potentials of Physosperum cornubiense (L.) DC. Pharmacologyonline; 3, 394-403.
Edeoga, H.O., Okwu, D.E., Mbaebie, B.O., 2005. Phytochemical constituents of some Nigerian medicinal plants. Afr. J. Biotechnol.; 4 (7): 685-688.
Falode, J.A., Obafemi, T.O., Akinmoladun, A.C., Olaleye, M.T., Boligon, A.A., Athayde, M.L., 2016. High-Performance Liquid Chromatography (HPLC) Fingerprinting and Comparative Antioxidant Properties of Fruit and Leaf Extracts of Kigelia africana International Journal of Pharmacognosy and Phytochemical Research 8(10); 1645-1656 Falode, J.A., Obafemi, T.O., Akinmoladun, A.C.,
Olaleye, M.T., Boligon, A.A., Athayde, M.L., 2018. High-Performance Liquid Chromatography (HPLC) Fingerprinting and Comparative Antioxidant Properties of Rootbark and Leaf Extracts of Calliandra portoricensis: PharmacologyOnline 1: 24-44
Ghosh, S., Chattopadhyay, D., Mandal, A., Kaity, S., Samanta, A., 2013. Bioactivity guided isolation of anti-inflammatory, analgesic and antipyretic constituents from the leaves of Pedilanthus tithymaloides (L.) J Med Chem Res. 22: 4347–59.
Ghosh, S., Samanta, A., Mandal, N.B., Banerjee, S., Chattopadhyay, D., 2012. Evaluation of wound healing activity of methanolic extract of Pedilanthus tithymaloides (L.) Poit leaf and its isolated active constituents in topical formulation. J Ethnopharmacol. 142(3): 714– 22. doi: 10.1016/j.jep.2012.05.048 PMID: 22683906
Gülçin, İ., 2006. Antioxidant activity of caffeic acid (3, 4-dihydroxycinnamic acid). Toxicology, 217, 213−220
Gülçin, İ., 2006. Antioxidant and antiradical activities of L-carnitine. Life Sciences, 78, 803−811 Gülçin, İ., Elias, R., Gepdiremen, A., Boyer, L., 2006.
Antioxidant activity of lignans from fringe tree (Chionanthus virginicus L.). European Food Research and Technology, 223, 759−767 Gutteridge, M.C., 1984. Reactivity of hydroxyl and
hydroxyl‐like radicals discriminated by release of thiobarbituric acid reactive material from deoxy sugars, nucleosides and benzoate. BiochemJ. 224, 761-767
Harborne, J.B., 1992. Bioactive constituents of plant. In: Phytochemical methods. A guide to modern techniques of plant analysis (2nd ed.). Chapman and Hall Publ. Co. London. 1992, 46-288
Hung, Y., Sava, V., Yang, S.M., Hong, M.Y., Yang, P.C., Huang, G.C., 2001. Isolation and characterization of melanin pigments derived from tea and tea polyphenols. Food Chem. 73(2): 177-184
Jagmohan, S., Pramod, S., 2011. HPLC Fingerprinting of Highly Demanding Medicinal Plant Swertia: An Overview. Int . J. Med. Arom. Plants; 1(3): 333-337
Jin, M., Cai, Y., Li, J., Zhao, H., 1996. 1,10-Phenanthroline-Fe2+ oxidative assay of hydroxyl radical produced by H2O2/Fe2+.
Prog. Biochem. Biophys. 23, 553–555.
Kumar, G.P., Chaturvedi, A., 2010. Ethnobotanical observations of Euphorbiaceae species from Vidarbha region, Maharashtra. India. Ethnobotanical Leaflets; 14, 674–80
Kumaran, A., Karunakaran, R.J., 2007. In vitro antioxidant activities of methanol extracts of five Phyllanthus species from India. LWT - Food Sci. Technol. 40, 344–352
Lee, J.K., Kim, S.Y., Kim, Y.S., Lee, W.H., Hwang, D.H., Lee, J.Y., 2009. Suppression of the TRIF-dependent signaling pathway of Toll-like receptors by luteolin. Biochem
Pharmacol. 77: 1391–400. doi:
10.1016/j.bcp.2009.01.009 PMID: 19426678 Liu, A.L., Liu, B., Qin, H.L., Lee, S.M., Wang, Y.T., Du,
G.H., 2008. Anti-influenza virus activities of flavonoids from the medicinal plant Elsholtzia rugulosa. Planta Med. 74(8): 847– 51. doi: 10.1055/s-2008-1074558. PMID: 18553272
Mehla, R., Bivalkar-Mehla, S., Chauhan, A., 2011. A Flavonoid, Luteolin, Cripples HIV-1 by Abrogation of Tat Function. PLoS One. 6(11): e27915. doi: 10.1371/journal.pone.0027915 PMID: 22140483
Minnoti, G., Aust, S.D., 1987. An investigation into the mechanism of citrate –Fe2+ dependent lipid peroxidation, Free Rad Biol Med 3, 379 – 387.
Molyneux, P., 2004. The use of the stable free radical diphenylpicryl-hydrazyl (DPPH) for estimating antioxidant activity, Songklanakarin Journal of Science and Technology, 26, 211-219.
Nagda, G., Deshmukh, D., 1998. Hemagglutination Pattern of Galactose Specific Lectin From
Pedilanthus tithymaloides in Diabetes
Mellitus, Indian Journal of Experimental Biology, 426-428.
Nellis, 1997. Poisonous Plants and Animals of Florida and the Caribbean, p. 182
Okwu, D.E., Okwu, M.E., 2004. Chemical composition of Spondias mombin Linn plant parts. J. Sustain. Agric. Environ. 6, 140-147
Oyaizu, M., 1986. Studies on product of browning reaction prepared from glucose amine. Japanese Journal of Nutrition, 44, 307−315 Puntel, R.L., Nogueira, C.W., Rocha, J.B.T., 2005.
Krebs cycle intermediates modulate thiobarbituric reactive species (TBARS) production in rat brain in vitro. Neurochem Res 30, 225 - 235
Quattrocchi, C.R.C., 1990. World Dictionary of Plant Names: Common Names, Scientific Names, Eponyms, and Etymology, p. 1987.
Ruberto, G., Baratta, M., 2000. Antioxidant activity of selected essential oil components in two lipid model systems, Food Chem 69, 167 - 174 Sajeva and Costanzo, Succulents: The Illustrated
Dictionary, 1994, p. 185.
Sangameswaran, B., Balakrishnan, B.R., Deshraj, C. and Jayakar, B. 2009. In vitro Antioxidant activity of Thespesia Lampas Dalz and Gibs. Pakistan Journal of Pharmacy Science 22: 368-372.
Sofowora, A. 2006. Medicinal Plants and Traditional Medicine in Africa. 2nd Ed., Spectrum Books Ltd., Ibadan, Nigeria. 151-153: 209-214
Spoerke and Smolinske, 1990. Toxicity of Houseplants, p. 181
Steinmann, 2003. The Submersion of Pedilanthus into Euphorbia (Euphorbiaceae)," Acta Botanica Mexicana, p. 45
Torkelson, 1996. The Cross Name Index to Medicinal Plants: Common Names, M-Z, p. 716
Trease, G.E., Evans, W.C., 1996. Pharmacognosy, WB Saunders Ltd. London; 14th Ed. 119-159. Van Damme, 1998. Handbook of Plant Lectins:
Properties and Biomedical Applications, p. 211.
Vardhana, 2008. Direct Uses of Medicinal Plants and Their Identification, p. 261.
Verma, R.J., Devjani, C., 2007. Protection from oxidative damage using Emblica officinalis Gaertn. extracts in case of ochratoxin‐induced toxicity in normal human RBC. Natural Product Radiance; 6, 212‐220.
Vrijsen, R., Everaert, L., Boey, A., 1988. Antiviral Activity of Flavones and Potentiation by Ascorbate. J Gen Virol. 69, 1749–51. PMID: 2839607
Waroonluk, S., Narong, C., Sirirak, C., Pakawadee, P., Krisana, S., Urai, P., 2010. The Effect of Pedilanthus tithymaloides (L.) Poit Crude Extract On Wound Healing Stimulation in Mice. Kasetsart J. Nat. Sci. 44, 1121 - 1127 Williams, L.A.D., Connar, A.O., Latore, L., Dennis, O.,
Ringer, S., Whittaker, J.A., Conrad, J., Vogler, B., Rosner, H., Kraus, W., 2008. The in vitro anti-denaturation effects induced by natural products and nonsteroidal compounds in heat treated (immunogenic) bovine serum
albumin is proposed as a screening assay for the detection of antiinflammatory compounds, without the use of animals, in the early stages of the drug discovery process. West Indian Med J, 57, 327 – 331 Xu, L., Su, W., Jin, J., Chen, J., Li, X., Zhang, X., 2014.
Identification of Luteolin as Enterovirus 71 and Coxsackievirus A16 Inhibitors through Reporter Viruses and Cell Viability-Based Screening, Viruses, 6(7): 2778–95. doi: 10.3390/v6072778 PMID: 25036464
Table 1: Phytochemical constituents of
Pedilanthus tithymaloides
leaf extracts.
Constituents
Results
Saponin
-
+ = positive
- = negative
Tannins
+
Flavonoids
+
Alkaloids
+
Phlobatannins
-
Steroids
-
Isoprenoids/Terpenoids
+
Anthraquinones
-
Cardiac glycosides
+
Table 2: Total phenols, flavonoid contents and total antioxidant capacity of
Pedilanthus tithymaloides
In vitro
Antioxidant Parameter (Quantitative)
Values in
Pedilanthus tithymaloides
Total Phenols (µg TAE/mg)
A1.564
Total Flavonoids (µg QE/mg)
B17.889
Total Antioxidant Capacity (mM AAE /mg)
C327.526
Values are expressed as mean ± SD (n =3);
ATAE ‐ Tannic acid equivalents;
BQE‐Quercertin equivalents;
C