A COGNITIVE ANALYSIS OF DISCOURSE
PROCESSING IN NATIVE AND NON-NATIVE
SPEAKERS OF ENGLISH
CHAHID EL HAK FOURALI
SUBMITTED FOR THE DEGREE OF PH.D., OCTOBER, 1987
ABSTRACT
This study establishes a quantitative and qualitative difference in the pattern of text processing of native and non native speakers of English. The psychological nature of this difference is explored in five studies. They reveal the following influences.
1 - Non-native speakers are disadvantaged when text processing relies on mental operations which are based on schema representations of the language e.g. assumption, evaluation and interpretation. They are not disadvantaged when processing is based on mental operations more related
r
to ability like deducing and inferring. A test of these five mental processes was constructed especially for this
investigation.
2 - The study also reveals that native speakers benefit almost twice as much from repeated presentations of the same text. The improvement, however, is limited to certain types of test items.
3 - The processing difference between native and
4 - The contribution of ability to text processing is studied under a condition of varying relationship between past experience and learning content. The results show that learners' performance is quantitatively and qualitatively
different when faced with schema related as against schema unrelated texts. A reciprocal function is observed when the
non-schema relevant group compensates for lack of past experience by making use of deductive reasoning. On the other hand,
learners in the schema relevant condition make minimum call upon this ability.
5 - The generality of the influence of cognitive group membership (e.g. identical native language, similarity of
ACKNOWLEDGEMENT
This research in many ways is the result of co-operation between colleagues, members of staff at the Institute of Education, Londond and friends.I should like to thank all those who participated. I am especially
grateful to Dr. Fitz J. Taylor for all his effort, support and encouragement.
My thanks go also to Dr. J. Versey for his continual readiness to offer advice.
I am indebted to the Ministry of Higher Education of the Algerian Government for its assistance and financial aid.
4
TABLE OF CONTENTS
PAGE
Abstract 1
Acknowledgements 3
Table of Contents 4
List of Tables 6
List of Graphs 9
CHAPTER I
Introduction 10
CHAPTER II Experiment I: 14
subjects, procedure, treatment of results and findings
CHAPTER III Qualitative Analysis 29 Summary
CHAPTER IV Overview 41
Underlying Differentiating 42 Processes
CHAPTER V Overview 63
Explanation in Terms of 64 Expert/Novice Paradigm
CHAPTER VI Overview 78
Experience with Subject Matter 80
- Pilot Study 80
PAGE
CHAPTER VII Relative Contributions of Ability 102 and Schema Related Processing in
Subjects with High and Low Schema Differentiation
- Introduction and Hypotheses 102
- Method 105
- Tests of Hypotheses Dealing with 113 Factors Influencing Text processing
CHAPTER VIII The Effect of Specific Subject Domain 122 Strategy on Text Processing
- Method 125
- Analysis and Results 138
CHAPTER IX General Conclusion 155
and
Application to Education 160
REFERENCES 163
11-2
11-3
11-4
IV-2
IV-3
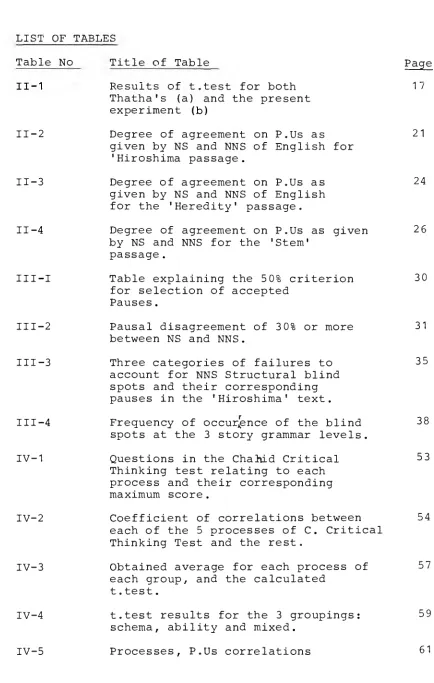
LIST OF TABLES
Table No Title of Table Page
II-1 Results of t.test for both 17
Thatha's (a) and the present experiment (b)
6
21 Degree of agreement on P.Us as
given by NS and NNS of English for 'Hiroshima passage.
Degree of agreement on P.Us as given by NS and NNS of English for the 'Heredity' passage.
Degree of agreement on P.Us as given by NS and NNS for the 'Stem'
passage.
Table explaining the 50% criterion for selection of accepted
Pauses.
Pausal disagreement of 30% or more between NS and NNS.
Three categories of failures to account for NNS Structural blind spots and their corresponding pauses in the 'Hiroshima' text. Frequency of occurrence of the blind spots at the 3 story grammar levels. Questions in the Chaltid Critical Thinking test relating to each process and their corresponding maximum score.
Coefficient of correlations between each of the 5 processes of C. Critical Thinking Test and the rest.
Obtained average for each process of each group, and the calculated
t.test. 24 26 30 31 35 38 53 54 57
IV-4 t.test results for the 3 groupings: 59 schema, ability and mixed.
Table No Title of Table Page
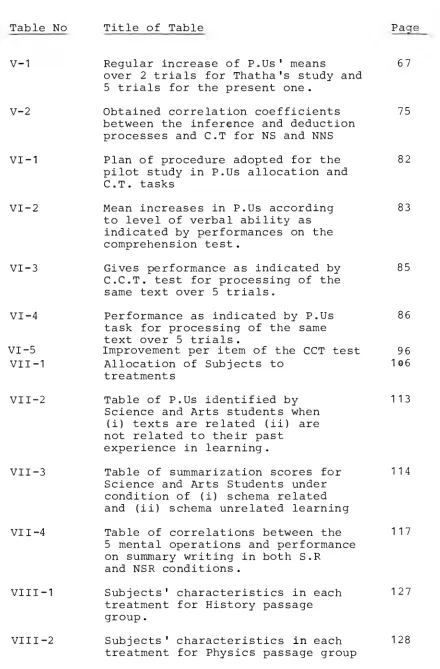
V-1 Regular increase of P.Us' means 67 over 2 trials for Thatha's study and
5 trials for the present one.
V-2 Obtained correlation coefficients 75 between the inference and deduction
processes and C.T for NS and NNS
VI-1
VI-2
VI-3
Plan of procedure adopted for the pilot study in P.Us allocation and C.T. tasks
Mean increases in P.Us according to level of verbal ability as indicated by performances on the comprehension test.
Gives performance as indicated by C.C.T. test for processing of the same text over 5 trials.
82
83
85
VI-4 Performance as indicated by P.Us 86 task for processing of the same
text over 5 trials.
VI-5 Improvement per item of the CCT test 96 VII-1 Allocation of Subjects to 106
treatments
VII-2 Table of P.Us identified by 113 Science and Arts students when
(i) texts are related (ii) are not related to their past
experience in learning.
VIII -2
Table of summarization scores for 114 Science and Arts Students under
condition of (i) schema related and (ii) schema unrelated learning
Table of correlations between the 117 5 mental operations and performance
on summary writing in both S.R and NSR conditions.
Subjects' characteristics in each 127 treatment for History passage
group.
Subjects' characteristics in each 128 treatment for Physics passage group
VII -3
VII -4
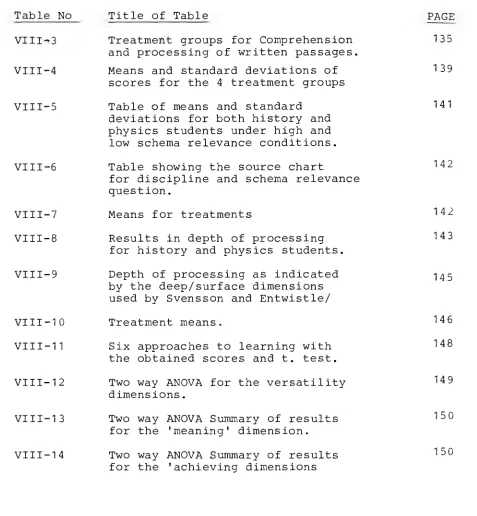
Table No Title of Table PAGE Treatment groups for Comprehension 135 and processing of written passages.
VIII-4 Means and standard deviations of 139 scores for the 4 treatment groups
VIII-5 Table of means and standard 141 deviations for both history and
physics students under high and low schema relevance conditions.
142 Table showing the source chart
for discipline and schema relevance question.
Means for treatments
Results in depth of processing for history and physics students. Depth of processing as indicated by the deep/surface dimensions used by Svensson and Entwistle/ Treatment means.
Six approaches to learning with the obtained scores and t. test. Two way ANOVA for the versatility dimensions.
Two way ANOVA Summary of results for the 'meaning' dimension. Two way ANOVA Summary of results for the 'achieving dimensions VIII -6
VIII-7 VIII-8
VIII-9
VIII-10 VIII-1 1
VIII-12
VIII-13
VIII-14
142 143
145
146 148
149
150
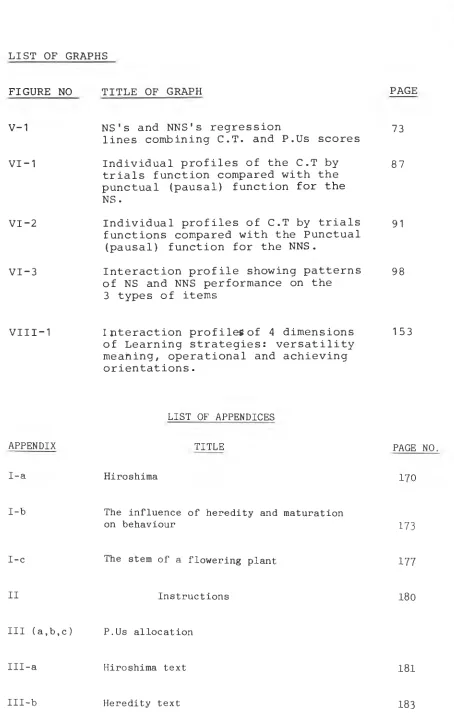
LIST OF GRAPHS
FIGURE NO TITLE OF GRAPH PAGE
NS's and NNS's regression
lines combining C.T. and P.Us scores Individual profiles of the C.T by trials function compared with the punctual (pausal) function for the NS.
73
87
VI-2
VI-3
VIII -1
Individual profiles of C.T by trials functions compared with the Punctual (pausal) function for the NNS.
Interaction profile showing patterns of NS and NNS performance on the
3 types of items
Interaction profile0of 4 dimensions of Learning strategies: versatility meaning, operational and achieving orientations.
91
98
153
LIST OF APPENDICES
APPENDIX TITLE PAGE NO.
I-a Hiroshima 170
I-b The influence of heredity and maturation
on behaviour 173
I-c The stem of a flowering plant 177
II Instructions 180
III (a,b,c) P.Us allocation
III-a Hiroshima text 181
9
APPENDIX TITLE PAGE NO.
Stem 185
Chi Square calculation for the
Hiroshima article 187
IV-a(1)
IV-a(2) Contingency coefficient calculation
for the Hiroshima passage 187
IV-b(1) Chi Square for the Heredity passage 188
IV-b(2) Contingency coefficient calculatiion
for the Heredity passage 188
IV-c(1) Chi Square calculation for the stem
article 189
IV-c(2) Contingency coefficient calculation
for the stem passage 189
V-a Instructions for the non-punctuated
text 190
V-b Hiroshima article with no punctuation
marks 191
VI-a The words after which 50% and above
of the NS paused 194
VI-b The words after which 50% and above
of the NNS paused 195
VII Hiroshima article showing:
a) the words after which the 8 pausal
differences occured; 196
b) the story grammar divisions
VIII Watson & Glaser Test 198
IX Modified version of the Watson and
Glaser test 207
X Calculation of P.0 value for obvious
APPENDIX TITLE PAGE NO.
XI-a Regression equation for NS scores 213
XI-b Regression equation for NNS scores 214
XII Level of significance of the
difference between the coefficients 215
XIII Significance tests relating to the
obtained regression lines 216
XIII-a Significance test for NNS/NS
regression lines 216
XIII-b Difference between slopes: comparison
of two regression coefficients 217
XIV Difference between correlation coefficients for the inferance and
deduction processes 218
XV Initial comprehension test items
for the 3 texts 219
XV-a Hiroshima 219
XV-b Heredity 222
XV-c The Stem 225
XV1 Test items selection 228
XVI-a Instructions 228
XVI-b Hiroshima 229
XVI-c The Stem 230
XVI-d Heredity 231
APPENDIX TITLE PAGE NO.
XVIII Comprehension Test 233
XVIII-a Hiroshima 234
XVIII-b The Stem 235
XVIII-c Heredity 236
XIX Raw data 237
XX Anova for pilot study 238
XXI Anovas testing the effect of ability
levels on P.0 scores 239
XXI-a Hiroshima 239
XXI-b Heredity 240
XXI-c Stem 241
XXII- Friedman 2 way Anova (b) and 242
Page's L test (a) for comprehension test and NS group
XXIII Friedman 2 way Anova (b) and Page's L Test (a) for comprehension test
and NNS group 243
XXIV Friedman 2 way Anova (b) and Page's L
Test (a) for P.Us and NNS group 244
XXV Friedman 2 way Anova (b) and Page's L
Test (a) for P.Us and NNS group 245
XXV-1 Wilcoxon matched-pairs signed-ranks test comparing SR with AR for all
subjects 246
XXVI Characteristics fo subjects in each
APPENDIX TITLE PAGE NO.
XXVII Experimental package for the arts
passage 248
XXVIII Experimental package for the
science article 261
XXIX/XXX Raw data for Sciences and Arts 267 related subjects
XXXI Effect of schema relatedness and
discipline and P.Us 269
XXXII Schema relatedness by subject
discipline by trials: a 2x2x3 Anova 270
XXXIII Difference between correlation
coefficients 271
XXXIV General Information Questionnaire 272
XXXV Processing of physics passage 274
XXXVI Processing of history passage (1) 276
XXXVII Processing of history passage (2) 278
XXXVIII Answer sheet for the comprehension
task 280
XXXIX Short Inventory of Approaches to
Studying 281
XL Group Test No.33 283
XLI High and Low Knowledge History groups 284
XLII High and Low-Knowledge Physics groups 285
XLIII Mann Whitney U Test for P.Us as an index of discipline group difference
CHAPTER I.
10
INTRODUCTION
r
A chance finding of a consistent difference between native and non-native speakers of English when meaningfully subdividing a text, gave rise toINTRODUCTION
It would be possible to present this thesis in a neat and clinical fashion showing questions asked, the theoretical considerations that prompted these questions, the design
and operationalization of the study and how the results illuminated both questions and the theory. Instead the approach will be to trace the path of the enquiry as it happened;
starts and stops, fruitful alleys and blind ones, failures and successes.
The study started with the general interest in schema theory as applied to comprehension. It was inspired by a serendipitous finding which is referred to in a Ph.D thesis done at the Institute of Education, London (Matambo, 1982).
In 1982, two experiments were carried out using Johnson's (1970) procedure (Matambo, 1982; Fourali, 1982). This procedure was set up in order to segment written information into
'pausal units' P.Us. Thus, subjects were reguested to indicate where pausing might occur, to 'catch a breath, to give emphasis to the story, or to enhance meaning' (Johnson, 1970, p.13). Johnson (ibid), subsequently, obtained a qualitative
differentiation of these units, by having them rated according to their importance to the text's theme. Both Matambo (1982) and Fourali (1982) noted that Native-Speakers (NS) of the
A first systematic analysis of these observations carried out by Matambo (1982) showed consistently, that
throughout 3 texts dealing with such topics as war, psychology and plants, NS tended, not only to make more pauses than NNS, but also to insert them at particular points within the text. There was a high degree of within group concordance with large between group differences. The contingency coefficient
2
testing the between group differences gave -K= 17.294f=1, P<.001, for the psychology text; x =4.97, df=1,P<.05 for the war text; and -X! =26.99,df=1 ,P<.001 for the plant passage. In other words, the NS identified more pauses. The tendency was for both groups to agree on a number of pause locations with the NS going on to specify other pauses not accepted by the NNS. The NNS rejected 13 stops out of 21 (i.e. 61%) accepted by at least 50 per cent of NS. (To maintain homogeneity, within groups pauses were scored only when at least 50 per cent of the group accepted the positioning. Even, according to a more
stringent criterion, 70% agreement, the tendency remains the same). The NNS also rejected 20 out of 36 (55%) and 6 out of 19 (31%) in the other 2 passages.
However, it was necessary to replicate the findings if they were to be considered valid since there were only 10 subjects in each sample group.
The same pattern of results was shown in a repeat study by Thatha (1983). In this study, the number of subjects was
with the previous ones. The differences between the 2 groups were still maintained, although not as clearly as before. The contingency coefficients found were:
2
-
k=12.31, df=1, P<.001 (psychology text)!CX =4.18,df=1 , P<.05 (war text);N!=7.29, df=1 , P<.01 (Plant text). If these findings do reflect a reliable and consistent trend in behaviour patterns, then they are of theoretical and
educational value. From a research point of view, the challenge would be to isolate the determinants of the observed differences. A number of possible theoretical models could be invoked to
explain the mechanisms behind the differences. These would include a model based on the information processing of the learner , the learner's experience with the content of the subject matter, the learner's cognitive ability and also the learner's experience with the language.
The focus of research would be to examine the explanatory power of each of these to identify the relative contributions of each. On the education side, the practical advantage of assisting non-native speakers of a language to process written information using similar mechanisms as native speakers is obviously attractive. The possibility of identifying a simple method of operationalizing the difference in processing
CHAPTER II
In order to verify the reported fiaUngs of Matambo and Thatha, a study was designed as a new replication using an increased sample of 40 subjects: 20 NS and 20 NNS.
Experiment I
Preparing the learning material
A number of conditions were observed when preparing the English text to be used (see A. Matambo, 1982).
1 - The text had to be self-contained.
2 - The text had to be equally familiar to all subjects regardless of their level and ability in different disciplines.
3 - The text had to have an argument supported by evidence.
4 - Although equally familiar to all the subjects, the text should require a minimum prior knowledge about the topic so that at the end of the process of
reading most of the information would be newly acquired.
5 - Finally, the text should have a reasonable length in order to control the effect of fatigue.
These conditions led to choosing the following texts: i) Snellgrove (1968) - 'The modern world since 1070' -
Hiroshima (698 words).
iii) McKean (1962) - Introduction to Biology - The Stem of a flowering Plant (738 words) (See appendices I-a-b-c)
Subjects
The findings were replicated on the three passages. The first language of the 20 NNS included Danish, Malaysian, Spanish, Chinese, Arabic, Iranian and French. The age range of the group was 18 to 34. Their academic level ranged from secondary to University level.
Procedure
The instructions given were similar to those used in Matambo's research. They were also followed by comments and
examples to make sure the subjects understood them (Appendix II). Each subject was told in English:
'Commas and other punctuation marks usually indicate where it would be convenient to pause. They do not indicate all the
possible places where a reader could naturally pause. Your task is to put a line through all the places where it occurs to you that there is a pause. I imagine that some pauses will occur after just a few words while others will occur after many more words. This does not matter, neither is it important
if the different pauses occur for different reasons. For example, it is likely that one pause may occur simply to enable the
reader to catch his/her breath. Another may serve to enhance the meaning and so on: the only restriction on where you
16
Each subject was first given the instruction, followed by the text. The subjects were required to mark pauses while reading it. This procedure was repeated for three passages. The order of presentation of the 3 passages was counterbalanced before presenting them to the subject.
Treatment of results
An initial analysis was carried out on the raw data. Before considering the results offered by the contingency tables and to cross check the present results with those of the previously stated findings, a first overall comparison in the total number of allocated P.Us, before the 15 and 50 per cent criteria are introduced, was deemed necessary. That is a preliminary question was aimed at establishing whether there is a difference between NS and NNS in the overall P.Us allocated for each text. A comparison of this category would represent a gross view of the phenomenon which will be further closely looked at.
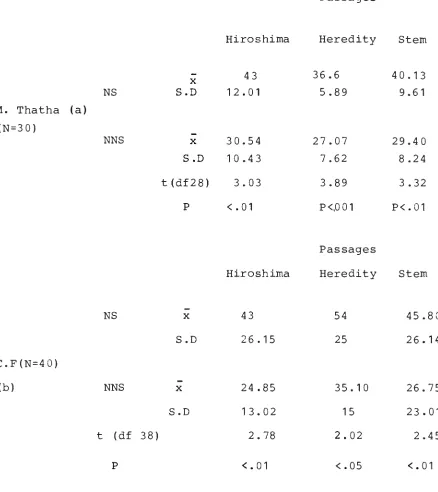
A t.test was performed to compare the number of P.Us allocated by NS and NNS for each text separately.The
considered for this purpose included those that coincided with punctuation except for full stops. Table (II-1) below shows the result of the t. test for both Thatha's data (1983) and those of the present experiment. The difference in the overall number of P.Us as allocated by both groups of subjects, reached statistical significance, (all at least p<.05)
17
NS S.D
M. Thatha (a) (N=30)
NNS
Hiroshima
43 12.01
30.54
Passages
Heredity 36.6
5.89
27.07
Stem
40.13 9.61
29.40 S.D 10.43 7.62 8.24 t(df28) 3.03 3.89 3.32 P <.01 P<,001 P<.01
Passages
Hiroshima Heredity Stem
NS x 43 54 45.80
S.D 26.15 25 26.14
C.F(N=40)
(b) NNS x 24.85 35.10 26.75
S.D 13.02 15 23.01
t (df 38) 2.78 2.02 2.45
P <.01 <.05 <.01
Table (II-1): shows the result of the t. test for both Thatha's (a) and the present experiment (b).
18
19
The next question considered the data from a closer perspective, after a) the omission from the analysis of all
pauses that coincided with punctuation marks; b) the introduction of the 15 and 50 percent criteria. These criteria were defined as follows:
A P.0 was considered to be above chance level, if at least 15% of the sample indicated it. For group acceptance however, it had to be marked by 50 per cent or more of each sample. All P.Uswhich coincided with marked punctuation marks such as full stops, commas, semi colons, colons etc were omitted from the analysis. Only those which the subject imposed unaided were retained in the analysis. The criterion for accepting a P.0 was therefore:
Each P.0 marked by 50 per cent or more of the NS was judged accepted by that group. Similarly, those agreed by
50 per cent or more of the NNS were considered accepted by the group. P.Usmarked by less than 50 per cent were judged unaccepted by this group.
In practice, there was a clear difference in responses between P.Us which were accepted and those which were rejected. The range of accepted and non accepted P.Us are given in
Results
Tables (III-a,b,c) in the Appendix show all the P.Us and the rating given by the NS and the NNS for each article. A contingency table was drawn up summarizing the level of agreement and disagreement between the two groups. The
contingency table used the P.0 as its unit of analysis. Each unit received a Yes or No judgement from each independent group of students. There is no overlapping category in the contingency table, since each unit is placed in a discrete category by the judges (e.g. table II-2a,b,c).
It is worth noticing that the 20 NS and 20 NNS judges serve simply as an independent criterion for classifying
the P.0 into the accepted or non-accepted category. Therefore, the contingency table is divided into acceptable and
non-acceptable P.Us. This satisfies the independence of responses required for a contingency table. Each contingency table
drawn up for each article in this experiment was followed by contingency tables from Matembo's and Thatha's studies on the same article.
The analysis carried out was aimed at establishing the degree of discrepancy or similarity in the contingency tables. Thus a contingency coefficient analysis was adopted to look at the differences between the ratings of first and second language users. This was repeated for the three articles (see Appendices Iv-a(1)b(1),C(1).
21
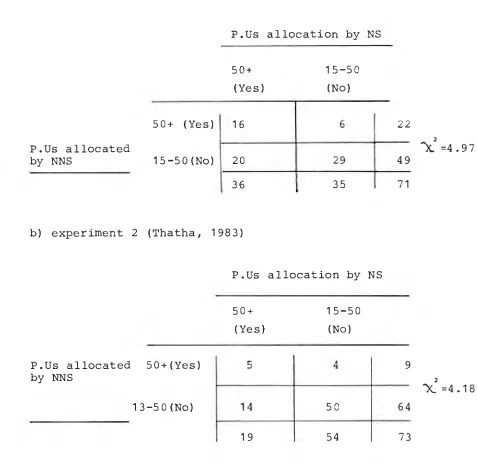
Table (11-2): Relation between acceptable and non-acceptable units for the Hiroshima passage.
a) experiment 1 (Matembo, 1982)
P.Us allocation by NS 50+
(Yes)
15-50 (No)
50+ (Yes) P.Us allocated
by NNS 15-50(No)
16 6 22
..)(. =4.97
20 29 49
36 35 71
b) experiment 2 (Thatha, 1983)
P.Us allocation by NS
50+ (Yes)
15-50 (No)
P.Us allocated 50+(Yes) by NNS
13 -50(No)
5 4 9
"X!=4.18
14 50 64
' 12
c) experiment 3 (Fourali, present one)
P.Us allocated by NS
50+ (Yes)
15-50 (No) P.Us allocated
by NNS
50+(Yes) 7 1.9 4 9.1 11
k.2 =17.72
11.1
52.915 -50(No) 6 58 64
13 62 75
Table (II-2), showing degree of agreement on pausal units as given by Native and Non Native Speakers of English for 'Hiroshima' passage. The 3 experiments are compared
(c.f calculations are reported in Appendix IV).
2
The X_ applied to the Hiroshima passage for the present
, 2
experiment showed a difference of X. =17.72, df=1 (see Appendix Iv, for calculations). This was highly significant (P<.001), even more significant than the results obtained for the two previous studies. A further depth analysis of the contribution of each
, 2
cell to the X. results was carried out as recommended by
Guilford (1965 p.232). Thus taking only the cells 'al and '1D1 ', that is those showing the disagreement between the 2 groups, the obtained X.= 6.26 df=1, was significant (p<.05). In fact, the main difference seems to be concentrated in cell 'b
is on the number of pauses accepted by NS and yet rejected by NNS. Hence, the present study does reaffirm the previous findings. Conversely, the number of P.Usrejected by NS out of those accepted by NNS is comparatively insignificant. As pointed by Matembo (Ibid.) in his research the data pose a different slant from what would logically be expected.
The NNS, as second language users, would normally be expected to use more, rather than less mental pauses for the proper comprehension of a text. Here, the opposite seems to be the case.
One wonders if the results do reflect a genuine difference between the two groups. In fact it could be possible that
the subjects are just putting the pauses hap-hazardly. The obtained coefficients of concordance for 2 by 2 contingency table as outlined by Croxton and Cowden (1962)r=o.30, r=0.25 r=.50) do suggest that it is not the case since the obtained correlations show that there is a basic level of agreement
between NS and NNS. (Appendices IV-6 (2), b(2)c(2) for calculations) This agreement can be more closely verified by looking at
24
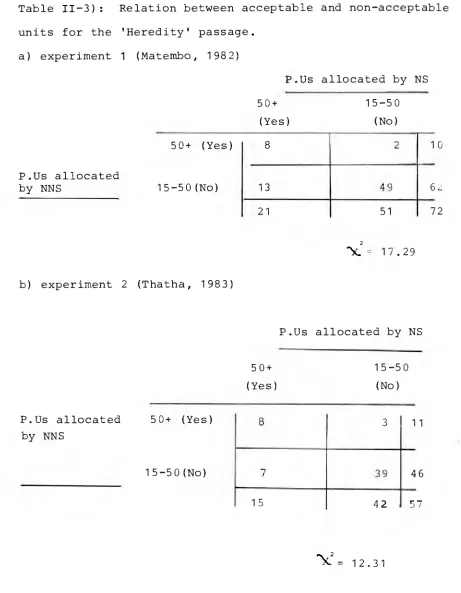
Table 11-3): Relation between acceptable and non-acceptable units for the 'Heredity' passage.
a) experiment 1 (Matembo, 1982)
P.Us allocated by NS
50+ 15-50
(Yes) (No)
50+ (Yes) 8 2 10
P.Us allocated
by NNS 15-50 (No) 13 49 62
21 51 72
= 1 7 .29
b) experiment 2 (Thatha, 1983)
P.Us allocated by NS
50+ (Yes)
15-50 (No) P.Us allocated
by NNS
50+ (Yes) 8 3 11
15 -50(No) 7 39 46
15 42 57
25
c) experiment 3 (present one)
P.Us allocated by NS
P.Us allocated by NNS
50+ (Yes)
15-50
(NC)50+ (Yes)
15 -50(No)
8
1.3
8.7
2 10 2
-)1(.. =38.45
7
13.7
10295
102.
15
97112-
Table (II-3) showing degree of agreement on P.Us as given by NS and NNS of English for the 'Heredity' passage. The 3 2 experiments are compared. (details of calculations of
both -X.
and 'rs' is in Appendix IV).Looking at the article on 'Heredity', (Table 11-3) again we find the same level of significance in the newly
2 2
obtained results (X.=38.45) and the previous ones ().=17.29 - A.M and2=12.31-MT). All of them significant at .001 level. TheN._. based on the disagreement cells (a2 ,b 1 ) was also
significant (K.=9.67, df=1, p<.01). The Croxton and Cowden coefficients showed again a basic level of agreement
(M; r=.48;T;r=.51; F;r=.61). The resulting trend is confirmed since NNS repeatedly:
a - indicate less pauses than the NS. b - reject a large number of the units
26
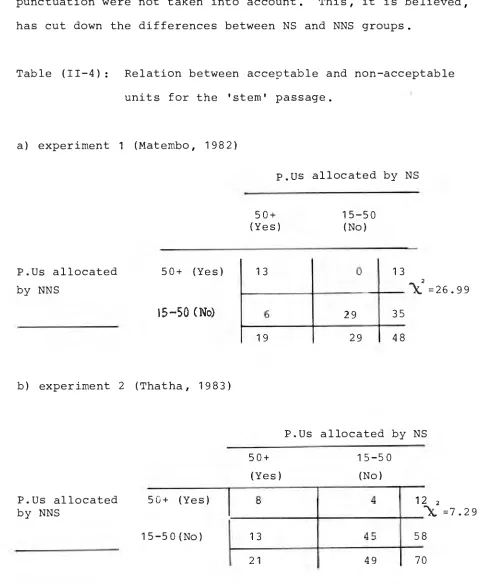
Before going further, one important point has to be made. It is that in both experiments, all the used articles were punctuated. Thus the P.Us that coincided with the
punctuation were not taken into account. This, it is believed, has cut down the differences between NS and NNS groups.
Table (II-4): Relation between acceptable and non-acceptable units for the 'stem' passage.
a) experiment 1 (Matembo, 1982)
P.Us allocated by NS
50+ 15-50
(Yes) (No)
P.Us allocated 50+ (Yes) 13 0 13
by NNS X =26.99
15-50 (No) 6 29 35
19 29 48
b) experiment 2 (Thatha, 1983)
P.Us allocated by NS
50+ 15-50
(Yes) (No)
P.Us allocated 50+ (Yes) 8 4 12 2
by NNS =7.29
15-50(No) 13 45 58
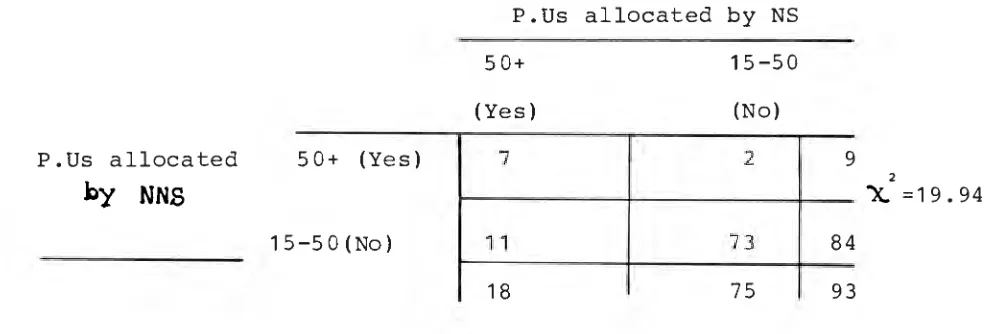
50+ (Yes) 7 2 9
-50(No) 11 73 84
18 75 93
P.Us allocated
by NNS
15
2
'X. = 1 9 . 9 4
27
c) experiment 3 (present one).
P.Us allocated by NS
50+ 15-50
(Yes) (No)
Table (II-4), showing the degree of agreement on P.Us as
given by NS and NNS for the 'Stem' passage. The 3 experiments are compared. (calculations are in Appendix IV).
The analysis for the 'stem' article (Table 11-4)
showed the same trend observed for the two previous articles. That is there a general level of agreement concerning Pausal recognition, with NS consistently accepting a higher number of pauses. Once more all the obtained . 02 showed a high
degree of significance with M. (26.99,P<.001); T. (7.29,P<.01) and F. (19.94,P<.001).
2
The 1. yielded by cells a2 and b1, was also significant (1!= 6.61, df=1,P<.05).
deemed necessary for proper comprehension by the NS of the language. This outcome must be of some educational relevance as already indicated.
Thus, it was seen that the previous results (Matembo, 1982; Thatha, 1983) are repeatable both in terms of number of P.Us and their positions.
The next stage of the enquiry is to try to identify which among the possible explanations account best for the obtained difference.
Before embarking on this investigation, a qualitative analysis and description of the phenomenon seems appropriate. The
CHAPTER III
29
QUALITATIVE ANALYSIS
In order to investigate the phenomenon qualitatively, an experiment was set up where both NS and NNS were repeatedly presented with the same text for a total of 5 trials over
4 days - twice on the first day.
Qualitative Analysis
The qualitative analysis proceeded by first identifying the P.Us on which both groups disagree. Then, it sought to detect existing patterns in the text where these disagreements occured. For this purpose the pauses made by 50% and over at every word were considered.
Two tables were drawn up for the NNS and NS. See Appendices VI, a,b. The tables show the number of each group pausing
after any given word of the text. Only words where 50% or over paused on at least one trial are included in the Tables.
For clarity, an example from the NNS table is given below. The complete tables are on.Appendices VI,a,b.
Words of Text % pausing after each word
Trials
Corrarent
1 2 3 4 5
For / / / / / % responses exceeds 50% on no trial. Hence omit from table.
Some / / / / / II II II
Years 27 36 45 45 54 % response exceeds 50% on fifth trial. Scientists
had known that if an
atom 50 59 73 63 63 / / / / / / / / / / Explosive 77 77 86 86 86 in / / / / /
1939 41 45 45 50 59
31
The Hiroshima Text used in this experiment, had all
its punctuation marks removed; except capital letters
in names of people and places, were retained, as well as the
paragraphs. Hence it was possible to include in this analysis
also the pauses that in the previous text coincided with the
punctuation marks (Appendix V).
The raw data were convered for qualitative comparison.
A Table of disagreement was then constructed using a gap
of 30% or more as the criterion for inclusion in the analysis.
Table 111-2 gives the words marking the positions where
the groups diverged in their
gap is also indicated.
Trial 1 % Trial 2 %
judgement.
Trial 3
The percentage
% Trial 4 Trial 5
1 physicist 31 years 39 Fermi 37 physicist 30 physicist 41 2 1945 34 physicist 39 reaction 46 Einstein 37 Einstein 37 3 away 37 Fermi 49 sound 38 Fermi 53 Fermi 53 4 light 32 reaction 31 oven 32 reaction 45 war 35 5 fire 32 proportion 42 it 33 Gay 40 reaction 40 6 faces 30 mornings 32 bodies 51 sound 30 sound 30 7 bodies 34 opened 37 breakfast 41 faces 32 oven 46 8 trees 34 sound 34 blaze 49 exclaimed 38 slowly 46 9 escape 37 it 32 flames 37 since 35 faces 41 10 bomb 41 faces 46 disease 41 bomb 39 bodies 45 11 flames 37 bodies 42 day 46 day 46 breakfast 50 12 exclaimed 34 ground 37 innocent 37 Hiroshima 41 disease 41
13 died 32 bomb 41 bomb 3C
14 disease 31 flame 37 day 53
15 day 46 exclaimed 46 16 innocent 32 died 32
17 disease 53
18 bomb 30
19 day 46
20 innocent 33
34.6 38.9 40.6 38.8 42
Table 111-2. Pausal disagreement of 30% or more between NS and NNS percentage scores are calculated by subtracting percentage of NNS allocating the pause at the same place. With successive trials, there is two observed tendencies.
As would be expected, percentage scores were
positive. This followed our previous quantitative result that native speakers tended to draw more P.Us than the rest. In fact all the percentages were positive.
Also in the first two trials there seem to be more observed differences, an average of 18 words compared to 12.6
words for the three remaining trials. This could mean that although NS seem to be quicker in recognizing some pauses on the first trial, NNS tend to recognize them when given a second chance at the task. However, the average of the difference scores for each trial tend to increase with practice.
In the early stages, the NS identify many more P.0 locations. By the 3rd Trial, however, the NNS start to
identify some of the previously omitted pauses. The observed tendency for the gap between the groups i.e. the degree of disagreement, to widen over trials could be explained by the fact that only part of the NNS group were recovering from the blind spot effect and recognising the previously omitted locations for pauses.
However, there were some pauses that NS consistently recognised and which NNS did not. Hence it was judged of importance to focus on these consistent differences
33
Thus any pause whose obtained difference is 30% or above and which was repeated over 4 or 5 trials was selected for further analysis. There were eight such locations
(Appendix VII (a)). Subsequently the textual locations obtained in this manner were regarded as indicating structural blind
spots that the NNS seemed to ignore.(1)
In an attempt to reach some explanations about this observed difference, 3 experts in English, all native graduate teachers of English were invited to offer any suggestions
e.g. try to discern any pattern or underlying structure characteristic of these observed P.0 locations in the text
(Appendix VII). On the whole, apart from the tendency of the NS to dissect more the parts of a sentence (e.g. dependent clause and main one such as pausing after 'proportion' in line 11; or change in subject after the verb 'opened' in line 22); it seems that NS identify better not only the various parts of different ideas but also when and where each one starts and
finishes (e.g. it was suggested that some differences in pausing may have been a consequence of a failure by NNS to recognize the function of a word; thus taking a name for a verb such as 'light' in line 27. Or line 29 where the idea finishes at the word 'been' but the NNS stopped only two words later, including them to the previous idea. Another reason of dis-agreement could be the pausing by NS for dramatic effect e.g. after 'sound' in line 26.
-34
Considering these different suggestions, a number of reasons can be put forward to account for the observed differences. The following ones are those that were thought the most important:
1 - to separate ideas 2 - dramatic effect
3 - unconscious cues (triggering effect) 4 - unfamiliarity
5 - to complete idea units (self contained idea unit, i.e. setting up a unit)
6 - end of lengthy predicate (or subject) 7 - e numerating
Looking back at the group of locations where the differences between N.S and NNS was consistent (4 ana5 times) it was felt that this latter group did not seem to be sensitive to the following textual situations:
1. separation of noun from action
2. separation of descriptive phrases (ideas) from events 3. separation of repeated phrases or ideas
Thus all these eight significant pauses could be put under either of the three above mentioned categories.
35
Category I Category II Category III
physicists Fermi
- reaction - sound - faces - books - diseases
day
Table 111-3. Three categories of failures to account for NNS structural blind spots and their corresponding pauses in the Hiroshima text.
The NS identify more easily not only the general ideas of the text but also their components - or subcomponents. Thus it appears that even if a non native speaker reaches 'mastery' of the English language, there may still be some deficiency regarding certain structural or cognitive components that
prevent him/her from attending to all the constituent parts of the information. This level of mastery would have been acquired by NS at some earlier stages. A more thorough investigation of these blind spots would represent a significant contribution to the knowledge of NS/NNS differences.
36
Researchers such as Rummelhart (1975) and Thorndyke (1977) have tried to extend the case grammar issue and its set of rules for finding the relationships between a predicate and its argument (Fillmore, 1968) in a sentence, to the field
of story writing. The result of this endeavour led to the suggestion of some parsing rules that specify the relations among simple
sentences within a story. (Thorndyke, 1977). These can be summarized as follows (Mayer, 1981).
Rule 1 : STory = Setting + Theme + PLot + Resolution.
These four categories are said to include each of the simple sentences that make up a story.
Each of the four categories was further subdivided into its constituent parts. This description into the subcomponents led to the formulation of the following rules:
Rule 2: Setting = Characters + Location + Time
Thus a setting generally includes the characters that took part in a story, as well as the specific location and time. Rule 3: Theme = Event(s) + Goal
A story revolves around a theme which generally consists of a number of events that lead to the need of achieving some goal. Rule 4: Plot = Episode(s)
In order to reach a goal, usually a number of sub goals or episodes have to be realised. Thus:
Rule 4a Episode = Subgoal + Attempt(s) + Outcome
Rule 5: Resolution = Event or State
Resolution consists of the final outcome of a story. This can either consist of a state or an event.
The aim of this section of the qualitative analysis is to try to ascertain whether the blind spots tend to occur at certain parts of the text (e.g. Setting or Theme) rather than others (e.g. plot or resolution). .
Three native graduate teachers of English were requested to delineate the various parts of the text that represent
its story grammar. They were first introduced to this concept and a description was given to them as to what each part of
components or subcomponents represent. Once they were satisfied with the description they were provided with a copy of the
Hiroshima passage and a pencil to carry out the task.
The 3 obtained constituent parts of the passage are shown on Appendix VII(b). Initially the aim of the three judges was to identify all four parts of the story grammar;
but it has been pointed out by all of them that in the Hiroshima text, both setting and Theme are intermingled.(*1)Thus, and for ease of analysis these two ingredients were considered as one whole part.
(*1) There has even been the suggestion that there is more
The results were as follows:
Table 111-4: showing the occurence of the blindspots at the 3 story grammar levels.
Setting/Theme Number of
Plot Resolution
blindspots 3 5 0
Percentage in
number of words 1 1 0
These results were not seen as indicative of any tendency. Thus although, one could state that most of the blind spots are gathered around the Plot area as against
Setting, Theme and Resolutions parts, the relative proportions corresponding to each of these levels are too disparate to venture any serious interpretation.
SUMMARY
Further investigation of Matembo's finding reveals the following:
1. The findings are consistent and repeatable. 2. The difference between the NS and the NNS shows
a recognisable pattern with both groups identifying the same P.0 locations.
3. The NS went further than the NNS and identified more P.Us .
4. The difference between the NS and NNS, having been validated quantitatively was explored qualitatively. 5. The qualitative analysis revealed consistent textual
response patterns separating the groups.
6. NNS tended to omit certain categories of pausal locations. These were described as:
a - pauses separating noun from action .
b - " descriptive phrases from events. c - " repetitions of phrases or ideas. 7. The difference between the group P.0 allocations
was not noticeably affected by story grammar.
The next stage of the research is directed to the
The approach used was to develop ways of monitoring different types of cognitive processes involved with text comprehension.
CHAPTER IV Overview
This stage of the investigation was devoted to identifying the mental operations which contribute to performance on the P.0 test. From these relevant processes, the next step would
be to isolate those which discriminated between the NS and NNS. For this purpose a test battery was constructed on the
basis of the Watson and Glaser critical thinking test(AppendixVIII) Five essential mental operations were monitored by this battery These were Inference, Assumption, Interpretation, Evaluation and Deduction. The battery was administered to the groups of NS and NNS students. An intercorrelation matrix suggests that these 5 tests could be grouped into 3 identifiable sets which were labelled 'schema-related', 'ability-related' and a 'unique factor'. The results also showed that the groups differed
significantly in terms of the 3 schema-related processes. They did not differ on the ability factor or on the 'unique factor'. In order to account for P.0 differences in terms of these
underlying mental processes, performances on the test battery were correlated with P.0 scores. The correlations were
CHAPTER IV
UNDERLYING DIFFERENTIATING PROCESSES
Procedure
In order to arrive at an appropriate procedure, the recently developed Expert/Novice paradigm was used as a theoretical frame of reference (Glaser, 1984). Glaser's recent formulations of this paradigm start with the notion that performance results from 3 components: ability, schema and strategy.
The difference between the Novice and Expert in performance is in the way in which each weighs and combines these 3
components. A clearer picture of the way an individual processes information can be obtained by requiring the individual to
perform tasks which make different demands on each of the three component processes. If, for example, a task makes heavy
Some , for example, would make greater demand on the learner's knowledge. Some make theirgreatest demand on ability, others require greater use of strategy.
The Watson and Glaser test although subject to criticism (e.g. Levy and Goldstein, 1984 ) does provide a measure of five complex high level processes. These are:
Inference, Assumption, Interpretation, Evaluation and Deduction (Appendix VIII). The name given by the authors to each separate process seems less important than the exact mental process
that is being exercised by the testee. Hence it is necessary for our purposes to carry out an analysis of what the subject is expected to do in order to successfully complete the tasks. From this, it may emerge that the processing for each task should be renamed.
Analysis of the Watson and Glaser processes. Inference
The 'inference' process as defined by Watson and Glaser require;a subject to draw a conclusion from certain observed or supposed facts. Thus, according to Watson and Glaser
'from the electric light visible behind the window shades and from the sound of piano music in a house, a person might
Five categories of responses are permitted. An inference may be definitely true, that is, follows beyond any reasonable doubt; or it may be probably true, that is better than an even chance to be true; or there may be insufficient data which means that the information available is not enough to support the inference; or it may be probably false which is better than an even chance to be false; or it may be definitely false, that it contradicts the given facts. Watson and
Glaser go on to acknowledge that on deciding whether an inference is probably true or false, subjects may have to use commonly accepted knowledge of information. It is
worth noticing that our expert judges found it difficult to differentiate between this process and that of 'deduction' which will be considered later. The inference test measures the facility to use schema. This is particularly true for items that are probably true or probably false. In order to arrive at a decision, the subject is expected to assess from past experience the strength of the association between the events described in the given statement of fact and the
conclusion reached. If from previous experience these events are inseparable, the answer would clearly be true. If they frequently occur together the answer would be that it is 'probably true'. If they only occur together when some
unmentioned event is present, then the answer is 'insufficient data'. If from experience, they occur together only rarely,
45
answer is 'false'. The subject must rely on his previous experience schematically organised. From Watson and Glaser's own description 'common knowledge' is a vital ingredient of success in this task.
The difference between these inference tasks and the deduction tasks which will be described later is in the degree of reliance on past experience. Deduction, by its nature is experience free and depends on logical arguments from a given premise. It is unexpected therefore that the three professional judges found difficulty in distinguishing the 'Inference' items from the 'deduction' items. The reason could rest in the failure of Watson and Glaser to adhere rigidly to their own basic
principles in constructing the items. A detailed analysis of the items under 'Inference' show that a number of them rested heavily on experience free logical arguments.
Assumption
An 'assumption' is something pre-supposed or taken for granted. When someone states for example, 'I'll graduate in January', he takes for granted or assumes that he will be alive in January, that the school will judge him to be eligible for graduation in January and so on.
The subject is presented with a statement followed by several proposed assumptionsSMe will have to decide which of these are being made (i.e. taken for granted justifiably or not) when making that statement. Two possibilities of answering
46
thinks it is taken for granted in the statement or 'not made' if s/he thinks it is not necessarily taken for granted. Once more, a heavy reliance on past experience is necessary in order to recognize an assumption. This is clearly shown from the examples given in the Appendix. The assumption is an
intermediary process (event) which links the beginning statement and the final conclusion. The question is whether the linking statement is based on logic or past experience. Most of the examples given by Watson and Glaser include both logic and past experience. Hence, in this case, schema availability is quite decisive in carrying out this task.
Interpretation
In the 'interpretation' performance, a short paragraph is read. Subjects are required to assume that all that is read is true. They will have to judge whether or not a proposed
conclusion logically 'follows', i.e. beyond a reasonable doubt, although it may not follow absolutely and necessarily. A
second possibility is that the conclusion does not follow beyond a reasonable doubt from the facts given. From the example given by Watson and Glaser, it can be noticed that a heavy reliance on intellectual ability is necessary to decide between the two alternatives (test in Appendix VIII) . Let's analyse the mental operations involved.
47
be tested by linking the original statement and the concluding statement by the phrase 'From that it appears....'. This
process involves a mental comparison between the first statement and the concluding statement to assess whether they are the same. Therefore, here, apart from linguistic
mastery, past experience does not seem to be a vital ingredient. Deduction
For 'deduction', the subject is presented with 2 statements or premises, which have to be taken as true. These are followed by several suggested conclusions, classified into 2 categories: the conclusion either necessarily follows from the given
statements; or does not follow whenever it is thought to be unnecessary, although it might be believed to be true from general knowledge. Unlike the case for 'inference' general knowledge can be a hindrance rather than a help. Thus a minimum reliance on schema is encouraged in this exercise. What seems to be mostly stressed in the examples given in
the appendix is more 'a logic in the abstract' than background knowledge.
Evaluation
In order to 'evaluate' arguments, the subject is required to differentiate between a 'strong' and a 'weak' argument.
A strong argument is the one that is both important and
48
related only to trivial aspects of the question.
A series of questions are followed by several arguments, each one regarded as true. The task is to judge an argument to be a strong or a weak one.
As can be seen from the examples given in the test, the ability to judge seemsrather important in this task. This includes both culture bound components and ability. Therefore it would seem difficult to account for the relative use of either schema or ability.
The evaluation of this test by Levy and Goldstein (1984) expressed some concern relating to its content and construct validity. These authors do formulate some doubts as regard its reflection of some real life situations where such activities as judgements, inferences and gambles in decision making are involved. Another shortcoming is the lack of a clear evidence about predictive validity. This test is quite unusual in its conception when compared to more conventional intelligence and achievement tests, and offers an insignificant
MODIFIED WATSON AND GLASER TEST
In the view of the uncertainty about the precise nature of the process measured by the Watson and Glaser,
a modified version was constructed for this study.(Appendix IX). However some basic changes were introduced.
The first change concerns the mode of responding employed. Whereas the Watson and Glaser described the mental operations being used and asks the subject to confirm the examples as true or false (a recognition mode) the modified test required the subject to perform the mental operations and it was then assessed for accuracy (a problem solving mode).
A second change relates to the meaningfulness of the exercise. The Watson and Glaser test presented short unconnected statements (Asking for the)subject's reactions to them. The modified test
presented a meaningful connected discourse requesting the subject to say what he or she understood from it.
A third change reflects the ecological or naturalness dimension. The Watson and Glaser artificially presents a series of 'inference' items, then a series of 'assumption' items and so on. The
modified test requires the subject to carry out a normal
reading and acquisition task during which a series of different processes are mixed.
The modified test presents questions some of which require accurate 'inferences', some require accurate 'assumptions'
and so on. Scoring is done by counting the number of 'inference' questions accurately answered, the number of assumption
questions accurately answered and so on.
Once again of the three texts previously used, the Hiroshima one was chosen to construct this test. However as in the qualitative study the text was not punctuated.
Only the beginning of each of the 4 paragraphs started with a capital letter (see Appendix V-b).
As can be seen below, some changes were also made to account for the modifications to the text (Appendix V-a).
Instruction (given to the subjects)
'Punctuation marks do not indicate all possible
places where a reader could naturally pause. Some pauses will occur after one or two words while others occur after many more words. This could be due to reasons such as to catch your breath, to enhance meaning and so on.
The article you have been given is not punctuated. Please read it through at your normal reading speed. The task consists of putting a vertical line whenever you feel you would naturally pause. This should be done while you are going through the article. It does not matter if you think you have made a mistake; just carry on until you finish the whole text.
The changes were made, to emphasize the lack of
punctuation as a new situation, and also as a result of the general comments made by the subjects in the previous
experiment regarding the clarity of the instructions. The degree of understanding of the information was measured using the modified test. It consisted of 5 sub-tests measuring
subjects' capacity of infering, recognising assumptions, interpreting information, evaluating various arguments and deducing new information.
Question Selection
Questions were formulated based on the text.
Each question was intended to engage the subject in one of the 5 mental operations. For example in question 1, (see Appendix IX-b) used to test the interpretation process, the subject was required to identify a reason from the three suggested answers, for the selection of the school near Los Alamos to carry on the final testing. In order to answer this, s/he has to compare systematically a previous statement that appeared in the passage with each of the proposed concluding statements offered in the test for this question. Of these statements, the one(s) that the subject judges beyond a
reasonable doubt as being an appropriate reason for selecting the school near Los Alamos and as being consistent with all the given facts will be chosen. In this case answer 'a' is
in a lonely spot was selected.
The initial pilot contained 40 items approximately 8 for each operation. These were submitted to 5 judges who were asked to identify which of the 5 processes related to each question.
A Table of agreement was drawn up and only items on which all 5 agreed were eventually used. The final test contained
15 questions: 3 for each process (see Appendix IX-b) Procedure.
Each item started with a statement followed by a multiple choice test. Twelve of these items contained only one correct answer each. As in the original Watson and Glaser (Ibid.) test, there were unequal number of maximum scoresfor each process. There were 3 correct answers for question 5, and 2 for questions 14 and 15. This allowed a maximum of 19 correct scores. The unequal scoring did not affect the analysis since in treating the data cross comparisons between processing are not made. Only within process and between group
53
Processes Questions Maximum Score
1. Inference 6,7,8 3
2. Assumption 5,12,14 6
3. Interpretation 1,11,15 4
4. Evaluation 2,9,10 3
5. Deduction 3,4,13 3
Total 15 19
Table IV-1: showing the questions in the C. Critical Thinking test relating to each process and their corresponding maximum score.
The Comprehension Test was started by instructions describing how to use it. Thus, subjects were told that each
exercise began with a statement followed by several possible
answers. Also that the answers were derived from the text through either a process of Deduction, Assumption, Interpretation,
Evaluation of arguments or Inference. They were informed that there might be more than one right answer for each question: Lastly they were asked to put down their responses just by ticking what they believed to be the correct ones.
One hundred and seventy pairs of scores were collected for each process from subjects in a pretest (Each subject
54 ,
Results
An intercorrelation matrix was constructed giving
the correlation coefficients between each subtest and also
the correlation of each subtest against the total. The results
are provided in Table IV-2.
Table IV-2 = gives the coefficient of correlations between
each of the 5 processes of C. Critical Thinking Test and
the rest.
Infer.
Int.
Eva.
Ded.
Infer. Assum Interp Eval. Deduc.
.20 .45Schema
.29 .36 .41
. 1 4 .15 .11 .05
Total .56 .77 .71 .66 .42
Inter correlation matrix showing structure of the test of
the C. Critical Thinking. Data is based on a sample of
170 pairs of scores.
For significance at P<.05, r<.19; at P<.01, r<.25; at
Based on the theoretical prediction and construction procedures, one expects a structure in which 'assumption' and 'interpretation' would form a distinct subgroup being both based on schematic
background. The other 3 subtests would constitute a separate grouping. Therefore, at least 2 clusters of subtests would be anticipated. The groupings should of course, have greater within correlations than between correlations.
The results show a main grouping in which 'assumption',
'interpretation' and 'evaluation' are highly intercorrelated. Each of these 3 correlations is at least at the level of
P<.001. The other 2 items do not seem to constitute a separate grouping but to maintain independent identities.
Deduction, for example is not significantly correlated with any other sub test. It maintains a position in the battery on the basis of a very significant correlation with the total test score.
Similarly inference has some claim to independence as an item being highly correlated with the total test score and not
correlated with deduction. Inference is more closely associated with the main grouping than is deduction, but the overlap is sufficiently low to leave a large percentage of unexplained variance. We assume that some of that unexplained variance is attributable to the unique contribution of inference to this battery of tests. The data supports the detailed qualitative
these correlations, it is not unreasonable to surmise that the main grouping of assumption, interpretation and
evaluation is measuring schema influences; the deduction subtest is measuring ability, while inference reflects some schema with an unspecifiable component.
The data supports the construct validity of the modified test. Each subtest contributes meaningfully to the total score. It also throws some light on the inter relationship between the different sub tests.
These analyses taken together support the view that a schema related subgroup of test can be identified and compared with the ability related test (Deduction) and a mixed effect test (Inference).
It should be possible therefore to identify which of these subgroups of test discriminates between the NS and NNS.
The results are presented in the table below. The performance of the subjects differ significantly according to the subtest and group membership.
Table IV-3: giving the obtained averages for each process of each group and the calculated t .t est.
Inf. Ass. Interp. Evalu. Deduc. Comprehension NS
R
2.5S.D .75
3.75 .97
2.80 .68
2.02 .76
2.42 .59
13.48 2.40 NNS
X
2.5 3.34 2.25 1.83 2.28 12.2S.D .73 1.27 .96 .83 .84 2.96 t(df 168) 2.20 3.89 1.45 1.11 2.88 P N S P<.01 <.001 NS NS P<.01
1.65 <.05 2.33 <.01
The differences between the groups were evaluated on the one tailed t ,.test. The one tailed version was used because of the directionality involved in the hypothesis. They differed
significantly on assumption, interpretation and on evaluation. The other differences did not reach the level of significance. These results support the deductions made on the basis of
2
and scores on the different tasks a W of .076 was obtained for the interpretation task and .022 for the assumption task. This means that being an NS gave a 7.6% advantage in doing the interpretation and a 2.2% advantage when performing the
327 *
assumption task W ays, page 070) 1 , The NS so far seem to outperform the NNS on processing tasks which rely on past
experience. It is notable that 'deduction' as operationalized by the modified test relies more on ability, and 'inference' relies on a mixed factor. As a result, the groups do not differ on these items . The first hypothesis received strong support from these data.
*1 The evaluation process was calculated for degree of
association with group membership. The result was insignificant
2
59
The exercise carried out earlier suggests a grouping of the five tests in schema related (assumption, interpretation and evaluation), ability related (deduction) and mixed
(inference). By collapsing the appropriate cells and calculating the group differences a more direct test of the mental
operations accounting for the group difference in performance could be carried out. The results are shown in Table (IV.4) below.
NS NNS
Schema Related Ability Related Other
8.57 2.42 2.5
7.42 2.28 2.5
t(df 168) 3.23
1.11
00P
Table
<.001
(Iv-4): showing the
NS
t. test results for the
NS
3 groupings: schema, ability and mixed.
Our results are in conformity with the hypothesis that NS
In conclusion, the results imply that the differences between
the two groups on the modified C.C.T.Test are based mainly
on the process that rely on schema.
The ability process of Deduction failed to show a significant
difference. The Inference test deserves special comment because
although it relates from its correlation with schema grouping
it contains a unique dimension. Nevertheless, there is no
difference between the groups on this dimension or combination
of dimensions involved in this process.
We can summarize the position at this point. There is
a reliable difference in performance between NS and NNS of English
when asked to externalize the natural places of pausing during
discourse processing.
This difference is seen in the number of P.Usand in the
location of these units identified by the 2 groups.
In an attempt to isolate the mental operations responsible
for this difference a more detailed test of mental operations
used during discourse processing was constructed. The research
data suggest that the NS differ from the NNS on thoa processes
which are associated to schema activities and not to non
schema or other activities. There is a strong probability
therefore that the difference in P.0 performance is related
to the schema functions only and this would advance our
understanding of the nature of mental processing variations
between the two groups.
To explore this possibility statistically, correlations
coefficients were calculated between total P.Usscores and
Infer. Assump. Interpre. Evalu. Deduc. Total P.Us
.92 .98 .86 .86 .64
(NS + NNS)
P <.01 <.01 <.02 <.02 NS
Table (IV-5) Processes, P.Us correlations.
Correlations were calculated using Total scores for each mental operation with number of P.0 allocations for the particular test. There were five replications. N = 5
The correlations were significant for the three processes classified as schema related. The coefficients were .98, .86
and .86 for Assumption, Interpretation and Evaluation respectively. There was no correlations (i.e. insignificant coefficients)
between P.Us and the ability related process of Deduction. The inference process which was classified as a mixture of some unique operations and some schema related activity was also significantly correlated with P.U. allocations (r = .92). These results were checked on Spearman rank order correlational techniques which, supported the Pearson's finding.
62
CHAPTER V
Overview 63
Hypotheses derived from contemporary studies comparing cognitive approaches and processes of expert learners and novices were used as a
framework to compare 1st and 2nd language learners of English in their processing for written texts. Of four generally accepted hypotheses; three
CHAPTER V
Explanation in terms of Expert/Novice Paradigm
Having examined the types of mental operations involved in the way learners process written information, for meaning, as a possible explanation of the difference between the NS/NNS performance, an analysis was made of the influence of the sheer amount of experience that each group had had with the language.
In contemporary schema theory these differences amount to that observed through the Expert/Novice paradigm (Chi, Glaser and Rees, 1982; Glaser, 1984; Frederickssen, 1984;
Carey, 1986). It appears that the analogy between Expert/Novice and NS/NNS is sufficiently sound to seek guidance from this model.
The findings when Experts are compared with Novices is the performance of learning, comprehension, memory and problem solving tasks, tend to be generally consistent.
These are, i) that Experts rely more on their memory than on their native intelligence.
ii) Experts show superior pattern recognition ability with superior recall for details. iii) Experts perceive different and more
meaningful chunks of task compenents than Novices.
65
(iv) Novices show inability to infer as much
knowledge from the stimulus configuration as the Experts who generate these inferences from their knowledge structures. The reasoning behind this is that the knowledge of Experts is organized differently from that of the Novices. The expert knowledge comprises tightly connected and
interrelated schemata which indicate to the learner, the likelihood of any particular set of meanings.
This theoretical formulation has been applied to
learning, thinking and problem solving in general, and more recently to medical diagnosis (Feltovitch 1981; Boreham, 1985). It is
somewhat surprising that it has not yet been applied as a means of guiding research into differences in performance between native and non native speakers of the same language.
Following this frameof reference one would expect that NS would show all of the characteristics mentioned as belonging to the Experts: They would perform better than NNS of equal intelligence.
1. They would therefore perform better on any task that relies heavily on schema organization, but not on tasks relying simply on straight intelligence.
2. When presented with an English text, they would show superior pattern or gist recognition ability.