On-line Fault Detection In Fermentation
Development Facilities
Ph.D. Thesis
Francis William Roche
Department Of Electronic And Electrical Engineering
University College London
ProQuest Number: U641928
All rights reserved
INFORMATION TO ALL USERS
The quality of this reproduction is dependent upon the quality of the copy submitted.
In the unlikely event that the author did not send a complete manuscript and there are missing pages, these will be noted. Also, if material had to be removed,
a note will indicate the deletion.
uest.
ProQuest U641928
Published by ProQuest LLC(2015). Copyright of the Dissertation is held by the Author.
All rights reserved.
This work is protected against unauthorized copying under Title 17, United States Code. Microform Edition © ProQuest LLC.
ProQuest LLC
789 East Eisenhower Parkway P.O. Box 1346
Acknowledgements
I would like to acknowledge and express my gratitude for the help, support, and
expert guidance provided throughought this project by Mrs Nina Thornhill (UCL
Dept, of Electronic and Electrical Engineering) and Dr. Steve Carleysmith (SmithKline
Beecham pic).
Without their help and encouragement and that of Dr. Judi Sutherland (Ex SB), the
Abstract
This thesis reports the results of an investigation into the means which can be used to
automate the supervision of a fermenter typical of the type used in antibiotic
fermentation process development. The work uses detailed data sets obtained from experimental fermentations as a basis to evaluate possible on line supervision techniques.
The basis of this work is the use of multiple data sources to determine whether a fermentation is proceeding as planned. These data can be tested for internal
consistency, and compared with data from previous fermentations to generate an automatic method of detecting faults. The use of an on line Kalman Filter as an
observer to supply information to generate analytical redundancies was investigated.
As part of this work, an analysis is presented of the accuracy and precision of information available from a typical fed batch fermentation.
Table O f Contents
Project Objectives 8
Project Outline 9
Chronology 12
The Penicillin Fermentation Process 13
1.1 Description Of A Fermenter System 13
1.2 Penicillin Fermentation Process 16
1.2.1 Strain Management 16
1.2.2 Inoculum Production 17
1.2.5 Fermentation 17
1.2.4 Relationship Between Fermentation Parameters 19
1.3 Information Available Around A Typical Penicillin
Fermentation 21
1.3.1 Off-line Data 21
1.3.2 On-line Data 21
1.4 Fermentation Failure Mechanisms 22
1.4.1 Biological Failure 22
1.4.1.1 Contamination 23
1.4.2 Hardware Failure 24
1.4.2.1 Consequences O f Possible Hardware Failure 25
1.5 Summary 30
Introduction To Fault Analysis Methodologies 31
2.1 Use Of Process Models 32
2.2 Use O f Non Measurable Process Characteristics 35
2.2.1 Heuristic Approaches 35
2.3 Statistical Process Control Techniques 37
2.4 Conclusions 42
Mathematical Description O f A Penicillin Fermentation 43
2.1 Modelling 43
3.2 The Process Model 37
3.2.1 The Relationship Between Carbon Dioxide Evolution
Biomass and Penicillin Production 40
3.3 Observer System For On-line Estimation O f Fermenter States 50
3.3.1 On-line Estimation O f Biomass Concentration By Mass
Conservation And Chemical Reaction Stoichiometry 50
3.3.2 Mass Balances 53
3.4 Neural Networks 68
3.5 Conclusions 69
Materials And Methods 71
4.1 Materials 71
4. L 1 Micro Organism 71
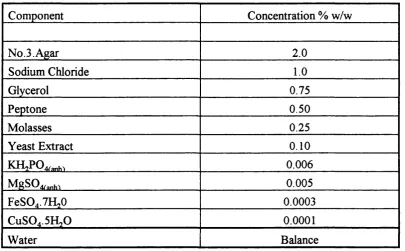
4.2 Media 71
4.3 Equipment 73
4.3.1 Fermentation Equipment 73
4.3.1.1 Fermenter Instrumentation And Control System 74
4.3.2 On Line Mass Spectrometer 74
4.3.3 Off-line Determination o f Penicillin And Phenyl Acetic
Acid Concentration 75
4.3.4 Fermentation nutrient System 75
4.4 Fermentation Procedure 75
4.4.1 Spore Preparation 76
4.4.2 Slope Preparation 77
4.4.3 Slope Inoculation 77
4.4.4 Slope Growth And Storage 77
4.4.5 Seed Culture Preparation 78
4.4.6 Medium Preparation 78
4.4.7 Seed Growth 79
4.4.8 Fermenter Medium Preparation 79
4.4.9 Fermenter Inoculation 8 1
4.4.10 Feed Preparation 81
4.5 Fermenter Monitoring 82
4.5.1 Fermenter Broth Sampling 82
4.5.2 Biomass Determination 82
4.5.2.1 Dry Weight Concentration Measurement Uncertainty 83
4.5.3 Glucose Concentration Determination 8 7
4.5.4 Glucose Concentration Measurement Uncertainty 8 7
4.5.5 Penicillin And Phenyl Acetic Acid Concentration
Measurement 88
4.5.6 Measurement O f Fermentation Broth Volume 88
4.5.7 Measurement O f Carbon Dioxide Evolution Rate 88
4.5.8 Uncertainty In Carbon Dioxide Evolution Rate Measurement 90
4.5.8.1 Uncertainty O f The Broth Volume Measurement 90
4.5.8.2 Uncertainty o f Air Flowrate Measurement 91
4.5.8.3 Uncertainty O f The Gas Analyser 91
4.5.8.4 Uncertainty O f The Carbon Dioxide Evolution
Rate Data 94
Fermentation Data 96
5.1 Starting Conditions 97
5.2 Process Conditions 100
5.3 Carbon Feed 100
5.4 Phenyl Acetic Acid Feed 102
5.5 Fermentation Data 103
5.5.1 Dry Weight Data 105
5.5.2 Glucose Data 111
5.5.3 Carbon Dioxide Data 113
5.5.4 Volume Data 109
5.5.5 Penicillin Production 121
5.6 Conclusions 125
Data Analysis 126
6.1 Data Obtained By Direct Measurement 128
6.2 Rate Data 130
6.2.1 Specific Growth Rate 131
6.2.2 Penicillin Production Rate 135
6.3 Normalised Data 137
6.3.1 Yield O f Biomass on Glucose 13 7
6.3.2 Penicillin Production / Glucose Feed 139
6.3.3 Penicillin Produced / Phenyl Acetic Acid Utilised 140
6.3.4 Ratio O f Penicillin / biomass 143
6.3.5 CEJi / Glucose Addition Rate 144
6.3.6 Yield O f Biomass On Carbon dioxide 146
6.4 Overall Mass Balance 146
6.5 Conclusions 149
Mathematical modelling Applied To On-line Mass Balancing 150
7.1 Comparison Between Mass Balance Obtained Using
Measurements And Balance Obtained Using The Bajpai And
Reuss Model 151
7.2 Usefulness O f Biomass Prediction From The Bajpai and
Reuss Model 152
7.3 Usefulness O f Penicillin Prediction From The Bajpai and
Reuss Model 158
7.4 Application O f An On-line Observer 160
8 Fault Detection By Analytical Redundancy 166
8.1 Contamination 166
8. L I Case Studies O f contaminated Fermentations 168
8.2 Hardware Failures 172
8.2.1 Loss O f Temperature Control 172
8.2.2 Failure In pH Control 178
8.2.3 Effect O f A eration System Faults 179
8.2.4 Glucose Feed Faults 195
8.3 Conclusions 208
8.3.1 Summary o f Fault Detection Methodologies 209
8.3.2 Summary o f Useful Data and Interactions 210
9 Conclusions And Recommendations For Implementation O f
An On-line System 212
9.1 Available Information 213
9.2 the Use of On-line Estimators to Enhance On-line Measurements 214 9.3 The Impact Of Fermentation Faults On Process Data 215 9.4 Summary O f Fault Detection Methodologies 218 9.5 Recommendation For An On-line Fault Detection system 223
9.5.1 Summary 227
9.6 Next Steps 228
9.6.1 Utilisation O f Additional data For Statistical Process
Control 229
9.6.2 Neural Networks/M ultivariate Statistical Analysis 230
9.6.3 Fault Identification Via Expert Systems 231
9.6.4 Implementation O f A Fault Detection And Identification
System 234
9.6.5 Application To Production Scale Fermenters 234
Project Objectives
A large antibiotic fermentation development facility, in industry, typically can contain fifty to one hundred fermenters. These are employed on a range of activities from seed culture preparation to process and strain development. These fermenters pose a considerable monitoring and control problem, requiring skilled personnel to monitor the correct running of the vessels. The aim of this project is to investigate the means
for automating the monitoring, and to improve the utilisation of information obtained in the course of routine sampling, of the fermentations.
The monitoring of large suites of fermenters has become an increasingly automated process, as control and instrumentation technology becomes cheaper and more reliable. Manual supervision is labour intensive, expensive and error prone.
Typically, on-line information from sensors and frequently, data from off gas analysis using a mass spectrometer are monitored by control computers. This results in the availability of large amounts of information which can be used to perform more sophisticated supervision tasks. This work investigates the best means of using these data for the detection of process faults on-line.
The basis for these methods is that the data obtained by monitoring a fermentation can be combined with information derived from constraints on the system, and data from past fermentations, to produce redundant information. These sets of information can be checked statistically for inconsistencies, and against range and rate of change
limits. If undue deviations are discovered, the presence of a fault can be inferred. Identification of the fault may then be attempted by comparing its characteristics with that of an on-line knowledge base containing descriptions of the likely consequences of faults.
The project was supported by SmithKline Beecham, and carried out in part in their fermentation research facility as well as in the UCL pilot plant. The project is
therefore oriented to the practical needs of SmithKline Beecham, and utilises standard statistical process control ideas as well as investigating the applicability of state of the art methods. A key part of this Ph D program was to look at the possibility of integrating conventional statistical process control ideas with more sophisticated fault
Project Outline
This section provides an overview of the important steps within the project and
describes the key methods chosen to meet the objectives. It also summarises the outcomes of the work.
There are a number of steps in the development of a fault detection and identification system. Methods of obtaining information both available in real time, and with relatively short delays, must be devised. These different information sets must be integrated into a set of expected performance indices about the fermentation. Finally a method of identifying discrepancies between the observed information sets, and between these and the expected fermenter performance must be found.
The first step was to determine the type and accuracy of information that can be obtained out of a typical research fermenter. This required the running of 21 fed batch penicillin fermentations, and the detailed analysis of the data obtained fi"om these batches. Monitoring and analysis techniques typical of those used at the project sponsor (Smithkline Beecham pic) were used throughout. This is because the
intention of this project was to devise methods for improving the performance of an installed equipment base rather than to recommend hardware improvements.
The fermentation of penicillin was chosen as the working system principally because it was one of two fermentation systems of interest to the project sponsors, the other fermentation of potential interest to the sponsor being the production of clavulanic acid, which is another p-lactam fermentation. The reason for preferring penicillin was
that there are available reasonable models in the literature for penicillin, which is an advantage since this project needs to make use of such models. In addition there was a group working on Pénicillium chrysogenum fermentations in the Department of Chemical and Biochemical Engineering at UCL and this was of great assistance, both
in setting up a practical system, and through collaborative fermentations, obtaining relatively high fi-equency samples.
As well as generating experimental data, a review was made of possible fault
detection techniques. The most usefijl available techniques turned out to be variations
control limits could be raw process data, conditioned process data, or the output from more complex mathematical techniques such as Kalman Filters, neural networks, or
multivariate regressions. The confidence limits themselves could be derived statistically from data from past fermentations.
In order to use on-line observers, it is necessary to have a model of the process of interest. An advantage of the penicillin fermentation process is that it has been the subject of extensive modelling effort; this project took advantage of that work. The model chosen was the one derived by Bajpai and Reuss (1980). This model has
already been used as the basis of a Kalman filter (Montague et al. (1986a,b)). A predictor corrector form of the Kalman filter was implemented using this model along
the lines of the one described by Lichfield (1979).
To be able to utilise a Kalman filter some work is required to determine the degree of
confidence in the measurements used to generate feedback, such as carbon dioxide evolution rate, and also the quality of the model. Work was carried out to determine accurately parameters such as the variance of biomass measurements for a specific fermenter.
A series of 21 penicillin fermentations was carried out to provide a basic set of data of known or estimatable accuracy, on which the observer system could be tested. The important feature of these fermentations was that faults could be deliberately
introduced. Some of these fermentations had step changes in conditions introduced, which provided data on how a real system would react after the occurrence of a faults. Some fermentations also developed unplanned faults, which generated useful additional data. The data obtained from these fermentations are presented in this thesis.
The analysis of data available from the fermentations carried out as part of this project shows that the most practical means of automating fault detection is by combining information from a range of sources. The single most useful source of data is previously conducted fermentations, which provide a benchmark against which a
difference between carbon accumulation as assessed from tracking inputs and outputs can yield data on whether the fermentation inputs are as planned.
A key conclusion is that quicker and more accurate fault detection could be obtained by using ratios of fermentation data to eliminate some of the batch to batch variation
which can be expected in development fermentations. This method in effect enhances the available data by applying a priori knowledge about how fermentations work.
The ultimate purpose of this project is to define an algorithm to implement a fault detection scheme, backed with data to show that the individual components of such an algorithm will function. The algorithm, at its lowest level, will consist of a set of expected performance trajectories which are established by historical data. The next level will be on-line monitoring of a fermentation process, enhanced by use of an observer and offline data. This monitoring will test for faults based on
Chronology
The work reported in this thesis took place between January 1988 and December
1990. At the time of the work, significant new inputs to the field of automatic fermentation supervision were developed.
Because this thesis has been delayed due to pressures of other work, there is a danger of presenting material which is no longer considered novel, or which has been
overtaken by other means of meeting the projects objectives.
This thesis has been brought up to date by reference to key publications. Where publications after 1991 indicate an alternative method, this work is placed within the new context.
Chapter 1;
Introduction To The Penicillin
Fermentation Process
There are a number of levels of information available around a fermenter. This thesis describes this information and shows how it can be combined to establish an
automatic fault detection and identification scheme. This chapter reviews the following aspects of the penicillin process:
• The fermenter hardware system • The penicillin fermentation process. • On and offline measurements.
• The type and impact of process faults.
1.1 Description O f Fermenter Systems
Stirred tank fermenters, which are by far the most commonly used for industrial fermentations, have typically the configuration described in fig 1. overleaf
Information is available from these vessels from physical sensors such as temperature, pH, and dissolved oxygen probes which are mounted in the vessel itself. The
composition of the exit gas stream fi-om an aerobic fermentation can be determined,
this is often done using a mass spectrometer or paramagnetic gas analysers. Samples of the contents of a fermentation can be withdrawn and analysed for biomass
concentration and key substrate and product species. Typically these off-line data are available infrequently and after a time delay depending on the organisation of the
assay used.
In large vessels, several probes of each type may be fitted, but this is far from a universal practice. This is because it can be considered that the risk of contamination posed by the extra fittings is a greater threat to the fermentation than the risk due to probe failures, particularly when on-line sterilisable ports are fitted, so that suspect instrumentation can be changed.
In small research fermenters (Typically 1.5 1 to 200 1 working volume), size limits the number of available probes, and in any case cost would probably preclude multiple probes. In addition, on this scale of fermenter, probes are likely to be of lower quality, and used for much longer than in production fermenters for cost reasons. In addition to the instrumentation in the fermenter, in most cases facilities exist for analysing the exit gas stream. This is usually by means of a mass spectrometer, or a combination of infra-red analysers for carbon dioxide, and paramagnetic analysers for oxygen. The analysis of effluent gas composition is of great importance, as, together with gas flow rate data, it gives an indication of the rate of respiration, and hence the level of metabolic activity in the culture.
Physical information about a fermentation, such as the rate of addition of substrates, is also usually readily available. In addition it is standard practice to sample the
fermentation at regular intervals, the frequency of which is a function of the fermentation time, and the reason for which it is being carried out. At SmithKline Beecham it was standard practice to sample a 200 hour penicillin fermentation every eight hours. These samples are analysed for the concentration of biomass and the key
components of the broth, such as substrate, and product composition.
The principal problem with this configuration, fi'om a control point of view, is that
several key process states remain unmeasured. In particular, it is not possible as yet to measure biomass, or the chemical composition of fermentation broths on-line. Off line samples in addition provide accurate information only after a considerable time
delay.
Work is ongoing to develop new techniques for on-line measurement of these
parameters. In particular, Aber Instruments have developed a biomass probe, but this
To Mass Spectrometer
Inoculum
Air out
PAA
Glucose
Airin— a g
Sterile Filter
HCI
NaOH
•or
Cooling Water Out
Cooling Water
Sample Point
Schematic Diagram Of
Fermenter Configuration Used In
This Work
ionisable salts. Given the design of the latest probes, there is some doubt whether they would function given the potential for fouling in a Pénicillium fermentation.
1.2 Penicillin Fermentation Process
The production process for penicillin G has three distinct phases;
• Strain management: maintenance of live Pénicillium chrysogenum spores.
• Inoculum production: conversion of spores into a population of mycelium which can be used to initiate a fermentation.
• Fermentation: use of the Pénicillium chrysogenum micelles to make penicillin.
The production of penicillin is thought to be a defence mechanism for organisms in the wild, helping them to compete for scarce resources. Penicillin is only produced by the Pénicillium fungi when there are insufficient nutrients present for unrestricted growth, hence the term secondary metabolite which is applied to penicillin. Therefore
the fermentation strategy is to grow a quantity of biomass rapidly, and then keep this biomass in a state which encourages the production of penicillin, by limiting the rate of carbon addition.
The desired fermentation profile is achieved by charging the fermentation with an initial shot of carbon containing material, e.g. glucose, then feeding additional glucose throughout the fermentation at a relatively low rate. Typically the levels of glucose present in a fermentation broth sample are negligible. Such fermentations are called
fed batch fermentations.
1.2.1 Strain Management
The production of penicillin G starts with spores of a specific (and usually highly optimised) strain oîPénicillium chrysogenum. These spores are typically sourced from a spore bank, usually comprising of frozen slopes inoculated with spores of the desired strain. Very long term storage can also be achieved by fi*eeze drying of spores. A sample of spores is inoculated onto the surface of a sterile agar slope of medium optimised for sporulation of the production strain. Typically such media, buffered to pH 5.5 to 6.5, would contain lactose, com steep liquor, peptone and inorganic salts. These slant cultures are allowed to germinate, grow and sporulate
standard volume of diluent (usually water plus a surfactant). The spore suspension thus generated is used to inoculate a seed fermentation.
1.2.2) Inoculum Production
The first step in the fermentation process is the inoculation of vegetative cultures. The vegetative cultures supply a sufficient concentration of fungal mycelium to the fermentation stage such that the generation of biomass in the full scale fermenter occurs over a reasonably short time period.
Inoculum development is typically conducted at 25°C in shake cultures and for large scale production in stirred vessels. A typical seed medium contains an organic nitrogen source such as com steep liquor, and fermentable carbohydrate such as glucose together with organic salts.
L2.3) Fermentation
The yield of penicillin per unit volume in a fermenter is the product of three
parameters, biomass concentration (X), the specific rate of penicillin synthesis (qpen) and the duration of the fermentation. The fermentation process is optimised to maximise the integral
[qpen(/).
X{ty]fit
1.1where
tj = inoculation time tj = harvest time
The first stage in the fermentation process is designed to achieve a high biomass concentration rapidly. Typically most of the biomass necessary to achieve high penicillin yields is grown within the first 30-40 hours of a fermentation. During this part of the fermentation, the organism is growing exponentially, with a biomass doubling time of about six hours. The fermentation at this stage is not producing significant amounts of penicillin. The end of the exponential growth phase is effected
penicillin yield, growth must continue at a certain minimum rate, at which new growth matches breakdown of mycelium, to achieve a high The concentration of cells achieved by the time the end of the exponential growth phase occurs is targeted to permit this extra growth.
The key to a high yielding penicillin fermentation is the successful shift of a culture from exponential to slow or steady state growth with a high qp^ value. The fermentation is then run for 120-200 h (SmithKline Beecham's standard time is 186
h); during this phase most of the penicillin is produced. The exact harvest time is defined by the need to trade off rate of penicillin production with rate of degradation of existing penicillin stocks, and the cost of keeping the fermentation going. Care is taken to control the rate of biomass production by optimising the rate of addition of the limiting nutrient (usually the carbon source). The upper limit to growth is provided by the need to maintain this phase for as long as possible without running into oxygen limitation problems, as the biomass density and hence broth viscosity rises during the fermentation.
At the time of the shift from exponential to steady state growth, phenylacetic acid is added to the fermentation. The majority of this is not metabolised, but supplies the side chain which characterises Penicillin G from other penicillins. This side chain is typically cleaved off by an enzyme-catalysed reaction to provide a base P Lactam ring
onto which alternative side chains can be added to produce the range of semi
synthetic penicillins. Once the level of oxygen in the broth drops below around 30% of saturated, penicillin production will decline. The precise lower limit for growth rate is strain dependent and is usually determined empirically.
Often the Pénicillium mycelia in penicillin G fermentations form pellets; this has the advantage of reducing viscosity, thus helping oxygen mass transfer. The downside of pelleting is that organisms in the centre of the pellet become starved of oxygen and
die.
At some time during the fermentation, usually because of oxygen limitation, the value of qpgo will decline to the point at which it is not economically worth running the fermentation fiirther. In addition the rate of degradation plays a part in determining the end point of the fermentation, as penicillin concentration increases the rate of degradation will increase, decreasing the net rate of penicillin production to
1.2.4) Relationship Between Fermentation Parameters:
It is useful at this point to examine how the disparate data sources from a penicillin fermentation can be connected, as this shows the availability of redundancies in the data set produced from a monitored fermentation.
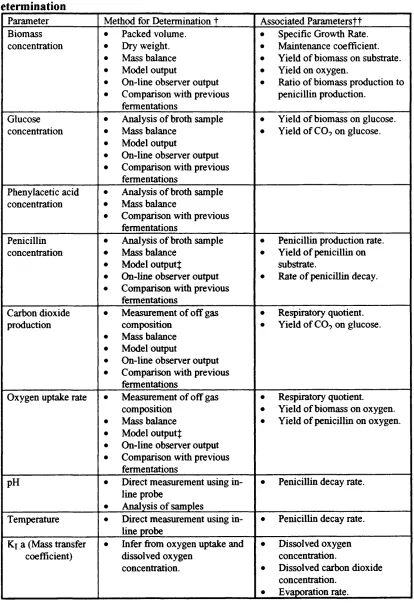
Table 1.1. Relationship between fermentation parameters, and method of determination
Parameter Method for Determination t Associated Parameterstt Biomass
concentration
• Packed volume. • Dry weight. • Mass balance • Model output
• On-line observer output • Comparison with previous
fermentations
• Specific Growth Rate. • Maintenance coefficient. • Yield o f biomass on substrate. • Yield on oxygen.
• Ratio o f biomass production to penicillin production.
Glucose concentration
• Analysis o f broth sample • Mass balance
• Model output
• On-line observer output • Comparison with previous
fermentations
• Yield of biomass on glucose. • Yield o f CO? on glucose.
Phenylacetic acid concentration
• Analysis o f broth sample • Mass balance
• Comparison with previous fermentations
Penicillin concentration
• Analysis o f broth sample • Mass balance
• Model output^
• On-line observer output • Comparison with previous
fermentations
• Penicillin production rate. • Yield o f penicillin on
substrate.
• Rate o f penicillin decay.
Carbon dioxide production
• Measurement o f off gas composition
• Mass balance • Model output
• On-line observer output • Comparison with previous
fermentations
• Respiratory quotient. • Yield o f CO? on glucose.
Oxygen uptake rate • Measurement o f o ff gas composition
• Mass balance • Model output^
• On-line observer output • Comparison with previous
fermentations
• Respiratory quotient. • Yield o f biomass on oxygen. • Yield o f penicillin on oxygen.
pH • Direct measurement using in line probe
• Analysis o f samples
• Penicillin decay rate.
Temperature • Direct measurement using in line probe
• Penicillin decay rate.
Ky a (Mass transfer coefficient)
• Infer from oxygen uptake and dissolved oxygen
concentration.
• Dissolved oxygen concentration.
• Dissolved carbon dioxide concentration.
• Evaporation rate.
t t Definitions of these parameters will be provided in chapter 2. Î Taking account of degradation.
1.3) Information Available Around A Typical Penicillin Fermentation
A key component of this project is to understand the type and quality of information
available about real fermentations. This section discusses the measurements which can be obtained. Data about the accuracy and precision of that information is presented in chapter 3.section 3.5.
L 3.1) Off-line Data
Broth samples can be taken; typically this might be carried out 2 - 4 times a day by a process operator. From these samples, in a typical penicillin fermentation, the following measurements could be obtained;
• Sediment Volume (after centrifugation). • Dry weight (solids content of sample).
• Substrate composition (e.g. glucose, phenyl acetic acid, sulphate, ammonium concentration etc.).
• Product (e.g. penicillin) concentration. • pH
• Viscosity
• Appearance of samples on microscopic inspection.
An issue with broth sampling is that on a small scale a significant fi-action of the total broth volume can be removed in the course of a 180 hour fermentation. This can
distort the analysis of the fermentation kinetics unless accounted for, as the feed and carbon dioxide evolution rates are measured on a whole fermenter basis, while the biomass and other broth components are measured on the basis of concentration.
1.3.2) On-line Data
On small research fermenters, on-line data collection is often limited by the number of
pH
Temperature Dissolved oxygen
Dissolved carbon dioxide. Aeration rate
Agitation rate
Volume (inferred from load cell data or measured directly) Exit gas composition
Feed rates
Heat input / output. Fermenter pressure.
For a detailed discussion of the instrumentation typically used in a typical fermenter suite see Carleysmith and Fox (1984) or Bailey and Ollis 1986. For an explanation of the means used to monitor exit gas see Heinzle (1991) who details the use of on-line mass spectrometry. In addition to the instrumentation described above, there is ongoing work to develop probes that can measure other fermenter parameters such as biomass (Cagney 1984) and secondary metabolite concentrations (Clarke 1985)
1.4 Fermentation Failure Mechanisms
Faults may be due to contamination of the fermentation media by competing
organisms, to failures in the equipment used, or to operator errors. This section seeks to describe the consequences of these faults. This section was compiled with the help of penicillin fermentation experts at UCL and SB in interviews during 1989 and 1990.
1.4.1 Biological Failure
Biological failure is taken here to mean contamination of the fermentation broth by an organism other than the one which it is intended to grow. Other examples of
biological 'failures' include the reversion to wild type in genetically engineered organisms, or the growth of fungi in the wrong morphology resulting in excessive
1.4.1.1 Contamination
The impact of a contaminant is dependent upon when it appears in the fermentation and the nature of the contaminating organism. A number of scenarios are possible.
Fast Growing Contaminant Present at the Start o f a Fermentation: The faster
growing organisms outgrow the Pénicillium fungus and become the dominant form in the fermentation. Upon depletion of the initial glucose supply, biomass production would be at approximately the same rate as for Pénicillium, as it is unlikely that the yield of biomass on glucose would be radically different. Some extra biomass would probably be produced, reflecting the lack of penicillin formation.
At some point, if the organism is incapable of metabolising phenylacetic acid (PAA) (added as a necessary precursor for penicillin G production) the PAA will reach toxic levels and kill the contaminant. This form of contamination is readily detected, after a period of time, by observation of a sample of medium under a microscope.
The exponential growth phase of the fermentation can be expected to be more rapid since the contaminating organism must grow more rapidly than the Pénicillium fungus to dominate the fermentation. A more rapid than usual build-up in carbon dioxide evolution, and a faster depletion of broth glucose can be expected. It is not
necessarily the case that a greater than usual depletion in the dissolved oxygen level can be expected, as the fast growing organism is not likely to produce as large an increase in viscosity as mycelial Pénicillium fungi. This reduction in viscosity can be expected to promote oxygen mass transfer and hence result in a higher than usual dissolved oxygen concentration.
Fast Growing Contamination After the Start o f a Fermentation: If a non penicillin
sensitive organism contaminates the fermentation after the initial glucose has been
used up, it cannot take over the fermentation, as the level of available sugar will not allow rapid growth. Such an organism however is likely to be a ^Lactamase
producer {^Lactamase is the enzyme in bacteria which confers penicillin resistance, it functions by cleaving the ^Lactam ring at the heart of a penicillin molecule),
can be seen if a very low level of slowly growing contaminant is present from the start of a fermentation.
The presence of this type of contaminant can be established by adding additional sugar to the fermentation permitting both organisms present to grow at a rate unlimited by carbon availability. The specific growth rate observed in this event will be higher than the maximum specific growth rate which occurs in uncontaminated fermentations. This can easily be tracked by measuring the rate of increase of carbon dioxide evolution.
Effect O f A Slow Growing Contamination: A contaminant with growth rates similar
to Pénicillium, which does not produce a ^lactam ase will not impact the fermentation, since it will be present in much lower concentrations that the
Pénicillium inoculation.
In any case, the presence of a contaminant, by competing for nutrients, is likely to lower penicillin titres.
1.4.2) Hardware Failures
Fermentation hardware periodically fails, or is set up incorrectly. The most sensitive components in most fermenters are dissolved oxygen and pH sensors. These rely on
sensitive membrane barriers to maintain the electrochemical effects they use to effect their measurements. Also both types of probe are subject to drift due to depletion of electrolyte species over time. In addition the process of autoclaving or steam
sterilising to ensure probe sterility can damage membranes. All the other mechanical and electronic equipment used to maintain and monitor a fermentation are of course
also subject to faults from time to time.
It is worth pointing out that in an industrial context, these failures are likely to be more common on small scale research and development fermenters. These are
thousands of pounds, there is a much greater incentive to minimise hardware failure by using high quality instrumentation, or hardware redundancy.
1.4.2 .1) Consequences of Possible Hardware Failures
This section discusses the impact of a fault in each of the systems used to maintain a fermentation.
Loss O f Temperature Control: As with any potential fault the effects are a function of the magnitude of the failure, and its nature. Temperature probes may fail by
becoming completely inoperable in which case a default, or garbage value will be returned to the control computer. This can easily be detected by limit flags on the supervisory system. An alternative fault can occur where output of a probe drifts from the point at which it was calibrated. This will not be readily apparent as the temperature control system will attempt to return the fermenter to its set point which would now be incorrect.
A failure in the actual control system, such as a loss of cooling water, would be easily detectable as the control system would not be able to compensate, and temperature would deviate from the set point. It is a matter of routine to install low and high temperature alarms in modem control systems.
A failure in the temperature control system that was not swiftly detected and rectified would not immediately destroy the fermentation. The temperature at which a
penicillin fermentation is run during the steady state part of its cycle trades off rate of penicillin production with rate of degradation. A rise in temperature would therefore alter the rate of penicillin accumulation. As the batch temperature approached 32- 35°C, the Pénicillium would die, ending the fermentation.
It is unlikely that a failure in temperature control which did not rapidly kill the
pénicillium organisms would impact noticeably on biomass, unless it occurred during
the exponential phase of the fermentation. This is because the level of biomass in the linear growth phase is principally determined by the carbon fed into the fermenter. In the exponential growth phase, the observed specific growth rate will vary depending on whether the batch cooled or overheated, as maximum specific growth rate is a
A shift in temperature can be expected to impact on the level of dissolved oxygen and carbon dioxide. The solubility of these gases is inversely proportional to temperature
(Perry 1985). The level of carbon dioxide present in solution is modified by its equilibrium relationship with carbonate ions. Oxygen concentration is likely to be a much more sensitive indicator of a temperature shift; the Henry's law constant for oxygen in water increases by 16% between 25°C and 35°C. Given that a temperature
rise is likely to promote metabolic activity and decrease oxygen solubility, a drop in dissolved oxygen levels can be expected to be seen.
Failure in pH Control: Pénicillium chrysogenum, when growing, produces lactic
acid, so pH control is typically effected by using an alkaline solution (ammonium hydroxide) which is added automatically to keep pH within specification. The pH used is chosen as with temperature to optimise penicillin yield. Unless very high or very low pH conditions (i.e. pH is <4 or > 10) are encountered, the Pénicillium will maintain growth. The main manifestation of pH changes within these bounds would therefore be a decrease in the rate of penicillin accumulation, either due to reduced
synthesis or increased degradation.
A rapid change in pH results in a transient change in carbon dioxide evolution rate. This is because the ratio of dissolved carbon dioxide to carbonate ions is dependent on pH; a change in pH which shifted this equilibrium alters the amount of carbon dioxide in solution, which in turn changes the quantity stripped out by the sparged airflow.
Effect O f An Agitation Fault: A reduction in agitation rate will reduce the disruption of the incoming air stream which is aerating the fermentation. This will result in poorer mass transfer of oxygen fi’om the incoming air and hence a lower dissolved oxygen concentration in the fermentation broth. As the Pénicillium becomes starved of oxygen, metabolic activity declines, then ceases. This occurs at a dissolved oxygen concentration of 30-40% of the concentration of broth fully saturated with oxygen. If
dissolved oxygen levels remain above this, no impact can be expected on the fermentation.
viable biomass content of the overall fermentation. A consequence of this reduction is likely to be a drop in carbon dioxide production, and also of penicillin production and PAA utilisation. This tendency to produce dead zones on inadequate aeration is likely to be come more marked as the fermentation progresses, and the broth becomes both more viscous and more shear thinning. A property of a shear thinning fluid is its relative inefficiency in transmitting torque from an agitator.
An increase in agitation only disrupts the fermentation if the shear applied by the
turbines became intense enough to disrupt the Penicillin mycelia. This is unlikely to be an issue on a small vessel where agitator tip speeds are low in comparison to production scale equipment.
Effect O f An Aeration Fault: As long as the rate of aeration remains above approximately 0.3 v/v/min there is unlikely to be any noticeable impact on the
fermentation from an aeration reduction. Below this the fungi will become starved of oxygen and eventually die. A reduction in air flow will be apparent because the exit gas oxygen and carbon dioxide concentrations will be radically different from their expected values, with carbon dioxide higher and oxygen lower than expected (i.e. the respiratory quotient of the system will be magnified).
Feed Rate Fault: During the exponential growth phase of the fermentation an
interruption in glucose feed results in an accelerated depletion of the batch carbon supply. After the end of the exponential growth phase of the fermentation an interruption in glucose supply will essentially halt metabolic activity as the level of metabolisable carbon in the fermenter during this part of the process is very low. A
feed outside the planned feed rate will result in either more or less metabolic activity than expected, and hence a higher or lower level of carbon dioxide evolution and
biomass production.
In the fermentation processes considered in this thesis, phenylacetic acid (PAA) was a secondary feed. This material was added as a precursor to penicillin G production. An overfeed of PAA would result in a build-up of PAA to toxic levels, an underfeed would result in a reduction in the rate of penicillin production and the production of
The consequences of the principal possible fermentation faults are summarised in table
1.2.
Table 1.2 Impact Of Faults On Fermenter Parameters
Impact of possible fermentation faults on the concentration in the fermentation broth of biomass, glucose, phenylacetic acid, penicillin and oxygen, and the concentration of carbon dioxide in the exit gas stream. This assumes that the magnitude of the faults are large enough to influence the outcome of the fermentations but not large enough to kill them.
(D = increase, ° = no change, ^ = decrease)
Fault Biomass Glucose [PAAl [Pen G] [0.] [CO,]
Fast growing contaminant; exponential phase
0 □ o 0 Û
Fast Growing contaminant : steady state phase
□ a 0 Û
Slow growing
contaminant
□ □ Û a a
Temperature Increase:
exponential phase.
a □ D
Temperature Decrease:
exponential phase.
Û a □ Û
Temperature
Increase: steady state phase.
□ o 0 □
Temperature Decrease: steady state phase.
Fault Biomass Glucose [PAAl [Pen G] [0,] [CO,]
pH decrease ; steady state phase.
a □ o □ □
Agitation decrease: exponential phase
0 a □
Agitation decrease:
steady state phase
o Û
Aeration increase: exponential phase
□ □ □ O Û 0
Aeration increase: steady state phase
o Û
Aeration decrease: exponential phase
0 Û a □ Û
Aeration decrease: steady state phase
a Û Û 0 Û
Overfeed of glucose:
exponential phase.
Û Û a a Û
Overfeed of glucose: steady state phase.
Û Û 0 Û
Underfeed of glucose.
exponential phase.
0 a □ Û
Underfeed of
glucose: steady state phase.
a Û 0 Û
Overfeed of PAA: Û Û a
1.5 Summary
This chapter has described the fermentation hardware used in this project, and typically used in fermentation development departments throughout the pharmaceutical industry. The basis of fed batch antibiotic fermentations were presented. It was shown that the fed batch process used is optimised to deliver the best combination of raw materials usage and process throughput by manipulating the quantity of biomass produced during an initial unlimited or exponential growth phase, and a much longer production phase.
Analyses were then presented which show;
• Key fermentation states.
• Links between these states and measurable parameters. • Information available around a typical fermentation • An outline of possible fermentation faults.
Chapter 2:
Introduction To Fault Analysis
Methodologies
There is a range of fault analysis methodologies, ranging from purely analytical means of detecting and diagnosing faults, to purely heuristic. Most methods employ a degree of statistical analysis of the output from analytical models . The nature of the problem is such that no one approach will be able to detect all possible faults
adequately, thus several techniques, employed complementarity, would provide the best supervisory system. The approach used in this project was therefore to identify the available data, and use this to identify feasible fault detection methodologies
It should be pointed out here that the detection of faults in instrumentation is widely described in the literature; the more complex problem of detecting faults in plant actuators and systems is much less well described. There is also some specialised literature aimed at fault detection due to biological problems (Stephanopoulos, 1984).
This section is intended to review available fault detection and identification methodologies. It must be said that only very simple applications to fermentation
systems have been made to date. The problem with fermentation systems is that they are noisy, non-linear systems, in which key process states are unmeasurable. This greatly complicates many of the methodologies suggested in this section.
The methods for detecting faults can be differentiated by their level of abstraction from the real system (Isermann 1984). Isermann makes the point that fault detection
can be based on measurable signals, non-measurable state variables, non-measurable process parameters, or non-measurable characteristics of the fermentation process. In
the most simple case, the signals from the fermenter can be analysed directly, checks beii% made for the absolute value of a variable, or its rate of change, these being checked against pre-set limits.
In addition it is of interest to look at the characteristics of the output from a sensor.
such as the dosing of acidity or foam regulators, or substrate input in a fed batch fermentation.
2.1 Use of Process Models
At the level of unmeasurable states the results of process models are used to check the consistency of instrumentation output. Wang and Stepanopoulos (1983) give a methodology for applying statistical hypothesis testing for error detection. This technique involves using mass balance equations to describe a fermentation. The output from these balances, taken together with the output from an observer, overdefines the fermentation. One compares the output from this model with the output from sensors, and tests the resulting residuals to check for bias in their values. If the test is passed, the residuals can be used to update the balance equation.
A methodology for the identification of errors on the detection of inconsistent results is also given by Wang and Stepanopoulos. This method works by deleting one measurement at a time and checking the consistency of the remaining measurements and their associated equations. This type of book-keeping redundancy is also
applicable to information which is initially produced by dynamic models, such as rates of material utilisation, and production.
Wang and Stepanopoulos's technique is interesting in that it incorporates all the elements of a basic fault detection and identification (FDI) system. It is relatively easy to implement and is based on directly established relationships. However, it does rely in part on off-line data such as biomass and product concentrations. Some of these may be estimatable but there is a limit to this before the system becomes
unobservable. The method also requires unbiased models which can track the fermentation parameters of interest.
A range of techniques is available for using dynamic equations describing a process
for fault analysis. The usual approach is to couch the set of state equations in some form of observer. In this project this was done through the use of a Kalman filter (Litchfield 1979, Montague et al. 1986) A detailed description of a Kalman filter as applied to a penicillin fermentation is given in chapter 3 section 3. Willsky (1976) suggests the use of failure sensitive filters, the basis of these being that the
as the computed error covariances and filter gain becomes small. This effect can be overcome by either weighting new data, or fixing the filter gain. The consequence of these alterations is that the filter is more sensitive to abrupt changes, at the cost however of degrading its performance with respect to process noise.
Faults are detected by comparing the state estimates produced by a sensitised filter, with the estimates produced by an optimal filter. This technique, while identifying that a fault has occurred, will not however give information on the nature of the fault. In addition, since the penicillin fermentation process is non-linear, an extended
Kalman filter is required, and it cannot thus be said to be optimal. This undermines the basis of Willsky's method as linearisation errors mean that both filters will be subject to some bias.
An alternative approach described by Willsky is the use of multiple hypothesis filter detectors. In this approach, a bank of filters based on various hypotheses concerning the behaviour of the system, given the occurrence of faults, is established, together with a filter which describes the fully operating system. The estimates from each filter are compared to obtain a probability that the models contained therein are correct. The need to run multiple filters across a large number of fermentation batches may impose unreasonable computation time constraints, and require a large modelling effort in complex systems such as penicillin fermentations. Also this technique is vulnerable to frequent process changes. Every time the process is changed, new models both describing correct operation and faulty operation will be necessary.
The use of multiple failure sensitive filters does solve the fault identification problem. This approach could be very valuable in an environment where accurate fault
diagnosis was important, for example, it could be used to selectively boost the reliability of sub components of the fermentation process such as the aeration system.
In this case a consistent pattern of events on the onset of a fault could be expected, such as a drop in dissolved oxygen, and evolved carbon dioxide. This would make
possible the establishment of some filter models which were insensitive to process changes. The lack of general applicability of this technique resulted in its not being
used in this project.
estimated output from modelling, and previous data. A property of a sequence of innovations is that its elements are independent, hence a whiteness test can be used for fault detection (Mehra 1970, Mehra and Peschon 1971). This test is based on an autocorrelation function for a stationary process, alternatively a sample correlation
coefficient can be used as a whiteness test. A second test that may be employed is to compute the mean of the innovation sequence, which should be zero if there is no erroneous bias present. The third test that Mehra suggests is to test that the
covariance of the innovation sequence has a Chi-Square distribution. This technique could usefully be extended by a comparison of unobserved states with either off-line data, or modelled states. An issue with the use of whiteness tests in the context of this work is that the process under consideration is non linear, the equations used to describe it have to be linearised to make the Kalman filter work, this means that the residuals will inevitably be biased.
Another approach to the use of innovations, suggested by Willsky, is the generalised likehhood ratio approach, which is based on the modelled effects of a fault on the innovations obtained. From these models, fault signatures are obtained, and these are used to compute the likelihood of a failure having occurred. This technique requires an ability to model the unsteady state behaviour of the system, and also suffers the problem of the requirement of a growing bank of signatures, with increasing system complexity.
Turning the problem around, Chow and Willsky (1984) suggest the use of parity vectors, which are formed by comparison of system inputs and outputs. In the absence of failures, in a noisy system, the parity vector is a zero mean random vector, which can be formulated independent of system states. Upon a failure the parity vector becomes biased, and moreover the bias is a function of the specific failure.
Thus the parity vector may be used as the signature canying residual for a fault detection system. The property of being independent of state estimation makes this an attractive approach where available models are poor. This method is theoretically
2.2 Use O f Non Measurable Process Characteristics
Parameters, such as maximum specific growth rate, are in effect the constraints on a process, and can be very sensitive to failures, if it is possible to identify them.
Parameter identification on-line is surveyed by Young (1981) and Billings (1980). The general conclusion is that, if a reasonable model is available it is possible to identify parameters on-line. Ono et al (1987) suggests that fault identification could be carried out by the comparison of the identified model prior to failure, either on line, or based on historical data, and the model identified post failure. Fault signature
libraries would be required in this approach, as well as a trigger means of detecting faults. Molle et al (1987) suggest the use of confidence limits for fault detection, based on the variance of the parameter in question. As will be shown these ideas provide a workable means of fault detection based on real fermentation data.
Representative process characteristics, collected on-line, such as efficiency of
substrate/product conversion, may also be used for fault analysis. In this case a static relationship, based on predecided limits, could be used, to detect faults in the same way that limit and trend checking are applied to measured system variables.
2.2.1) Heuristic Approaches
Both Hudson (1988) and Dohnal (1985) have shown that fermenters can be usefully described by heuristic models. A number of workers have applied these techniques to fault detection. These techniques can also be used to generate fault signatures instead of analytically computed results. This project did not implement an expert system, but the outcomes certainly lend themselves to that approach and form a recommendation
of the work. An expert system would be useful in that it would generate a general
approach to fault identification, with less computational and analytical effort than using numerical fault signatures. In particular, it could provide for simpler pattern recognition than statistical hypothesis testing techniques.
The development of an expert system to deal with process faults is described by Kramer (1987). He uses the material and energy balance equations associated with a
process to establish a set of governing equations which limit a process. Having
accumulation. If this is not the case then a fault can be diagnosed. The advantage of Kramer's approach is this combination of analytical and inferential techniques.
Kramer goes on to suggest that the problem of uncertainties caused by sudden jumps in the diagnostic conclusions reached, inherent in Boolean inference techniques, can be dealt with using either Bayesian inference or fuzzy logic. Bayesian inference is a
statistical response to the problem of reasoning with uncertainty, however since it requires data on the probability of the occurrence of faults, its implementation in process fault detection is problematic.
Fuzzy logic uses the concept of membership grade to set variable degrees of inclusion of constraints into the rule base. The mathematical theory of evidence approach is suggested, this modifies the fuzzy logic approach in that it uses the concept that the probability of a hypothesis being true is not necessarily one minus the probability of its negation. This is the logic form used by Kramer (1987). The problem with such techniques is to assign likelihoods to the hypotheses or propositions of interest. Kramer suggests the use of the variances of the innovations of the constraint equations.
The great advantages of this approach are that it allows for the interpretation of analytical, and statistical data, and for the incorporation of non mathematically defined propositions. Also it gives an approach that will allow the ranking of a series of possible faults in their relative likelihoods. The need to acquire large amounts of data to supply statistically meaningful values to membership grades is the key weakness of this approach as applied to fermentations.
An approach to fault diagnosis using Signed Directed Graph method of representing process interactions is suggested by Kramer and Palowitch (1987). Fault simulation using the SDG involves the formation of a set of directed 'fault' trees branching from
2.3 Statistical Process Control Techniques
An important approach to fault detection first became well known in 1991, Those
methods known as Principal Component Analysis (PCA) and projection to latent structures (PLS), otherwise known as partial least squares regression, use multivariate statistical methods to establish a statistical regression model Future data are analysed using the model in such a way that they can be plotted onto a 2 D or 3 D chart, called a scores plot analogous to a statistical quality control (SQC) chart, Deviations from normal operations are detected through points appearing on the scores plot in an unusual position, and outside the cluster of plots indicating normal operations.
An early review of PLS is given by Geladi et al (1986). A summary of the
mathematical description in their work is presented below to illustrate the concepts
behind the PLS and PCA techniques;
A starting point is to mean centre (subtract the mean value of a variable fi'om each datum) and variance scale (divide each datum of a given variable by the standard deviation of the full data set).
First order multiple linear regression is a technique for establishing the linear relationship between variable y and m variables x in the form:
j ' = V i+*2*2+...+ e 2.1
Where
y = Dependent Variable X = Independent Variables,
b = Dependencies e = Error or residual.
Putting this into matrix form
where b is a column vector and x is a row vector.
This describes the situation in which there is only one sample; if multiple samples are
available the following matrix system arises:
•^1,1
= # +
_^n,l
^n,m
_ A .2 .3
Typically m < n. In this case there is no exact solution for the equation system, so instead algorithms aim at minimising the error vector e usually using the least squares method summarised in the following well known equation:
b = ( x x ) ^xy 2.4
The problem with multiple least squares(MLS) is its dependence on the existence of the XX matrix.
It should be noted that MLS works as well for multiple dependent variables as for one. The matrix system simply becomes:
y u y^p ^1,1 \ m K p «1.1
= • +
A , y n , p _ _ ^ n ,\ ^ n ,m _ ^ rt,p _ f n , \ ^ n ,p _
2.5
Principal Component analysis (PCA) is a method of writing a data matrix X of rank r as a bank of r matrices of rank 1
2.6
These M matrices can be written as the product of two outer matrices, known as a
score vector (t) and a loading vector (p) thus equation 2.6 becomes:
or
X = T P ' 2.8
The key to this technique is the definition of t and p. The principal component is the line of best fit between two variables given minimal residuals. The loading vector contains the direction cosines or the projections of a unit vector along the principal
component on the axis of a plot of the line of best fit. Essentially they define the slope of each fitted line. The scores vector is the co-ordinate (i.e. distance from origin) of each datum along that line.
What is required to identify T and P are operators that project the rows and columns of the X matrix onto a single dimension. The algorithm for achieving this is nonlinear iterative partial least squares (NIPALS). This can be summarised as follows:
1 ) take a vector x^ fi*om X and call it t^: tj^=x^
2) calculate p^': ph’ = t^'X/tj,\
3) Normalise ph' to length 1
4) Calculate = Xp/p/p^
5) Compare the result of step 5 with the result of step 1. If they differ, iterate between step 2 and 4.
Summarising, a data matrix X of rank r can be decomposed to a sum of r rank 1 matrices. The point of this is that the m.n data matrix can be reduced to an a n matrix
comprising the scores and loadings. This T matrix has reduced rank and also has advantageous properties (orthogonality).
The partial Least Squares (PLS) regression model can be obtained from the NIPALS algorithm. The X matrix becomes the data matrix. The PSL model essentially consists
X = 7 P ' + E
Similarly, dependent variables can be described
y =uq! +f
Expanded these become
2.9
2.10
^1,1 ^ l,m ^ ,1 h,m P'lA P \,P ^1,1 ^Ip
— • +
_T«,1 ^n,m _ Jn,\ ^o,m _ _P'o,l P'o,p_ _^n,\ ^n,p_
2.11
y i , \ Tl,m ^ \ , P /i.i /i,p
= • +
yM,1 y n,m _ 1,1 J n,p _
2.12
The basis of the algorithm is to minimise F, and at the same time develop a
relationship between X and Y. This relationship is developed in the same way as in PCA (equation 2.2). A simple linear model
2.13
relates u and hence Y and t. B in this context plays the role of the regression
coefficient matrix in both the MLR and PGR models. The key to the PCA approach is an algorithm which exchanges information to the principal components (U,T) to permit a minimisation of the regression error. The starting point is the following algorithm, which is an extension of the NIPALS algorithm to permit interchange of scores for the T and U matrices thus:
1) Take Ujtart = some yj
2) q’=u’X/u'u
4) t=Xp/p'p
5) q'=t'Y/t't
6) q'„ew=q'oi</lq'oidl
7) u=Yq/q'q
8) Compare t in step 4 with the previous iteration, if they are equal within acceptable rounding errors halt the procedure.
Summarising, PLS includes independent models of the X (independent variables) and Y (dependent Variables) matrices, known as the outer relationships. These modals are in the form of reduced order matrices (vs. original data) derived from data by means of least squares regression.
These models are themselves linked by a least squares regression derived model. This model is known as the inner relationship and has the form
2.14
Skagerberg et al (1991) provide an excellent description of the use of these
techniques in control of a continuous low density polyethylene making reactor. They show how the PLS technique can be applied to data which is ill conditioned, due to variables being highly correlated and time differentiated. They show that given sufficient data, the PLS technique is a useful tool for process monitoring, although it does produce some problems in interpretation with multiple significant dimensions and interpretation of time dependent data.
Kresta et al (1991,1992) show some further steady state applications of PLS. They
Nomikos and MacGreggor (1994) show how PCA can be used to advantage in batch process monitoring. Their approach shows how closely PCA and traditional
statistical process control techniques can be integrated. Nomikos's approach depends on the similarity of past batches to the batch under consideration. He also points out that fault events must be observable using the sensors applied to the process under consideration. His paper presents a form of control chart that is extensively used in this thesis.
2.4 Conclusions
This chapter has shown the main approaches available to an on line fault detection program:
• The use of statistical observers incorporating models of fault events.
• The use of heuristic or expert system techniques incorporating essentially non
mathematical fault models.
• The use of statistical process control techniques, including principal component analysis.
The main disadvantages of the use of on line observers or expert system models is that a description of each of a large number of relatively infrequent faults is required
to identify fault events.