United Kingdom Vol. III, Issue 12, December 2015
Licensed under Creative Common Page 632
http://ijecm.co.uk/
ISSN 2348 0386
STUDY OF INFLUENCE OF CUSTOMER LOYALTY ON
PROFITABILITY TAKING SERVICE BEHAVIOR
AS MODERATING VARIABLE
Xu Liu
Grade 2013, School of Management, Guangdong University of Technology, Guangzhou, China [email protected]
Abstract
The development of the global economy and the change of the market from the seller to the
buyer make customer’s loyalty are a valuable resource for competition among enterprises. Loyal
customers actively buy products or services to increase the income of the enterprise, it is more
possible for them to accept a premium, and their positive words bring profits to the enterprise.
But some scholars believe that the relationship between customer loyalty and profitability is
weak or not monotonous. At the same time, the research of customer loyalty in the past mainly
focused on the driving factors, definition and measurements of customer. In addition, for the
enterprises with the service quality, the frontline staff contact and interact customers closely in
the service, and their customer experienced their service quality through service, thus reflect the
affection on their own behavior. On the basis of references of past scholars, this paper will
explore the relationship between customer loyalty and profitability. At the same time, the
behavior of the enterprise employees will be introduced to explore the role of customer’s loyalty
in the relationship between the profitability of the company. According to the related theories,
customer loyalty is divided into two aspects: attitude loyalty and behavior loyalty. The
measurement dimension of customer profitability, cost reduction, cost reduction, customer
loyalty and profitability, will provide 4 research hypotheses, 311 research hypotheses, two
research hypotheses, and the relevant conclusions.
Licensed under Creative Common Page 633 INTRODUCTION
With the development of the global economy and the change of the market from the seller to the buyer's market, the competition between enterprises and enterprises is very important. In this competition, customer loyalty is widely considered as the valuable resource of the competitive market (Bai Changhong & Liu Zhi, 2002). Since 1940s, enterprises and academia have been exploring the management method of improving customer loyalty.
Domestic and foreign scholars on the relationship between customer loyalty and profitability has not been unified and with the conclusion that the explanation of the relationship between the customer loyalty and profitability has not been revealed. At the same time, the research on customer loyalty mainly focuses on the driving factors of customer loyalty and the measurement of customer loyalty, mostly as a result of customer loyalty as a result of research, and not on the perspective of customer loyalty and profitability, but also does not have the enterprise employees and customers in two layers of a combination of research.
In order to understand the formation mechanism of the relationship between customer loyalty and profitability, this paper is based on the perspective of behavior, and explores the influence of customer loyalty to customer follow-up, and then to analyze the profitability of customer loyalty. At the same time some factors that may hinder the realization of the customer's goal in the intention and the behavior. Employee service quality can affect customer behavior(Zhang Depeng & Chen Shaoxia, 2011). Therefore, the service behavior of the waiter may have a moderating effect on the customer loyalty to its subsequent behavior and profitability.
On the basis of drawing lessons from the past scholars, according to the relevant theory, the concept model of "customer loyalty and profitability" is constructed, and the role of the service behavior in customer loyalty to the relationship between them is discussed.
PROPOSED MODEL AND HYPOTHESES
Establishing a Conceptual Model
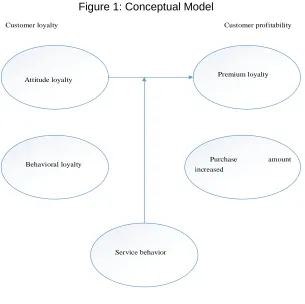
On the basis of theoretical research, we propose a conceptual model of the relationship between service staff to customer loyalty and profitability, as shown in figure 1. Among them, because the variable is the premium capacity, the purchase amount of two variables, the independent variable is the attitude loyalty, the behavior loyalty two variables; the service behavior as the adjustment variable.
Licensed under Creative Common Page 634 Figure 1: Conceptual Model
Behavioral loyalty
Premium loyalty
Purchase amount increased
Service behavior Attitude loyalty
Customer loyalty Customer profitability
Research Hypothesis
H31: waiter's behavior has a positive moderating effect on the customer and the profitability of the attitude.
H32: waiter's behavior has a positive moderating effect on the behavior of loyal customers and the profitability of the behavior.
RESEARCH METHODOLOGY
This study uses a questionnaire survey method to collect empirical data to verify the conceptual model and the research hypothesis. On the basis of literature review, this paper summarizes the existing measurement scales of customer loyalty, customer profitability, service behavior variables, and adjust and improve the existing measurement scale with the actual situation of our country. Thus, the questionnaire design of this study was completed. And then, in the school of the pretest, through the pre testing, and the combination of consulting, adjust and modify the original questionnaire, the final completion of the questionnaire design.
Licensed under Creative Common Page 635 research is divided into two parts. The first part is the investigation of the characteristics of respondents, including the gender, age, educational background, the second part is the core part of the questionnaire, including 6 questions measuring customer loyalty, the 13 problems of customer profitability, through employee reliability, safety and empathy behavior of the 11 aspects of employee behavior measurement.
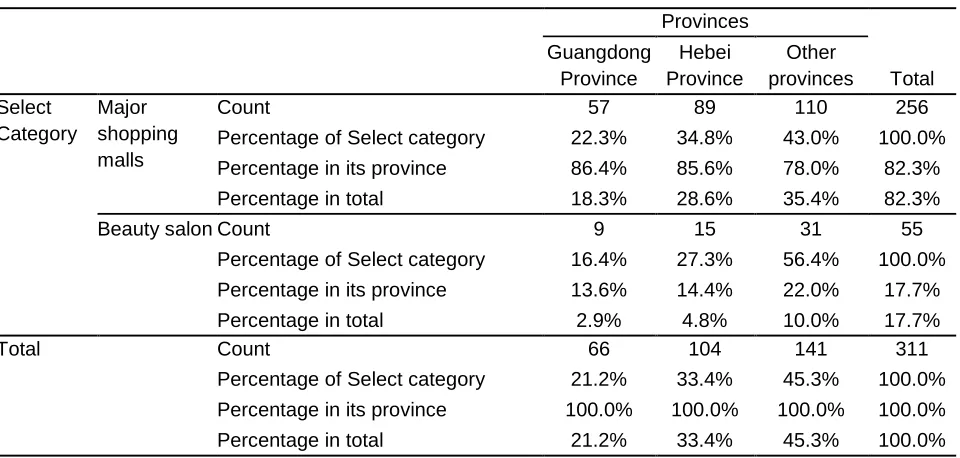
This research chooses each big market, the beauty salon as the investigation place, through the online questionnaire star, the Google form, accepting the survey customer according to the actual experience and experience which I go to the shopping mall, the questionnaire, the questionnaire to make the true choice. The whole large sample investigation stage for three weeks, 311 copies of the questionnaire, which get the data more of the two provinces (104), Guangdong province (66), the other 23 provinces to obtain data integration for other provinces, the customer choice survey of the type and the distribution of the provinces, such as table 1. The basic requirements for the statistical analysis of the questionnaire and the analysis of variance showed that there was no significant difference between the different sites and the sample data.
Table 1: The Distribution of Surveys Table Provinces
Total Guangdong
Province
Hebei Province
Other provinces Select
Category
Major shopping malls
Count 57 89 110 256
Percentage of Select category 22.3% 34.8% 43.0% 100.0% Percentage in its province 86.4% 85.6% 78.0% 82.3% Percentage in total 18.3% 28.6% 35.4% 82.3%
Beauty salon Count 9 15 31 55
Percentage of Select category 16.4% 27.3% 56.4% 100.0% Percentage in its province 13.6% 14.4% 22.0% 17.7% Percentage in total 2.9% 4.8% 10.0% 17.7%
Total Count 66 104 141 311
Percentage of Select category 21.2% 33.4% 45.3% 100.0% Percentage in its province 100.0% 100.0% 100.0% 100.0% Percentage in total 21.2% 33.4% 45.3% 100.0%
ANALYSIS AND RESULTS
Variable Descriptive Statistics
Licensed under Creative Common Page 636 Table 2: The Descriptive Statistics of Measured Variables
Measured Variable Means Median Standard deviation Min Maximum
Premium capacity
A1 3.43
3.29
4.00 1.057 1 5
A2 3.27 3.00 1.101 1 5
A3 3.17 3.00 1.164 1 5
Increase purchases
B1 3.50
3.53
3.00 .950 1 5
B2 3.53 4.00 .983 1 5
B3 3.56 4.00 .982 1 5
D3 3.95 4.00 .871 1 5
Attitudinal loyalty
E1 3.50
3.53
4.00 .940 1 5
E2 3.55 4.00 0.952 1 5
E3 3.54 4.00 0.999 1 5
Behavioral loyalty
F1 3.81
3.84
4.00 .904 1 5
F2 3.78 4.00 0.914 1 5
F3 3.93 4.00 0.907 1 5
Variable Reliability Test
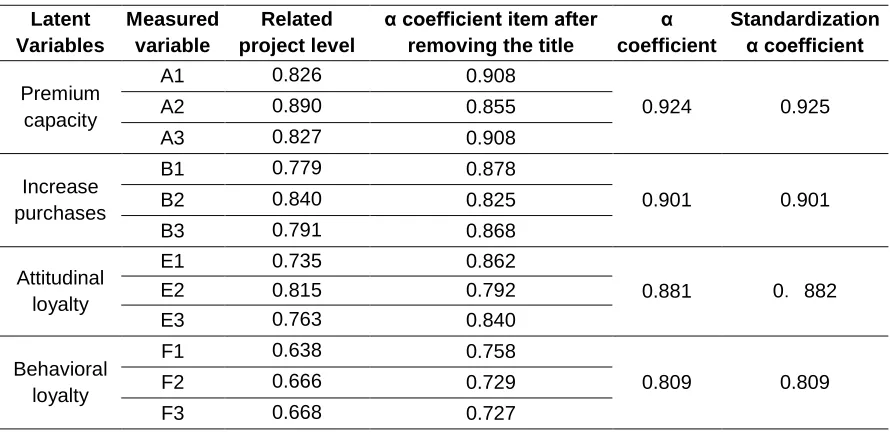
The reliability test is the stability of the results measured by the test or the measuring instrument (stability) and the consistency (consistency). In the study of the data using the method of questionnaire survey, the reliability (Li Huaizu, 2004) is usually used to test the reliability is Cronbach. The variable coefficient of the study is shown in table 3. From table 3, the Cronbach alpha of all the latent variables is more than 0.80, and the correlation coefficient of each measurement variable is greater than 0.60, which shows that these variables have good internal consistency, so the data obtained from this investigation are consistent with the reliability requirements.
Table 3: The Internal consistency test of measured variables
Latent Variables Measured variable Related project level
α coefficient item after removing the title
α coefficient Standardization α coefficient Premium capacity
A1 0.826 0.908
0.924 0.925
A2 0.890 0.855
A3 0.827 0.908
Increase purchases
B1 0.779 0.878
0.901 0.901
B2 0.840 0.825
B3 0.791 0.868
Attitudinal loyalty
E1 0.735 0.862
0.881 0.882
E2 0.815 0.792
E3 0.763 0.840
Behavioral loyalty
F1 0.638 0.758
0.809 0.809
F2 0.666 0.729
Licensed under Creative Common Page 637 Function Test of Adjusting Variables
Validity Test of Regulator
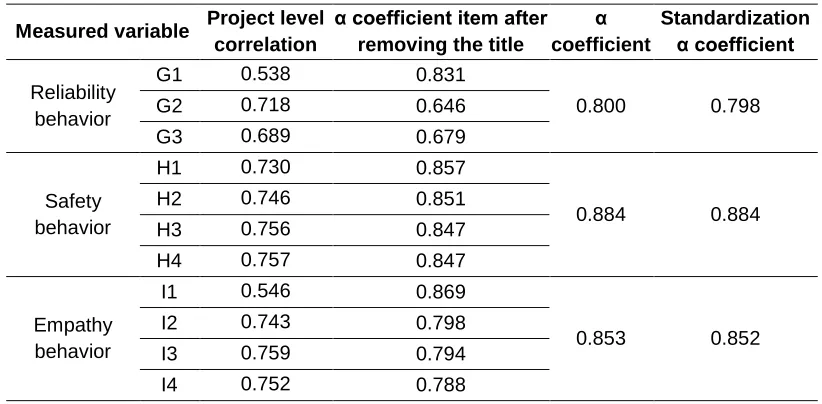
Using Cronbach alpha coefficient to test the validity of the adjustment variables, such as table 4 shows that alpha value of the three observation variables of waiter behavior meets the acceptance requirements of 0.50, and the project level correlation coefficient is greater than 0.50, which shows that this variable has good internal consistency.
Table 4: The Internal Consistency Test of Regulated Variables
Measured variable Project level
correlation
α coefficient item after removing the title
α coefficient
Standardization α coefficient
Reliability behavior
G1 0.538 0.831
0.800 0.798
G2 0.718 0.646
G3 0.689 0.679
Safety behavior
H1 0.730 0.857
0.884 0.884
H2 0.746 0.851
H3 0.756 0.847
H4 0.757 0.847
Empathy behavior
I1 0.546 0.869
0.853 0.852
I2 0.743 0.798
I3 0.759 0.794
I4 0.752 0.788
Descriptive Statistical Analysis of Regulatory Variables
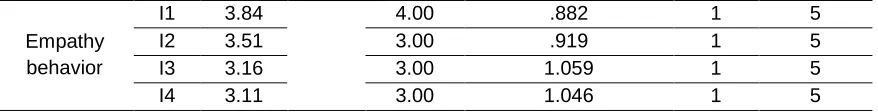
As shown in table 5, the reliability, safety behavior, and the behavior of the three aspects of the behavior of the employee are consistent, and the median is almost equal, which shows that the adjustment of the internal value of the variable is not significantly different. So we can use the mean method, through the simple average of the measurement variables, the three control variables are significant, and the mean value of the variable is not significantly different from that of the original variables.
Table 5: Descriptive Statistics of Regulated Variables
Measured variable Means Median Standard deviation Min Maximum
Reliability behavior
G1 3.96
3.69
4.00 .832 1 5
G2 3.72 4.00 .918 1 5
G3 3.63 4.00 .909 1 5
Safety behavior
H1 3.96 4.00 .826 1 5
H2 3.97 4.00 .876 1 5
H3 3.86 4.00 .871 1 5
Licensed under Creative Common Page 638 Empathy
behavior
I1 3.84 4.00 .882 1 5
I2 3.51 3.00 .919 1 5
I3 3.16 3.00 1.059 1 5
I4 3.11 3.00 1.046 1 5
Analysis of the Interaction between the Independent Variable and the Service Behavior of the Service
The study of the interaction of SPSS software package is used to test the adjustment mechanism of the variables. To this end, this paper uses SPSS to examine the interaction between the service behavior of the waiter and the customer loyalty and CLV.
From the above analysis, there is no significant difference in the average of the latent variables, so this study uses the mean value method to make the customer attitude loyalty, behavior loyalty, service behavior, premium capacity, increase the purchase amount, obtain the cost reduction, retention cost reduction and other latent variables, and obtain the correlation coefficient of each latent variable, as shown in table 6.
Table 6: The Correlation Test between Employee Behavior and Latent Variables
Latent variable Premium
capacity
Increase purchases
Attitudinal loyalty
Behavioral loyalty
Employee behavior
Premium capacity 1
Increase purchases 0.565 1
Attitudinal loyalty 0.059 0.078 1
Behavioral loyalty 0.124 0.139 0.030 1
Employee behavior 0.376 0.489 0.062 0.064 1
The results show that the service behavior of the waiter is weakly correlated with the customer attitude loyalty, behavior loyalty, and premium ability, the increase of the purchase amount, the cost reduction, and the retention cost reduction. Therefore, the adjustment function of the adjustment variables to customer loyalty and customer profitability is further tested.
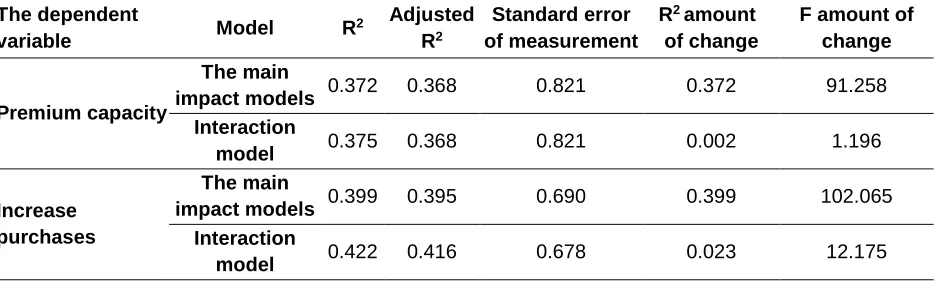
Analysis of the Interaction of Attitude Loyalty and Service Behavior to Customer Profitability
The adjustment variables into the regression model, the regression analysis of the interaction between two. In the process of the interaction between customer loyalty and employee behavior, the attitude of the related variables, employee behavior and customer profitability are introduced into the regression model, and the interaction variables are introduced in the end. By
Licensed under Creative Common Page 639 observing the changes of F, the value of and T, and the significant level of T, the interaction between the interaction and the positive and negative expression of the interaction is analyzed.
Table 7: The Regression Model Test on Attitude Loyalty and Employee Behavior Interacting on CLV
The dependent
variable Model R
2 Adjusted
R2
Standard error of measurement
R2 amount
of change
F amount of change
Premium capacity
The main
impact models 0.372 0.368 0.821 0.372 91.258
Interaction
model 0.375 0.368 0.821 0.002 1.196
Increase purchases
The main
impact models 0.399 0.395 0.690 0.399 102.065
Interaction
model 0.422 0.416 0.678 0.023 12.175
Table 8: The Regression Coefficients of Attitude Loyalty and Employee Behavior Interacting on CLV
Model
Premium capacity Increase purchases
The main impact models Interaction
model
The main impact
models Interaction model
β 0.244 0.337 0.412 -0.216
t 4.680** 1.094 7.933** -0.703
The regression analysis results showed that the F had no significant effect on the change of 3-8, which indicated that the effect of employee behavior on customer attitude loyalty to premium ability, the purchase amount, the cost reduction, and the cost of retention decreased. In addition, the results show that the H31 value of the 5-14 in the table, it is proved that the service behavior of the service has no effect on the relationship between customer loyalty and the premium, the purchase amount, the cost reduction, and the retention cost reduction.
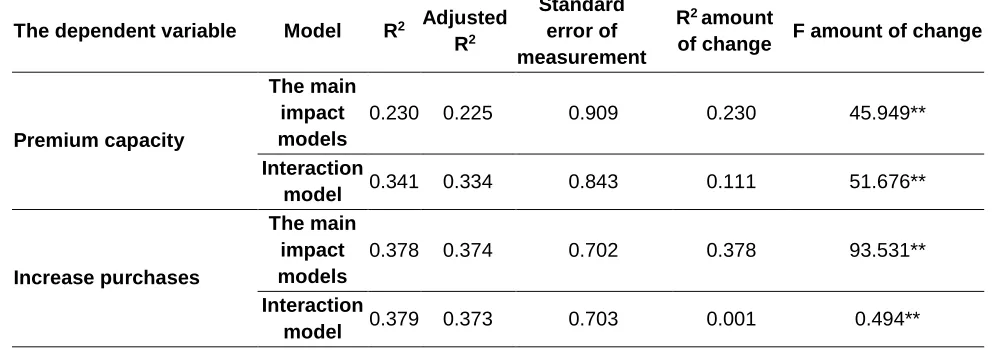
Analysis of the Interaction between Behavior Loyalty and Service Behavior to Customer Profitability
Licensed under Creative Common Page 640 Table 9: The Regression Model Test on Behavior Loyalty and Employee Behavior
Interacting on CLV
The dependent variable Model R2 Adjusted
R2
Standard error of measurement
R2 amount
of change F amount of change
Premium capacity
The main impact models
0.230 0.225 0.909 0.230 45.949**
Interaction
model 0.341 0.334 0.843 0.111 51.676**
Increase purchases
The main impact models
0.378 0.374 0.702 0.378 93.531**
Interaction
model 0.379 0.373 0.703 0.001 0.494**
The regression analysis results of 3-9 show that the change of F has a significant effect on the increase of the customer's behavior loyalty, the increase of the purchase amount, the cost reduction, and the reduction of the cost of retention. From this, the change of T value and T value were further investigated.
Table 10: The Regression Coefficients of Behavior Loyalty and Employee Behavior Interacting on CLV
Model
Premium capacity Increase purchases
The main impact models
Interaction model
The main impact
models
Interaction model
Β 0.402 0.688 0.364 0.313
T 6.706** 7.189** 6.869** 3.489**
From the T value of 3-10, the service behavior has a significant effect on the relationship between customer behavior loyalty and =0.688 (), =0.313 (t=7.189), =0.229 (t=3.489), t=2.618 (), and the relationship between the cost reduction (P), and the retention of =0.325 (t=3.762). Therefore, it is assumed that the H32 service has a positive moderating effect on the behavior of the customer and the profitability.
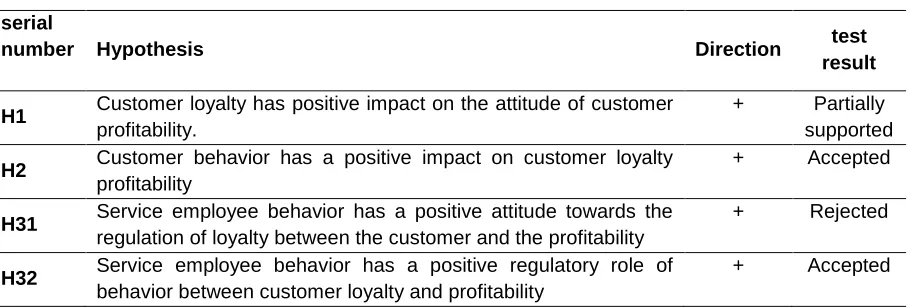
Hypothesis Testing
Licensed under Creative Common Page 641 Table 11: The Test Result of the Research
serial
number Hypothesis Direction test
result
H1 Customer loyalty has positive impact on the attitude of customer
profitability.
+ Partially supported
H2 Customer behavior has a positive impact on customer loyalty
profitability
+ Accepted
H31 Service employee behavior has a positive attitude towards the
regulation of loyalty between the customer and the profitability
+ Rejected
H32 Service employee behavior has a positive regulatory role of
behavior between customer loyalty and profitability
+ Accepted
CONCLUSION
With the globalization of economy and information, the difference between products or services is becoming smaller and smaller, and the market competition is becoming increasingly fierce. The pursuit of personalized service is becoming more and more obvious, and the competition of customer resources, especially the profitable customer loyalty is becoming increasingly fierce. In the service industry background, the fierce market competition not only displays in the customer's competition, but also displays for the employee's competition. Loyal customers can bring profit to the enterprise as the main idea of the current enterprise. In the process of service staff and customer's contact and interaction, the service behavior can affect the customer's perception of the service quality, and then the customer behavior and the profit.
From the perspective of CLV, this paper analyzes the formation of customer profitability, and analyzes the relationship between customer loyalty and profitability. Then, from the perspective of the combination of customer and enterprise two, to explore the relationship between the behavior of the employees of the enterprise and the relationship between the loyalty of customers and the profit, and to construct the research model of loyalty. Then through the data investigation, from the empirical point of view to verify customer loyalty - the concept of profitability model, in order to explore the relationship between employee behavior and the relationship between loyalty and profitability.
Licensed under Creative Common Page 642 REFERENCES
Bai Changhong, Liu Zhi service enterprise customer loyalty and its Decisive Factors [J] Nankai Business Review, 2002, 5 (6): 64-69.
Chen Shaoxia formation mechanism and reputation measurement model customer value optimization: based on the perspective of the social impact [J] Management Review, 2014.
Fan Li Hui, Luo Haicheng, Tang Yao attitude of corporate image on customer loyalty and behavioral loyalty of impact models - Evidence from retail banking [J] Management Review, 2012, 24 (006): 88-97.
Han, Wei Fuxiang interaction between customer satisfaction study [J] and customer loyalty Nankai Business Review, 2001, 4 (6): 8-10.
Li Huaizu Management research methodology [M]. Xi'an Jiaotong University Press, 2004.
MENT Dong supermarket DCRM tractor models with Reward Programs Construction and Empirical Analysis [J] Management Engineering, 2004, 18 (2): 85-89.
PLAN FOR Tang Gui, Zhang Mingli improve customer equity measurement model and its application [J] in the service sector of China Soft Science, 2010 (5): 161-168.
Song Chunhong, Sujing Qin Treasury quality, customer value and customer satisfaction, customer loyalty effects on the empirical test [J]. Statistics and Decision, 2008 (19): 182-184.