A Step Forward to Revolutionise Intrusion
Detection System Using Deep Convolution Neural Network
Ratul Chowdhury1, Arindam Roy2, Banani Saha3, and Samir Kumar Bandyopadhyay4 1
FUTURE INSTITUTE OF ENGINEERING AND MANAGEMENT, India, [email protected] 2
UNIVERSITY OF CALCUTTA, India, [email protected] 3
UNIVERSITY OF CALCUTTA, India, bsaha_29 @yahoo.com
4
UNIVERSITY OF CALCUTTA, India, 1954 [email protected]
Abstract. Cyber security plays an important role to protect our computer, network, program and data from unauthorized access. Intrusion detection system (IDS) and intrusion prevention system (IPS) are two main categories of cyber security, designed to identify any suspicious activities present in inbound and outbound network packets and restrict the suspicious incident. Deep neural network plays a significant role in the construction of IDS and IPS. This paper highlights a novel IDS using optimized convolution neural network (CNN-IDS). An optimized CNNIDS model is an improvement over CNN which selects the best weighted model by considering the loss in every epoch. All the experiments have been conducted on the well known NSL-KDD dataset. Information gain has been used for dimensionality reduction. The accuracy of the proposed model is evaluated through optimized CNN for both binary and multiclass categories. Finally, a critical comparison has been performed with other general classifiers like J48, Naive Bayes, NB tree, Random forest, Multilayer Perceptron (MLP), Support Vector Machine (SVM), Recurrent Neural Network (RNN) and Convolution Neural Network(CNN). All the experimental results demonstrate that the optimized CNN-IDS model records the best recognition rate with minimum model construction time.
Keywords: Intrusion Detection System· NSL-KDD Dataset· One Hot Encoding· Information Gain; Convolution Neural Network
1
Introduction
The enormous use of internet in our day to day life has given rise to cyber threats in both volume and variety. Each and every day, countless number of threats is being generated whose signatures are slightly different from one another and it becomes very difficult to detect such newborn threats. To overcome this situation, the responsibilities of cyber security predominantly increase. IDS and IPS are two main pillars of cyber security [7][29]. Over the past few decades, lot of research works have been performed in this domain but these new signature based unknown threats always pose a challenge in front of the researchers. In this aspect, researchers have adopted different machines learning concepts for the construction of intelligent IDS. Ever since Professor Hinton introduced the concept of deep learning in 2006, it came into lime light. Nowadays, it is demandingly used in various domains such as: Natural Language Processing (NLP), Action Reorganization, Handwriting Recognition, Emotion Detection etc[27][4]. Various deep learning concepts like CNN, RNN, LSTM, Auto-Encoders are also used in the domain of cyber security[6].
Based on the learning methods, IDSs are categorized into 3 types: i. Supervised ii. Unsupervised and iii. Semi supervised approach [2]. In supervised approach, all the instances in a dataset have a
corresponding level and based on the differences between the actual and predicted level, the training of the IDS has been performed. In unsupervised approach, the instances have no level, it creates a statistical model based on the behavior of the training set and identifies anomalies which deviates from the normal behavior. Semi supervised method lies between supervised and unsupervised method. With regards to the detection method, IDSs are further categorized into 3 types: i. Misuse based ii. Anomaly based iii. Hybrid [5] [20]. The misuse based or signature based IDS can identify known attack only. So the main drawback of these types of IDSs is it can’t identify zero-day attack. The anomaly based IDSs create a model on the basis of the system activity and classify anomalies which deviate from the normal activity. The main drawback here is the increased number of false alarm rate. Finally, the hybrid IDS is a combination of both misuse and anomaly based method. Another classification of IDSs is Host-based and Network-based IDSs. A host-based IDS locally monitors a system on which it is installed and it responds the designated authority by collecting information from the activity and behavior of that particular system The sources from which the host based IDSs collect information are from different logs generated by the operating system. Network-based IDS on the other hand analyzes the incoming and outgoing packets of a particular network and attempt to detect anomalies from them.
In this paper a method is proposed using network-based misused approach which follows supervised learning. Here Information Gain and Optimized CNN has been used for the purpose of attribute reduction and classification respectively. The NSL-KDD dataset has been selected for experimental purpose. It is the modified version of KDD Cup dataset, consists of 125973 and 22544 number of instances for training and testing. The dataset consists of 22 types of latest attacks that are categorized into 4 types: i. Denial of Service attack ( DOS ) ii. User to Root attack (U2R) iii. Remote to User attack (R2L) and iv. Probing [21]. After applying information gain out of 41 features, only 11 high valued features are selected and on the basis of the selected features binary and multi class classification have been performed.
The rest of the paper is structured as follows, section 1.1 reflects the related work portion, section 1.2 describes the detailed CNN architecture, section 2 shows the proposed model, section 2.4 describes the detailed CNN-IDS model, section 3 describes the evaluation metrices, section 3.2 analyzes the results, section 4 performs various comparisons and the conclusion and future scopes are presented in section 5.
1.1 Related Works
approach recorded highest detection rate on the mentioned data set. SVM is another classification technique that is used in higher dimension and it produces higher detection rate only if the data set is not linearly separable. Jayshree Jha and Leena Ragha [15] used SVM for intrusion detection. Since the number of dimensions affects the performance of SVM, so, after applying the information gain as a dimensionality reduction technique, the SVM was used and the accuracy was quite impressive. Moreover, in [10] A.C. Enache and V. V Patriciu adopted Swarm Intelligence algorithm for feature selection and the resultant feature set was fed into a SVM classifier. They had used the NSL-KDD dataset but randomly chosen only 9,566 number of records for training and testing purpose which was too small as compared to the actual size of the data. Y Li et al. [16] applied a completely new intrusion detection technique by gradually removing the features. They had developed a hybrid model with the combination of clustering method, ant colony optimization and SVM. The proposed combined classifier worked efficiently with minimum number of feature set. MLP is another type of feed forward network with more than one hidden layers. According to the number of hidden layers, MLP can be considered as a machine learning as well as deep learning approach. F Amato et al. [3] applied MLP on KDD Cup’99 dataset. A greedy stepwise approach was used for dimensionality reduction and after that only 11 relevant features were chosen for classification. Except U2R and R2L, the overall accuracy was up to the mark.
After the concept of deep learning was introduced, a new platform has opened for the researchers. Z Li et al. [17] presented CNN for the construction of IDS. Since CNN performs effectively for image classification, they have converted the NSL-KDD dataset into image format after applying a range specific one hot encoding. Though the idea was very impressive but accuracy level was not up to the mark. Similarly, V Vinayakumar et al. [24] proposed another hybrid approach through CNN, CNN-RNN, CNN-LSTM and CNN-GRU. Their model evaluates the effectiveness of CNN by modeling the network traffic events as time series of TCP/IP packets. 10% of the KDD Cup’99 dataset was used for testing purpose. The experimental result shows that CNN 3 layer-LSTM gives highest accuracy. In another work, W Wang et al. [26] introduced a new malware traffic classification using CNN. The raw traffic data was directly fed into the classifier, and the classifier can learn the features automatically. The main limitations of the work were that they had used only spatial features of traffic and didn’t perform any parameter tuning in CNN. Similarly, C Yin et al. [28] used RNN for intrusion detection. They applied the full NSL-KDD dataset to perform their experiment and obtained highest accuracy among all the maintained classifiers. W Wang et al. [25] also proposed a combined concept using CNN and LSTM where their IDS learns the low level spatial features by using CNN and high level temporal features using LSTM. The dataset used were DARPA 1998 and ISCX 2012 and the accuracy level of the model outperforms with other published approaches. Authors have also proposed techniques through unsupervised learning which are more challenging. Deep Auto-encoder is an unsupervised learning tool, which was used by Fahimen et al. [11]. To overcome the problem of over fitting and local optima, they trained their model in greedy-step wise fashion and evaluated the accuracy on the KDD Cup’99 data set.
After analyzing the above works, it can be concluded that instead of several research attempts in this domain, there is still a lot of room for improvement. In the past few years, lot of cyber attacks has been witnessed. Each and every day numerous threats are developing with new signature. Therefore, improvement can be performed in the area focusing on: i. Enhancing recognition accuracy ii. Working with current dataset iii. Construction of IDS based on unsupervised and hybrid approach.
1.2 Basic CNN Model
Fig.1. Detailed CNN Model
The first layer is convolution layer. The main objective of this layer is to take a dot product between the filter and a small chunk of image and finally convolve the filter over all spatial locations of the image. The output of the convolution layer is known as activation map. For n number of input images, n separate activation maps are obtained. The relationship between the size of the input image and activation map is defined in equation 1.
(1)
Where, N = Input image dimension, F = Filter size, Stride = Filter movement. The size of the input image and activation map can be equal by padding zeros to the both side of the activation map. After convolution layer, the activation function ReLU has been applied on each of the activation maps. The ReLU has been chosen as an activation function because the CNN cannot recognize negative values. The output of the ReLU activation function is 0, when X is less than 0 and the output is X when X is greater than 0, where X is considered as an input. The third one is the pooling layer. The pooling layer makes the representation smaller and manageable. It operates over each activation map independently and reduces its size. This layer also uses a filter and according to the size of the filter, the dimension of the activation map is down sampled. Instead of taking the dot product, the polling layer chooses the maximum, minimum or average value from the chunk of the image for Max pool, Min pool and Average pool technique. The filter movement will depend on the size of the stride. In fully connected layer, the N dimensional input is transformed into one dimension and the number of neurons in the fully connected layer is exactly equal to the number of classes present in the problem.
2
Proposed Model
The method selected is the optimized CNN due to the following reasons. Firstly, it has automatic feature extraction capability which helps to extract the relevant information from the input. In the domain of intrusion detection, dynamic feature extraction capability plays a significant role. Secondly, it has added advantages over fully connected network. Since, we are using NSL-KDD dataset, the number of instances in training and testing are huge because of which the fully connected network becomes denser and the model construction time enormously increases. Whereas the CNN model uses local spatial coherence concept which makes the number of input sparse, as the weights of some parameters are shared. So it is concluded that the CNN model extracts the relevant information at a low computation cost. Thirdly, when the size of dataset is huge over fitting is a major and common problem in which the training is too well but the system negatively impacts on test set. The CNN model uses the dropout layer to eliminate the problem of over fitting and consequently, cross validation can also be implemented in CNN to limit the problem.
saves the best weighted model for testing. In comparison section we have shown that the CNN-IDS model gives higher detection rate than normal CNN.
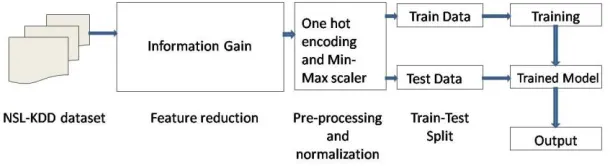
This section depicts the proposed model where the training and testing parts of the NSL-KDD dataset have been used separately. Initially, feature reduction and preprocessing and normalization are the two common phases through which the dataset has been prepared for classification. In next phase, the KDDTrain+ has been used for training and KDDTest+ and KDDTest-21 have been used for testing purpose. The detailed model is shown in fig 2.
Fig.2. Detailed CNN-IDS Model
2.1 Dataset Description
The NSL-KDD dataset was generated in 2009 that has significant advantages over KDD’99 data set [9] [22]. It reduces the size of the KDD’99 data set by eliminating the redundant and duplicate records from the dataset and hence allowing the complete dataset to be used for experimental purpose. The data files contained in NSL-KDD dataset covers KDDTrain+ for training and KDDTest+ and KDDTest-21 for testing. The number of records in each dataset is shown in Table 1.
Table 1. Basic NSL-KDD Dataset
Dataset Total Normal DoS Probe R2L U2R KDDTrain+ 125973 67343 45927 11656 995 52 KDDTest+ 22544 9711 7458 2421 2754 200 KDDTest-21 11850 2152 4342 2402 2754 200
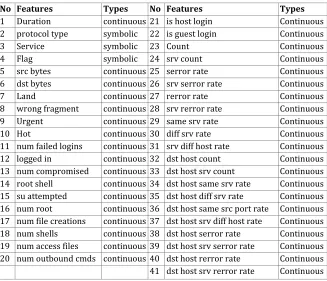
Table 2. Detailed feature description of NSL-KDD dataset
No Features Types No Features Types
1 Duration continuous 21 is host login Continuous 2 protocol type symbolic 22 is guest login Continuous
3 Service symbolic 23 Count Continuous
4 Flag symbolic 24 srv count Continuous
5 src bytes continuous 25 serror rate Continuous 6 dst bytes continuous 26 srv serror rate Continuous
7 Land continuous 27 rerror rate Continuous
8 wrong fragment continuous 28 srv rerror rate Continuous 9 Urgent continuous 29 same srv rate Continuous 10 Hot continuous 30 diff srv rate Continuous 11 num failed logins continuous 31 srv diff host rate Continuous 12 logged in continuous 32 dst host count Continuous 13 num compromised continuous 33 dst host srv count Continuous 14 root shell continuous 34 dst host same srv rate Continuous 15 su attempted continuous 35 dst host diff srv rate Continuous 16 num root continuous 36 dst host same src port rate Continuous 17 num file creations continuous 37 dst host srv diff host rate Continuous 18 num shells continuous 38 dst host serror rate Continuous 19 num access files continuous 39 dst host srv serror rate Continuous 20 num outbound cmds continuous 40 dst host rerror rate Continuous 41 dst host srv rerror rate Continuous 2.2 Data Preprocessing and Normalization
The preprocessing and normalization process has been performed before dimensionality reduction. Initially, there were 41 features in the NSL-KDD dataset containing some numeric and non numeric features. As the CNN-IDS model takes only numeric value, it is required to convert the non-numeric features into numeric form. The one hot encoding technique has been used to convert the non numeric features into numeric pattern. So, the 41 dimensional feature set is further extended into 123 dimensional features. The method selected only 11 relevant features consisting of total 8 numeric and 3 non-numeric features. The non-numeric features are: ‘protocol’, ‘service’ and ‘flag’. The protocol field contains 3 different types of protocol ’tcp’, ’udp’ and ’icmp’ which are converted into binary vectors (1,0,0), (0,1,0) and (0,0,1) by using one hot encoding. Similarly, the features service and flags have 70 and 11 varieties respectively, which are also encoded into binary form. The second part is normalization. Since the difference between the maximum and minimum values of some attributes has a very large scope, so we have normalized it between range [0-1] by using equation 2, where MAX and MIN are the maximum and minimum values of each feature respectively.
(2)
2.3 Dimension Reduction
Dimension reduction always has a significant role to overcome the problem of over fitting and local optima. Information gain is a decision tree based dimension reduction technique [12]. It finds the most appropriate attributes which contains large number of distinct values. Let D be the no of instances present in a particular dataset and Pi be the probability that an arbitrary instance in D belongs to a particular class Ci. The expected information (entropy) needed to classify an instance D is defined as:
where m is the no of classes. Information needed to classify a particular attribute A in D is given by: (4)
where V is the no of partitions obtained after splitting D with respect to A. Information gain by branching on attribute A is expressed as:
gain(A) = Info(D) − InfoA(D) (5)
In this paper the method extracted the information gain value of all the 41 attributes that are present in NSL-KDD dataset and finally 11 high valued features are selected for experimental purpose. The selected features are service, flag, src bytes, dst bytes, land, wrong fragment, root shell, count, diff srv rate and dst host same src port rate.
2.4 CNN Structure of the Proposed Model
The CNN-IDS model takes the input in the form of a 10*10 2D array. The 93 dimensional features are forcefully converted into 10*10 2D array by padding some successive 0’s at the end. The 10*10 input dataset is fed through a sequence of convolution and maxpooling layer as mentioned in fig 1. The first and second convolution layers consist of 32 and 64 number of 3*3 filters and the final output is collected from the fully connected layer passing through a Softmax activation function. An intermediate dropout layer has also been used to overcome the problem of over fitting. The model has been trained in successive epochs to evaluate the best model. In every iteration the successive losses have also been compared to select the best model.
3
Evaluation Metrices
The proposed method used 5 important performance indicators to evaluate the performance of the model.
1. Accuracy(AC): It is basically the percentage ratio of correctly classified instances to the total number
of instances.
(6)
2. Precision: It is the ratio of relevant instances to the retrieved instances.
(7)
3. Recall: It is the ratio of relevant instances that have been retrieved to the total amount of relevant
instances.
(8)
4. F1 Score: It is the weighted average of Precision and Recall.
(9)
5. Support: Support is the true instances that lie in that class.
– TP (True positive): is the number of positive instances that are corrected classified.
– TN(True negative):is the number of negative instances that are correctly classified.
– FP(False positive):is the number positive instances that are wrongly classified.
– FN(False negative):is the number of negative instances that are wrongly classified. Hence a good IDS always have a good detection rate and low false alarm rate.
3.1 Experimental Setup
In this work for preprocessing and classification purpose, the method used the most promising machine learning package Keras 2.1.6 in python 3.6.4 environment and for feature reduction another machine learning tool Waikato Environment for Knowledge Analysis (Weka) has been used [19]. All the experiments have been done on a personal notebook with Intel core i7-2760M CPU @ 2.70 GHz configuration and 8GB memory. The experimental section is divided into two parts: Binary classification and Multiclass classification. In Binary classification, the total NSL-KDD dataset has been divided into two classes: Normal and Attack. In Multiclass classification, the dataset is further divided into 5 classes: Normal, DOS, U2L, R2L and Probing. Finally, a critical comparison has been performed with other existing classifiers and some recent works.
3.2 Result Analysis
In order to perform the result analysis, the relevant 11 dimensional features are further mapped into 93 dimensional features and that are fed into the CNN for classification. Binary classifications are required to identify is there any attack are present or not, on the other hand Multiclass classifications are specifically identify the type of the attack.
3.2.1 Binary classification: In Binary classification, all the 4 type of attacks has been categorized in one group called Attack and the rest are defined as Normal type. The method is trained for the model in different epochs for better efficiency. The results obtained in different epoch with their respective model construction time are summarized in table 3. The table also shows the training and testing accuracy of the mentioned dataset.
Table 3. Reorganization Accuracies attained by CNN-IDS model in Binary classification
No of epochs KDDTrain+ KDDTest+ KDDTest-21 Time ( Sec )
20 98.71% 82.36% 68.39% 631.45
40 98.99% 84.57% 72.56% 1299.01
60 99.05% 84.55% 72.59% 1934.34
80 99.25% 84.51% 71.95% 2656.71
100 99.07% 84.58% 73.17% 3305.93
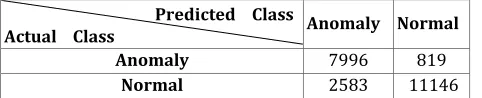
Table 4. Confusion matrix for KDDTest+ Dataset
Anomaly Normal
Anomaly 7996 819
Normal 2583 11146
Table 5 represents the confusion matrix for KDDTest-21 dataset. Here, the total 11850 number of records are diversified into 4 groups: TN=1354, FP=761, FN=2418 and TP=7317, which creates the overall accuracy 73.17%. The table also shows that the model has very nominal false alarm rate.
Table 5. Confusion matrix for KDDTest-21 Dataset
Anomaly Normal
Anomaly 1354 761
Normal 2418 7317
In Table 6, we have estimated the Precision, Recall, F1-score and Support value for both the datasets. The usefulness of the predicted result depends upon a high Precision value. On the other hand, a high Recall value describes how complete the predicted results are. The derived Precision and Recall value shows the high success rate of the model.
Table 6. Precision, Recall, F1-Score and Support values for Binary Classification
KDDTest+
Precision Recall F1-Score Support
0 0.76 0.91 0.82 8815
1 0.93 0.81 0.87 13729
Avg/total 0.86 0.85 0.85 22544 K DDTest -21
Precision Recall F1-Score Support
0 0.36 0.64 0.46 2115
1 0.91 0.75 0.82 9735
Avg/total 0.81 0.73 0.76 11850
3.2.2 Multiclass Classification: Initially, in Binary classification, the records of the NSL-KDD dataset were divided into two groups: Normal and Attack. In Multiclass classification, the attack types are further classified into 4 sub categories: DOS, U2R, R2L and Probing. Table 7 summaries accuracy obtained in different epoch with their respective model construction time. It is observed that the model gives highest training accuracy of 98.79% in 100 epochs and at the same time it produces 83.29% and 68.67% testing accuracy for KDDTest+ and KDDTest-21 dataset.
Table 7. Reorganization Accuracies attained by CNN-IDS model in Multiclass classi- fication
No of epochs KDDTrain+ KDDTest+ KDDTest−21 Time ( Sec )
20 98.62% 75.31% 53.44% 1829.62
40 98.72% 76.25% 55.21% 2240.79
60 98.75% 76.31% 55.49% 2760.25
80 98.78% 80.01% 62.45% 3667.81
100 98.79% 83.29% 68.67% 4492.93
Actual Class Predicted Class
The confusion matrix for KDDTest+ and KDDTest-21 dataset in Multiclass category are listed in table 8 and table 9 respectively. Here, the mapping of Actual class and Predicted class outputs are shown in a 5*5 matrix that records overall 83.29% and 68.67% recognition accuracy for both the testing dataset.
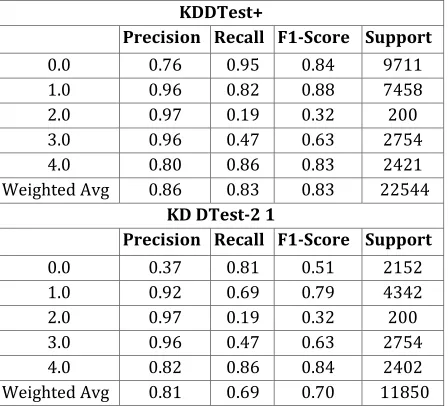
If the dataset is imbalanced i.e. the number of instances in each class are not equal, then accuracy doesn’t reflect the equal distribution of the detection rate in each category. The Precision, Recall. F1-Score and Support shows the detection rate in each category. Table 10 describes the Precision, Recall, F1-Score and Support values for Multiclass classification. As mentioned in the previous section the Precision values are based on positive instances and the Recall values show the negative cases. The combined F1-Score of table 10 intuitively reflects that the model gives better detection rate for Normal, DoS and Probe types of attack.
Table 8. Confusion matrix for KDDTest+ Dataset in Multiclass categories
Normal DoS U2R R2L Probe
Normal 9243 83 1 30 354
DoS 1192 6122 0 0 144
U2R 151 0 38 11 0
R2L 1445 2 0 1298 9
Probe 161 173 0 11 2076
Table 9. Confusion matrix for KDDTest-21 Dataset in Multiclass categories
Normal DoS U2R R2L Probe
Normal 1739 83 1 30 299
DoS 1192 3006 0 0 144
U2R 151 0 38 11 0
R2L 1445 2 0 1298 9
Probe 161 173 0 11 2057
Table 10. Precision, Recall, F1-Score and Support values for Multiclass Classification
KDDTest+
Precision Recall F1-Score Support
0.0 0.76 0.95 0.84 9711
1.0 0.96 0.82 0.88 7458
2.0 0.97 0.19 0.32 200
3.0 0.96 0.47 0.63 2754
4.0 0.80 0.86 0.83 2421
Weighted Avg 0.86 0.83 0.83 22544 KD DTest-2 1
Precision Recall F1-Score Support
0.0 0.37 0.81 0.51 2152
1.0 0.92 0.69 0.79 4342
2.0 0.97 0.19 0.32 200
3.0 0.96 0.47 0.63 2754
4.0 0.82 0.86 0.84 2402
Weighted Avg 0.81 0.69 0.70 11850 Actual Class Predicted Class
4
Comparisons And Discussions
In order to compare the performance of the proposed model, different machine learning and deep learning approaches performed by various researchers are considered and comparison between normal CNN and optimized CNN has been performed. Although, lot of research works have been performed on the same benchmark NSL-KDD dataset but only a few have used the complete dataset to analyze the result. In [23] and [28], the authors have used the complete dataset to estimate the results obtained by various classifiers such as J48, Naive Bayes, NB Tree, Random Forest, Random Tree, MLP, SVM and RNN. As in [28-29], the highest accuracy achieved by the CNN is not more than 83.79% and 72.76 % for the KDDTest+ and KDDTest-21 datasets respectively. From table 11, it is clearly seen that the performance and detection rate of the optimized CNN-IDS model outperforms among all the classifiers.
Table 11. A brief summary of the present work with some past work in Binary Classification Classifier KDDTest+ KDDTest-21
J48 81.05% 63.97 %
Naive Bayes 76.56% 55.77 % NB Tree 82.02% 66.16 % Random Forest 80.67% 63.26 % Random Tree 81.59% 58.51 %
MLP 77.11% 57.34 %
SVM 69.52% 42.29 %
RNN 83.28% 68.55 %
CNN 83.79% 72.76 %
CNN-IDS 84.58% 73.17 %
Authors have also estimated the detection rate of NSL-KDD dataset in Multiclass category [24]. From table 12, it is observed that the results obtained by the CNN-IDS model in Multiclass category are also superior to other machine learning and deep learning approaches. The model records 84.66% and 72.37 % reorganization accuracy for the KDDTest+ and KDDTest-21 datasets.
Table 12. A brief summary of the present work with some past work in Multiclass Classification Classifier KDDTest+ KDDTest-21
J48 74.69% 51.90 %
Naive Bayes 74.40% 55.77 % NB Tree 75.49% 55.40 % Random Forest 74.00% 50.80 % Random Tree 72.80% 49.70 %
MLP 78.10% 58.40 %
SVM 74.00% 50.70 %
RNN 81.29% 64.67 %
CNN 81.66% 65.57 %
CNN-IDS 83.29% 68.67 %
5
Conclusion And Future Scope
A complete Intrusion Detection System based on Optimal Convolution Neural Network is proposed. The CNN-IDS not only has an automatic intermediate feature generation capability, but also produces higher accuracy in both Binary and Multiclass categories. The advantages of the CNN-IDS model are that it has a higher detection rate with minimal model construction time. It works with only 11 features instead of 41 features which helps in giving higher accuracy within a very short interval of time. In this paper most recent works are compared with the proposed model with respect to detection rate, Precision, Recall, F1-Score and Support.
References
1. Nsl-kdd dataset http://www.unb.ca/cic/datasets/nsl.html
2. Aburomman, A.A., Reaz, M.B.I.: Survey of learning methods in intrusion detection systems. In: 2016 international conference on advances in electrical, electronic and systems engineering (ICAEES). pp. 362– 365. IEEE (2016)
3. Amato, F., Cozzolino, G., Mazzeo, A., Vivenzio, E.: Using multilayer perceptron in computer security to improve intrusion detection. In: International Conference on Intelligent Interactive Multimedia Systems and Services. pp. 210–219. Springer (2018)
4. Amer, M.R., Siddiquie, B., Richey, C., Divakaran, A.: Emotion detection in speech using deep networks. In: 2014 IEEE International Conference on Acoustics, Speech and Signal Processing (ICASSP). pp. 3724–3728 (2014)
5. Axelsson, S.: Intrusion detection systems: A survey and taxonomy. Tech. rep., Technical report (2000) 6. Berman, D.S., Buczak, A.L., Chavis, J.S., Corbett, C.L.: A survey of deep learning methods for cyber security.
Information 10(4), 122 (2019)
7. Brown, D.J., Suckow, B., Wang, T.: A survey of intrusion detection systems. Department of Computer Science, University of California, San Diego (2002)
8. Cannady, J.: Artificial neural networks for misuse detection. In: National information systems security conference. vol. 26, pp. 443–456. Baltimore (1998)
9. Dhanabal, L., Shantharajah, S.: A study on nsl-kdd dataset for intrusion detection system based on classification algorithms. International Journal of Advanced Research in Computer and Communication Engineering 4(6), 446–452 (2015)
10. Enache, A.C., Patriciu, V.V.: Intrusions detection based on support vector machine optimized with swarm intelligence. In: 2014 IEEE 9th IEEE international symposium on applied computational intelligence and informatics (SACI). pp. 153–158.
IEEE (2014)
11. Farahnakian, F., Heikkonen, J.: A deep auto-encoder based approach for intrusion detection system. In: 2018 20th International Conference on Advanced Communication Technology (ICACT). pp. 178–183. IEEE (2018) 12. Farid, D., Darmont, J., Harbi, N., Nguyen, H.H., Rahman, M.Z.: Adaptive network intrusion detection learning:
attribute selection and classification (2009)
13. Farnaaz, N., Jabbar, M.: Random forest modeling for network intrusion detection system. Procedia Computer Science 89(1), 213–217 (2016)
14. Ingre, B., Yadav, A.: Performance analysis of nsl-kdd dataset using ann. In: 2015 international conference on signal processing and communication engineering systems. pp. 92–96. IEEE (2015)
15. Jha, J., Ragha, L.: Intrusion detection system using support vector machine. International Journal of Applied Information Systems (IJAIS) 3, 25–30 (2013)
18. Lippmann, R.P., Cunningham, R.K.: Improving intrusion detection performance using keyword selection and neural networks. Computer networks 34(4), 597–603 (2000)
19. Markov, Z., Russell, I.: An introduction to the weka data mining system. ACM SIGCSE Bulletin 38(3), 367– 368 (2006)
20. Nisioti, A., Mylonas, A., Yoo, P.D., Katos, V.: From intrusion detection to attacker attribution: A comprehensive survey of unsupervised methods. IEEE Communications Surveys & Tutorials 20(4), 3369– 3388 (2018)
21. Paliwal, S., Gupta, R.: Denial-of-service, probing & remote to user (r2l) attack detection using genetic algorithm. International Journal of Computer Applications 60(19), 57–62 (2012)
22. Revathi, S., Malathi, A.: A detailed analysis on nsl-kdd dataset using various machine learning techniques for intrusion detection. International Journal of Engineering Research & Technology (IJERT) 2(12), 1848–1853 (2013)
23. Tavallaee, M., Bagheri, E., Lu, W., Ghorbani, A.A.: A detailed analysis of the kdd cup 99 data set. In: 2009 IEEE symposium on computational intelligence for security and defense applications. pp. 1–6. IEEE (2009) 24. Vinayakumar, R., Soman, K., Poornachandran, P.: Applying convolutional neural network for network
intrusion detection. In: 2017 International Conference on Advances in Computing, Communications and Informatics (ICACCI). pp. 1222–1228. IEEE (2017)
25. Wang, W., Sheng, Y., Wang, J., Zeng, X., Ye, X., Huang, Y., Zhu, M.: Hastids: Learning hierarchical spatial-temporal features using deep neural networks to improve intrusion detection. IEEE Access 6, 1792–1806 (2017)
26. Wang, W., Zhu, M., Zeng, X., Ye, X., Sheng, Y.: Malware traffic classification using convolutional neural network for representation learning. In: 2017 International Conference on Information Networking (ICOIN). pp. 712–717. IEEE (2017)
27. Wu, D., Sharma, N., Blumenstein, M.: Recent advances in video-based human action recognition using deep learning: A review. In: 2017 International Joint Conference on Neural Networks (IJCNN). pp. 2865–2872 (2017)
28. Yin, C., Zhu, Y., Fei, J., He, X.: A deep learning approach for intrusion detection using recurrent neural networks. Ieee Access 5, 21954–21961 (2017)